Transcription
Paper 5142-2020Moving from Messy Data to a Clean Analytic Dataset: CommonData Management Techniques using SAS Raymond B. Smith, University of South Carolina; Jason A. Schoeneberger, ICFInternational; Bethany A. Bell, University of South CarolinaABSTRACTDespite the amount of quantitative research that exists in the social and behavioralsciences, many graduate programs do not offer classes focused on the multitude of stepsnecessary to manage quantitative datasets. Instead, this skill is often learned through trialand error with the beginning SAS user having to use multiple resources, including, but notlimited to the plethora of proceedings papers from SAS Global Forum as well as regionalusers’ groups as well as other SAS friendly resources such as UCLA’s Institute for Researchand Digital Education and SAS publications. Although these resources are incredibly usefulwhen a SAS user knows what procedure he/she needs, they are less useful for the noviceanalyst who does not know where to begin. The focus of this paper is to help guide thenovice user through common data management techniques to transform raw, messy datainto an analytic dataset. This paper contains information on data management processes asbasic as getting an external data set into SAS to more advanced techniques such asconducting exploratory factor analysis and creating composite variables. We illustrate thevarious processes using Wave 1 public use data from the National Longitudinal Study ofAdolescent to Adult Health (Add Health).Keywords: data cleaning, data management, data manipulationINTRODUCTIONThe goal of data cleaning is to ensure that the data used within the analytic processprovides an accurate representation of the constructs that are being examined. Datasetsusually contain numerous irregularities such as outliers or codes to indicate various forms ofmissingness (i.e, truly missing, skip patterns, refusals, etc.), which can significantly impactthe analytic outcomes if the irregularities are unknowingly included. However, through datamanagement and manipulation techniques, datasets can be cleaned to produce high-qualityresults that have incorporated better analytic decisions and outcomes due to a morerepresentative and accurate dataset. Thus, the purpose of this paper is to provide aroadmap for data cleaning, management, and manipulation using a multitude of SAS features and procedures. Although there are multiple ways to accomplish many tasks inSAS , the methods and approaches shared in this paper are those that are commonly usedin the social and behavioral sciences and are intended for those new to managing data.Illustrations of SAS procedures and techniques included throughout this paper will comefrom Wave 1 public use data from the National Longitudinal Study of Adolescent to AdultHealth (Add Health; www.cpc.unc.edu/projects/addhealth). By using publicly available data,readers can download the data and work through the examples provided. Also, although weuse a large national dataset throughout the paper, please remember that the techniquesincluded in the paper are relevant to both large national datasets as well as smaller, locallycollected data. Messy data occur everywhere!!Topics covered in this paper include (a) the importance of knowing ones data and consulting(or creating) codebooks and users manuals; (b) how to read data into SAS; (c) how to1
suppress formats; (d) how to examine the contents of a dataset; (e) how to mergedatasets; (f) the importance of checking the log throughout the data management process;(g) how to convert missing data to SAS system missing; (h) how to create an age variablefrom interview and birth dates; (i) renaming variables; (j) dummy coding; (k) reversecoding; (l) how to create composite variables and assess reliability; (m) how to centervariables to ensure all variables have a meaningful zero; (n) how to assess missing datamechanisms; and (0) how to create an analytic data set, including dividing data into exploreand holdout samples.KNOW THY DATA!One of the most important steps that should be conducted prior to analyzing any dataset isreviewing the codebook and other documentation associated with the dataset that isselected for use. When working with national datasets such as Add Health, ECLS-K, NLSY,etc., codebooks and other documentation such as users’ manuals and/or appendices areincluded when you download the data. However, if you are working with either primarydata that you or a colleague collected, these materials might not exist. If that is the case,then the first step in the data management process is to create them.Codebooks typically contain the information on how each variable in the dataset wascollected – the exact wording used on the survey as well as the response options aspresented in the survey and how each response option has been coded in the dataset.Codebooks often also contain a frequency table that depicts item response rates and datamissingness characteristics. Appendix A contains a sample of the Add Health variables thatare used throughout the paper – the information provided was taken directly from the AddHealth codebook. By reviewing these items and available responses, the researcher will beinformed as to whether the item is categorical or continuous, or if there are specific criteriathat may exclude participants from responding. Further, the characteristics of itemmissingness are also included within the frequency table, which may be the result ofunknown source of missing, participants refusing to answer an item, participants notknowing the answer to the question, or participants not being selected to answer a specificitem (e.g., a legitimate skip).For Add Health data, there are two codebooks – a PDF version that you get when youdownload the data (this is discussed more in the next section) and an online codebook –Add Health Codebook Explorer ation/ace/tool/. Whereas theCodebook Explorer is useful once you have identified the variables of interest for your study,it is less useful when you are first learning about the data and the variables that areavailable to you.Users’ manuals and other supplemental materials often include details on how the studywas conducted (e.g., how were participants recruited/selected, what were the studyinclusion criteria, etc.), copies of all questionnaires as they were administered toparticipants as well as information on any data management that the owners of the datahave already conducted (i.e., a composite measure of socioeconomic status that wascreated from education and income variables in the dataset), scale reliability and validity,and when working with nationally representative data that used complex sample design,information regarding the use of analytical variables such as weights, clustering, andstratification. We do not cover details on analyzing complex survey data, however, there aremany terrific papers that provide this information (e.g., Berglund, 2009; D’AgostinoMcGowan & Toll, 2015; Lewis, 2010)When a researcher is working with a primary dataset and no documentation has beencreated, he/she should use the above information as a guideline for what to include in a2
codebook and users’ manual. In doing so, remember that you need to create enoughdocumentation that a person not involved in the research study can correctly use the dataand be able to describe the details on all aspects of the study.GETTING DATA INTO SAS AND CREATING A WORKINGDATAFILEBefore managing your data, first you need to obtain it! Whereas Add Health data andcorresponding documentation can be accessed from multiple documentation/publicdata) from ourexperience, obtaining the data and documentation from the ICPSR is udies/21600/datadocumentation.For this paper, if you would like to follow the examples, go to the ICPSR link and downloadtwo datafiles: DS1 Wave I: In-Home Questionnaire and DS2 Wave I: Public Use ContextualDatabase. The downloaded material will be in ZIP files. So, before you can access them, youneed to unzip the files. Once each of the two ZIP files have been unzipped SAS CTRANSPORT files, as well as other study documentation including users’ manuals andcodebooks, will appear. The SAS C-TRANSPORT files are named “21600-0001-Data.stc”(which is the In-Home Questionnaire) and “21600-0002-Data.stc” (which is the ContextualDatabase). The C-TRANSPORT file type is common when downloading data from nationalresearch studies. The example below provides details on how to move from a TRANSPORTfile to a sas7bdat SAS datafile. Reading other types of datafiles (Excel, SPSS, Stata, CSV,etc.) can be done using the Import Wizard. Whereas we will focus on getting SAS CTRANSPORT files read into SAS, Matlapudi & Knapp (2012) provide illustrative examples ofimporting other types of data into SAS.SAS Code to read in the SAS C-TRANSPORT In-Home Questionnaire data:filename in c";libname out 'C:\Users\bellb\Documents\SESUG';proc cimport file in library out; run;In the above code, the FILENAME command is used to instruct SAS which datafile to read –you can see that the TRANSPORT file (21600-0001-Data.stc) is located on a computer onthe C drive under user bellb, in the documents folder, in a subfolder called “SESUG”. Whenusing the FILENAME command you need to provide the directory location of the stc file ANDthe name of the datafile. Next, the LIBNAME command refers to the location on thecomputer where SAS will place the.sas7bdat datafile – in this example, it is the samelocation used in the FILENAME command, however, it does not have to be if you were towant to save the .sas7bdat file in a different folder, you can do that.The PROC CIMPORT is the part of the code where the TRANSPORT file is converted to a SAS(.sas7bdat) file. This code directs SAS to read the file specified above in the FILENAME(FILE in) command and to put the converted datafile in the location specified in theLIBNAME command (library out). Using “in” and “out” as the names for the locationsassociated with the FILENAME and LIBNAME commands is arbitrary – you can use any“name” as long as it starts with a letter. We use “in” and “out” to help illustrate that we arereading “in” the TRANSPORT datafile and then we are “out” putting the converted file.During the PROC CIMPORT process, SAS automatically names the newly created datafile –in this example the new SAS datafile is named “da21600p1.sas”. We recommend creating acopy of the datafile and giving it a more meaningful name.SAS Code to rename a permanent SAS datafile:libname AH 'C:\Users\bellb\Documents\SESUG';options nofmterr;3
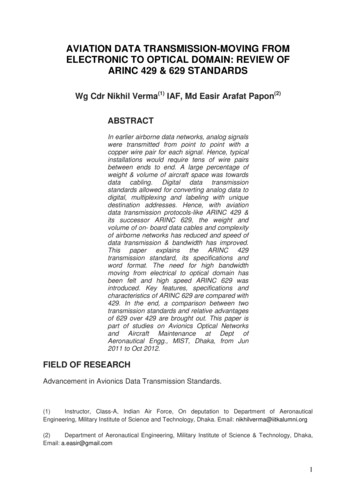
data ah.inhome;set ah.da21600p1; run;In the code above, notice we list the new datafile name “ah.inhome” then the old datafilename “ah.da21600p1”. Think of this like the “Save As” function in Word – you take onedatafile and you save a copy of it with a new name. The OPTIONS NOFMTERR portion of thecode is necessary to allow SAS to access the Add Health datafile. Like many nationaldatasets, the Add Health data have user defined formats applied to them. You can accessthose format files if you want to, but, in our experience, that process is not easy givenincompatibility issues between formats created in previous versions of SAS. Thus, using theNOFMTERR option suppress the formats within the SAS datafile. However, do not beconcerned if you see a note about the formats in the log. Also notice that we have namedthe location on the computer where our SESUG folder as AH – i.e., LIBNAME AH. Again,using AH is arbitrary – you can use anything you wish as long as it starts with a letter. Forus, because we are working with Add Health data, AH seemed like a good option.Next, we want to create one master datafile that contains both the In-Home Questionnairedata and data from the Contextual data. Before we can do that, we would repeat the stepsabove (i.e., converting the transport file to a SAS datafile and providing the SAS datafilewith a meaningful name) using the Contextual Database instead of the In-HomeQuestionnaire data. To conserve space, that code is not shown, but is provided in the SASsyntax file that is available from the authors listed in the CONTACT INFORMATION section atthe end of the paper. After replicating the code for the Contextual data, we now have twoSAS datafiles – ah.inhome (as created using the code above) and ah.contextual (code tocreate not shown). The inhome datafile contains participant responses to all questionnaireitems and the contextual datafile contains data about the areas in which the adolescent lives(e.g., Census data). More details on the contents of both of these datasets are provided intheir respective users’ manuals and codebooks, which were included in the ZIP files whenthe data were downloaded.Before merging the two datafiles, you should examine the contents of each dataset. PROCCONTENTS provides the user with information on the number of observations in a dataset,the number of variables in a dataset, variable names (and labels when provided), as well asthe format of each variable (i.e., character or numeric). Knowing how many observationsand number of variables in each dataset is important to make sure that the merged datafilematches the details for each separate datafile.SAS code for examining the contents of each of our two datasets is below:proc contents data AH.inhome;proc contents data AH.contextual; run;Output 1 depicts partial output from PROC CONTENTS. Please note, the number ofobservations and variables is located in the upper righthand corner of the output.4
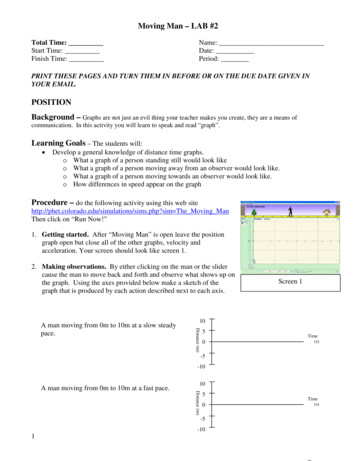
Output 1. Partial Output from PROC CONTENTS of the AH.Inhome DataAs shown in the PROC CONTENTS output (and reported in the Add Health codebook andusers’ manual), the Participant ID variable in Add Health data is “AID” – this variable is thekey linking variable across Add Health datasets (located in the Alphabetic List of Variablesand Attributes section of the output). This is important because this is the variable that willbe used to merge the two datafiles into one. To accomplish this, first you must sort eachdataset by AID.SAS code to sort two data files:proc sort data ah.inhome;by aid;proc sort data ah.contextual;by aid; run;The PROC SORT procedure is a command that directs SAS to order or rank observationswithin a dataset by the values of a designated variable. In this case, SAS is directed toorder all observations by participant ID (BY aid) within each separate dataset. Figure 1provides an example of how observations in In-home data (with variables I1, I2, I3, and I4)and observations in the Contextual data (with variables X1 & X2) are ordered by participantID (AID). The next step is to merge the two separate datasets into a singular dataset.In-Home DataAIDI1I2Contextual DataI3I4AID112233X1X2Figure 1: Illustration of Two Separate Datafiles Sorted by AIDThe MERGE procedure is a command that directs SAS to form a singular data set frommultiple datafiles. Our example shows how to merge two files, but, you can merge as many5
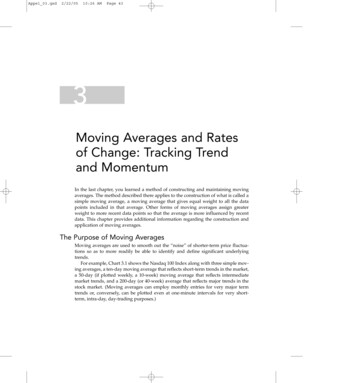
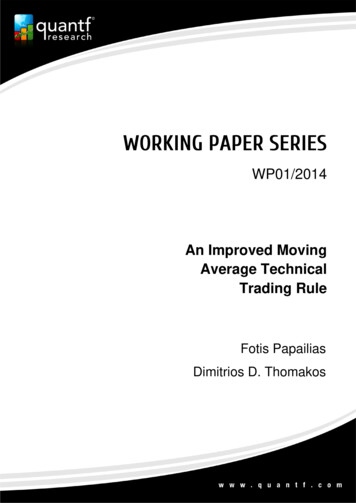
files as necessary. As long as each datafile has been sorted by the common/linking variablefirst.SAS code to merge two data sets:data ah.AH Combined;merge ah.inhome ah.contextual;by aid; run;Notice that the MERGE command happens within a data step – that is, before we tell SASwhich files to merge together, we must first provide a name for the merged datafile.Above, we have named the merged datafile “Combined” and it will be stored in the AHlibrary. After naming the merged dataset, SAS is being directed to combine (i.e., merge)ah.inhome and ah.contextual into AH Combined. Notice that the code above has more thanjust the MERGE command -- the BY command is a critical part of the merging process. Ifyou use the MERGE command without a “BY” statement, you will see an error in the log.Figure 2 shows how the two separate datasets shown in Figure 1 now appear in a singledataset. through the common variable AID (which again is the participant ID in the AddHealth data).Combined DataAIDI1I2I3I4X1X2123Figure 2. Example of Newly Merged DatafileAfter processing the MERGE command, the user should check the log for potential errorsand complete an additional PROC CONTENTS and review the output for successful creationof the combined datafile. Output 2 depicts the number of observations and variables foreach pre-consolidated dataset as well as the newly created data set. At first, you mighthave expected to see 2826(32 2794) variables in the combined dataset, however,remember that AID is the same variable included in each of the original two files. Thus,after merging the dataset, AID is consolidated across both datasets into a single variablewithin AH Combined (i.e., So, subtract one variable from the total and you arrive at 2825total variables). Also, notice that the number of observations is consistent across alldatasets.InhomeContextualCombinedOutput 2: Partial Output from PROC CONTENTS Used to Check the Number ofVariables and Observations after Merging Two DatasetsThe last step in creating a working dataset before cleaning data involves creating a datasetthat contains only the variables that will be used in the analytic process. As shown above,6
AH Combined has nearly 3,000 variables in it. Creating a smaller dataset that only containsvariables that will be used in your analytic procedures not only speeds up processing, butalso is necessary for some of the data cleaning procedures that are provided later in thepaper.Code for creating a datafile that only contains variables of interest for a study is below:data AH.Combined reduced var;set AH.Combined;keep AID H1GI1M H1GI1Y BST90P19 imonth iday iyearH1ED19 H1ED20 H1ED21 H1ED22 H1ED23 H1ED24 AH PVT; run;The KEEP command within SAS is an option that allows users to retain selected variableswhen creating a new dataset. In the above code, the new dataset“ah.combined reduced var” is a subset of ah.combined. Instead of containing nearly 3000variables, ah.combined reduced var contains 13 variables (i.e., the variables listed in theKEEP command).Once the reduced dataset is created, review the log to determine if the new dataset hasbeen created without error. Next, execute PROC CONTENTS on the new dataset todetermine if the correct number of variables and observations have been included within thenew dataset. The log will also inform you how many variables are retained in the newdatafile. This verification process is conducted in the same way as verifying that the MERGEwas completed correctly using the PROC CONTENTS function.CONVERTING MISSING DATA TO SAS MISSING NOTATIONEncountering missing data is inevitable. Because missing data can be represented innumerous forms across datasets, the first step of converting missing data to a uniformrepresentation for SAS processing is to review the codebook. A sample of items takendirectly from the Add Health codebooks is provided as an Appendix at the end of the paper.In reviewing the information, you can see variables H1ED19 - H1ED24 have eightresponses; 1-5 represent actual responses to the items (strongly agree to stronglydisagree) whereas 6-8 represent different types of missing data (refused, legitimate skip, donot know). After reviewing the codebook, you should estimate frequency tables for eachvariable that will be used in their analyses – this allows you to compare the data to theinformation in the codebook and it provides baseline information that you will usethroughout the data cleaning and management process to check that procedures executecorrectly.Code for generating frequency tables for each of the variables in the reduced dataset isbelow:proc freq data AH.Combined reduced var;tables H1GI1M H1GI1Y BST90P19 imonth iday iyear H1ED19 H1ED20 H1ED21H1ED22 H1ED23 H1ED24 AH PVT; run;Output 3 depicts a frequency table for BST90P19. Af
1 Paper 5142-2020 Moving from Messy Data to a Clean Analytic Dataset: Common Data Management Techniques using SAS R