Transcription
Managing for Results2014 PASBO Annual ConferenceBenchmarking ProjectA Report of the Performance Measurementand Benchmarking Project2012-13 Survey03/05/2014PERFORMANCE MANAGEMENT SYSTEM
Notes:To PASBO Chief Business Officers –We are pleased to present the results of the 2013 PASBO KPI benchmarking demonstrationproject as part of the PASBO Annual Conference March 11-14, 2014.For this project, four Key Performance Indicators (KPIs) were used to demonstrate the valueof statewide performance benchmarking in Pennsylvania. The KPIs are: Custodial WorkloadAverage Age of FleetWorkers’ Compensation Cost Per EmployeeAccounts Payable Cost Per 100k RevenueThe four KPIs are part of the ActPoint KPI Performance Management System, whichincludes a library of more than 500 KPIs developed by the Council of the Great CitySchools and a fully automated online business intelligence system developed by TransACTCommunications, Inc.Designed to improve non-instructional school district operations, the KPIs focus on finance(accounts payable, cash management, compensation, financial management, grantsmanagement, procurement and risk management); business operations (food services,maintenance and facilities, safety and security, and transportation); human resources; andinformation technology.The goal of this demonstration project is to show that Pennsylvania school districts canimprove operational performance by using performance benchmarking to influencestrategic goals based on data. When a district measures its performance and comparesitself to others, it can better identify where it is successful, where it needs to improve,and how to do so strategically.Pennsylvania school systems which are subscribers have come to rely on the ActPoint KPIsystem as an essential strategic management tool. They have found that once they bringdata and performance measurement into the governing and management process it laysthe foundation for a more results-oriented school system.We thank both the Council of the Great City Schools and TransACT Communications, Inc.for allowing us to use the ActPoint KPI system without cost for this demonstration project.For more information on the service, go to www.actpoint.com/pa.Jay Himes, CAE Jim BuckheitPASBO Executive DirectorPASA Executive Officer
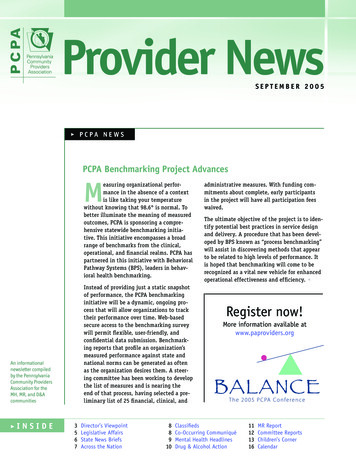
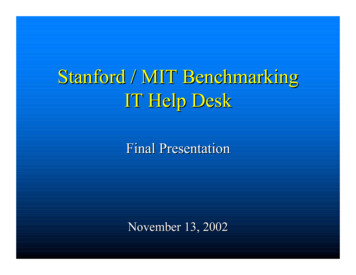
PERFORMANCE MANAGEMENT SYSTEMwww.actpoint.com/PACustodial WorkloadAccounts Payable Cost Per 100k RevenueOperations - Maintenance and OperationsFinance - Accounts PayableDescriptionTotal square footage of non-vacant buildings that are managed by the district, divided bytotal number of district custodial field staff. This measure only applies to district-operatedsites.Factors that influence Assigned duties for custodians Management effectiveness Labor agreements District budgetImportance of MeasureThis is a staffing-level measure. It represents theaverage square footage that each custodianwould be responsible for if all district facilitieswere divided evenly. A lower value couldindicate that custodians may have additionalassigned duties, or that there are opportunitiesfor increased efficiency. A higher value couldindicate a well-managed custodial programor that some housekeeping operations areassigned to other employee classifications.It is important for a district to examine whatdrives the ratio to determine the most effectiveworkload.DescriptionTotal Accounts Payable department personnel costs plus AP department non-personnelcosts, divided by total district operating revenue over 100,000.Factors that influence Administrative policies and procedures Administrative organizational structure Administrative leadership style, decisionmaking process and distribution oforganizational authority Departmental and individual employeeresponsibilities and competencies Performance management systems Monitoring and reporting systems Number of FTEs in the Accounts PayableDepartment The total dollar amount of invoices paidannually Level of Automation Regional salary differentials and differentprocessing approachesImportance of MeasureThis measures the operational efficiency of anAccounts Payable Department.Summary of ResultsSummary of ResultsPANational1st Quartile:51,426 to 25,52392,824 to 28,2452nd Quartile:24,746 to 20,93428,179 to 24,059Median:PANational1st Quartile: 32.03 to 90.16 22.87 to 66.022nd Quartile: 92.34 to 166.28 66.07 to 122.30 167.21 122.6920,58923,9613rd Quartile:20,244 to 18,00223,961 to 18,6113rd Quartile: 168.13 to 235.98 122.69 to 212.224th Quartile:17,689 to 10,84318,526 to 9,7104th Quartile: 249.71 to 746.08 213.82 to 746.08Note:Median:Note:Adjustments for cost of living have been applied to all values based on the ACCRA index.Each bar in this chart represents a district ID number rather than the district name, allowing the district to remain annonymous.Adjustments for cost of living have been applied to all values based on the ACCRA index.Each bar in this chart represents a district ID number rather than the district name, allowing the district to remain annonymous.PERFORMANCE MANAGEMENT SYSTEM 2014 TransACT Communications, Inc.www.actpoint.com/PA 2014 TransACT Communications, Inc.
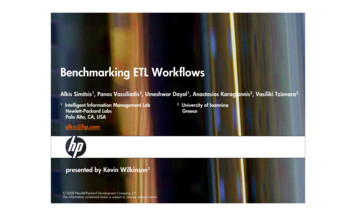
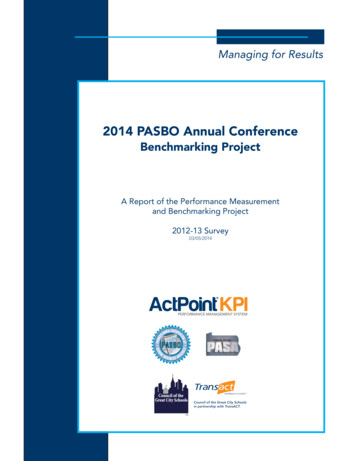
PERFORMANCE MANAGEMENT SYSTEMwww.actpoint.com/PAAverage Age of FleetWorkers’ Compensation Cost Per EmployeeOperations - TransportationFinance - Risk ManagementDescriptionAverage age of bus fleet. This should represent all district-operated buses including spares,but not including decommissioned and/or “mothballed” buses. Average age should becalculated using a weighted average method, e.g., with a fleet of 33 buses, if 20 buses areeach five years old and 13 buses are each six years old, then the weighted average is ((20 x5) (13 x 6)) 33 5.39.Factors that influence Formal district-wide capital replacement budgets and standards Some districts may operate climates that reduce bus longevity Some districts may be required to purchase cleaner burning or expensive alternativefueled buses Availability of state or local bond funding for school bus replacementImportance of MeasureYounger fleets require greater capital expenditures but reduced maintenance costs. Ayounger fleet will also result in greater reliability and service levels. Conversely, an olderfleet requires more maintenance expenditure, even though it reduces capital expenses.DescriptionTotal workers’ compensation premium costs plus workers’ compensation claims costsincurred plus total workers’ compensation claims administration costs for the fiscal year,divided by total number of district of district employees (number of W-2’s issued).Factors that influence Medical management programs Quality of medical care Litigation Timely provision of benefitsImportance of MeasureThis metric can be used to measure success ofprograms and initiatives. It can also be a wayto measure trends over time or to benchmarkagainst other employers.Summary of ResultsSummary of ResultsPANational1st Quartile: 93.12 to 181.39 4.10 to 246.522nd Quartile: 187.14 to 284.76 249.09 to 349.81 287.19 350.81Median:PANational3rd Quartile: 289.61 to 320.32 350.81 to 606.481st Quartile:0.87 to 4.70.87 to 6.64th Quartile: 350.81 to 565.88 607.98 to 1,506.212nd Quartile:5.38 to 6.576.74 to 10.06.610.143rd Quartile:6.6 to 710.14 to 13.084th Quartile:8 to 13.3513.25 to 21.0Median:Note:Note:Adjustments for cost of living have been applied to all values based on the ACCRA index.Each bar in this chart represents a district ID number rather than the district name, allowing the district to remain annonymous.Adjustments for cost of living have been applied to all values based on the ACCRA index.Each bar in this chart represents a district ID number rather than the district name, allowing the district to remain annonymous.PERFORMANCE MANAGEMENT SYSTEM 2014 TransACT Communications, Inc.www.actpoint.com/PA 2014 TransACT Communications, Inc.
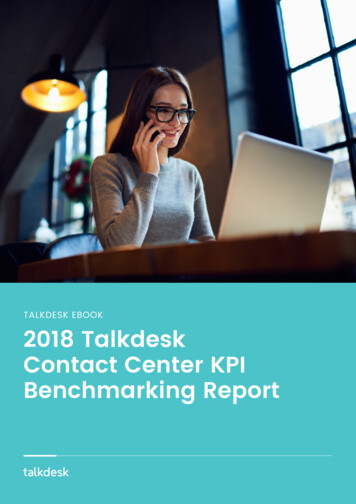
PERFORMANCE MANAGEMENT SYSTEMStarter Packageswww.actpoint.com/PALess than 5,000 EnrollmentKPIs and Performance ManagementTMWhy is it Important?FINANCE - 5 MeasuresThe four key performance indicators (KPIs) highlighted in this report are just the beginningof your journey with KPIs. Use the business intelligence and analytical tools in ActPoint KPI to pinpoint opportunities to improve operational performance in your district. INFORMATION TECHNOLOGY - 3 Measures FinanceOperationsAccounts PayableFood ServicesCash al ManagementSafetyGrants ManagementSecurityProcurementTransportationRisk ManagementInformation TechnologyOPERATIONS - 10 MeasuresFund Balance Ratio (A) UnassignedFund Balance Ratio (B) UncommittedFund Balance Ratio (C) UnrestrictedGrant Funds As Percent Of Total BudgetWorkers’ Compensation Cost Per EmployeeIT Spending Per StudentIT Spending Percent Of District BudgetNetwork - Bandwidth Per Student Food Services: Cost per MealFood Services: Meals Per Labor HourTransportation: Cost Per Mile OperatedM&O: Custodial Work - Cost Per Square FootM&O: Custodial WorkloadM&O: Cost Per StudentM&O: Costs Percent Of District BudgetM&O: Routine Maintenance - Cost Per Square FootM&O: Utility Costs - Cost Per Square FootM&O: Work Order Completion Time (Days)HUMAN RESOURCES - 2 Measures Teacher Retention - Average For 1-5 YearsTeacher Vacancies On First Day of SchoolActPoint KPIOPERATIONS - 19 MeasuresTM: 50FINANCE - 20 MeasuresAccounts Payable AP Cost Per 100K Revenue AP Cost Per InvoiceHuman ResourcesCash Management Cash Flow - Short-Term Loans Per 100K Revenue Investment Earnings Per 100K RevenueCompensationMEASURE - COMPARE - MANAGEWhen a district measures its performance and compares itself to others, it can betteridentify where it is successful, where it needs to improve, and how to do so strategically.Use the ActPoint KPI “Data Modeling” tool to predict how strategic changes will affectbenchmarking results. Payroll Cost Per Pay CheckFinancial Management Debt Servicing Costs Ratio To District RevenueExpenditures Efficiency - Final Budget As Percent Of ActualFund Balance Ratio (A) UnassignedFund Balance Ratio (B) UncommittedFund Balance Ratio (C) UnrestrictedRevenues Efficiency - Final Budget As Percent Of ActualGrants ManagementEVIDENCE-BASED DECISION MAKINGPerformance management is an ongoing, systematic approach to improve resultsthrough evidence-based decision making, continuous organizational learning, and afocus on accountability for performance. Apply objective, outcome-based information tomanagement and policy making in order to improve results. Grant Funds As Percent Of Total Budget Grant-Funded Staff As Percent Of District FTEsProcurement Competitive Procurements RatioProcurement Cost Per 100K SpendProcurement Cost Per Purchase OrderProcurement Savings RatioStrategic Sourcing RatioFood Services Breakfast Participation Rate (Districtwide)Cost Per MealFood Cost Per MealFund Balance As Percent Of RevenueLunch Participation Rate (Districtwide)Supper Participation Rate (Districtwide)Total Costs As Percent Of RevenueMaintenance & Operations Custodial Work - Cost Per Square FootCustodial WorkloadMajor Maintenance - Cost Per StudentRenovations - Cost Per StudentRoutine Maintenance - Cost Per Square FootSafety & Security Incidents - People Incidents Per 1,000 StudentsS&S Expenditures Per 1,000 StudentsS&S Expenditures Percent Of District BudgetS&S Staff Per 1,000 StudentsTransportation Bus Fleet - Average Age Of Fleet Cost Per Mile Operated Cost Per RiderHUMAN RESOURCES - 4 Measures Substitute Placement RateTeacher Absences Per TeacherTeacher Retention - Average For 1-5 YearsTeacher Vacancies On First Day of SchoolRisk Management Cost Of Risk per Student Workers’ Compensation Cost Per EmployeeStarter PackagesINFORMATION TECHNOLOGY - 7 MeasuresOrder online at: www.actpoint.com/PADevices - Average Age Of ComputersDevices - Computers Per EmployeeDevices Per StudentIT Spending Per StudentIT Spending Percent Of District BudgetIT Spending Per District FTENetwork - Bandwidth Per StudentStarter PackageRecommendationsEnrollment1 - 5,0005,001-20,00020,001 PackageStandard (20) OR (50)Plus (100)PRO (500 )PERFORMANCE MANAGEMENT SYSTEM 2014 TransACT Communications, Inc.www.actpoint.com/PA 2014 TransACT Communications, Inc.
Intermediate PackageActPoint KPIPlus: 1005,000-20,000 EnrollmentPERFORMANCE MANAGEMENT SYSTEMwww.actpoint.com/PATMAnnual License Fees100 Strategic and Managerial Key Performance IndicatorsFINANCE - 39 Measures AP Cost Per 100K RevenueAP Cost Per InvoiceCash Flow - Months Above Liquidity BaselineCash Flow - Short-Term Loans Per 100K RevenueCompetitive Grant Funds As Percent Of TotalCompetitive Procurements RatioCooperative Purchasing RatioCost Of Risk per StudentDebt Principal Ratio To District RevenueDebt Servicing Costs Ratio To District RevenueExpenditures Efficiency - Adopted Budget As PercentOf ActualExpenditures Efficiency - Final Budget As Percent OfActualFund Balance Ratio (A) UnassignedFund Balance Ratio (B) UncommittedFund Balance Ratio (C) UnrestrictedGrant Funds As Percent Of Total BudgetGrant-Funded Staff As Percent Of District FTEsInvestment Earnings Per 100K RevenueInvoices - Days To ProcessInvoices Processed Per FTE per MonthP-Card Purchasing RatioPALT For Informal SolicitationsPALT For Invitations for BidsPALT For Requests for ProposalsPay Checks Processed Per FTE per MonthPayroll Cost Per 100K SpendPayroll Cost Per Pay CheckProcurement Cost Per 100K SpendProcurement Cost Per Purchase OrderProcurement Savings RatioReturned Grant Funds Per 100K Grant RevenueRevenues Efficiency - Adopted Budget As Percent OfActualRevenues Efficiency - Final Budget As Percent OfActualStrategic Sourcing RatioWarehouse Operating Expense RatioWarehouse Stock Turn RatioWorkers’ Compensation Cost Per 100K PayrollSpendWorkers’ Compensation Cost Per EmployeeWorkers’ Compensation Lost Work Days Per 1,000EmployeesHUMAN RESOURCES - 10 Measures Substitute Placement RateTeacher Absences Per TeacherTeacher Retention - Average For 1-5 YearsTeacher Vacancies On First Day of SchoolTime To Fill Vacancies - Instructional SupportTime To Fill Vacancies - Non-School ExemptTime To Fill Vacancies - Non-School Non-ExemptTime To Fill Vacancies - School-Based ExemptTime To Fill Vacancies - School-Based Non-ExemptTime To Fill Vacancies - TeachersActPoint KPI20ActPoint KPIStandard 50ActPoint KPIPlus 100ActPoint KPIPRO 500 20 KPI’s50 KPI’s100 KPI’s500 KPI’s 750 1,250 1,975 3,500501-1,000 1,000 1,675 2,650 4,2501,001-2,500 1,500 2,550 4,000 5,8502,501-5,000 2,000 3,550 5,700 8,2505,001-10,000 2,500 3,950 6,700 9,55010,001-20,000 4,900 7,900 11,85020,001 5,400 8,750 13,750OPERATIONS - 37 Measures Accidents - Miles Between AccidentsAccidents - Miles Between Preventable AccidentsBreakfast Participation Rate (Districtwide)Bus Equipment - GPS TrackingBus Fleet - Alternatively-Fueled BusesBus Fleet - Average Age Of FleetBus Fleet - Daily Buses As Percent Of Total BusesBus Fleet In Service DailyBus Usage - Daily Runs Per BusCost Per BusCost Per MealCost Per Mile OperatedCost Per RiderCustodial Work - Cost Per Square FootCustodial WorkloadFood Cost Per MealFood Cost Per RevenueFund Balance As Percent Of RevenueIncidents - Assault/Battery Incidents Per 1,000StudentsIncidents - People Incidents Per 1,000 StudentsLabor Costs Per RevenueLunch Participation Rate (Districtwide)M&O Cost Per StudentM&O Costs Percent Of District BudgetMajor Maintenance - Cost Per StudentMeals Per Labor HourOn-Time PerformancePersonnel - Buses per MechanicRenovations - Cost Per StudentRoutine Maintenance - Cost Per Square FootS&S Expenditures Per 1,000 StudentsS&S Expenditures Percent Of District BudgetS&S Staff Per 1,000 StudentsSupper Participation Rate (Districtwide)Total Costs As Percent Of RevenueUtility Costs - Cost Per Square FootWork Order Completion Time (Days)INFORMATION TECHNOLOGY - 14 Measures Enrollment1 - 500Recommended subscription based on enrollment level highlighted in yellow.To order online, go to www.actpoint.com/PAWhich one is right for my district?ActPoint KPI 20 includes 20 strategic key performanceindicators (KPIs). This “starter package” is best suited fordistricts with enrollment less than 5,000 students. Access thecatalog of KPIs for the 20 version at: www.actpoint.com/2050Devices - Advanced Presentation Devices Per TeacherDevices - Average Age Of ComputersDevices - Computers Per EmployeeDevices Per StudentIT Spending Per StudentIT Spending Percent Of District BudgetIT Spending Per District FTENetwork - Bandwidth Per StudentNetwork - Bandwidth Per UserSupport - Break/Fix Staffing Cost Per TicketSupport - First Contact Resolution RateSupport - Help Desk Call Abandonment RateSupport - Help Desk Staffing Cost Per TicketSupport - Mean Time To Resolve TicketsOrder online at: www.actpoint.com/PAActPoint KPI Standard includes 50 strategic key performanceindicators (KPIs), which is best suited for districts withenrollment less than 5,000 students. Access the catalog of KPIsfor the PRO version at: www.actpoint.com/standard50ActPoint KPI PRO includes 100 key performance indicators(KPIs), which is best suited for districts with enrollment between5,000-20,000 students. Access the catalog of KPIs for the PROversion at: www.actpoint.com/plus100500 ActPoint KPI PRO includes more than 500 key performanceindicators (KPIs), which is best suited for districts withenrollment more than 20,000 students. Access the catalog ofKPIs for the PRO version at: www.actpoint.com/pro500PERFORMANCE MANAGEMENT SYSTEM 2014 TransACT Communications, Inc.www.actpoint.com/PA 2014 TransACT Communications, Inc.
Contact InformationPASBOJay Himes, CAEExecutive Director717-540-9551jhimes@pasbo.orgPASAJim BuckheitExecutive /ActPoint KPIPhillip SmithActPoint KPI Brand Manager425-977-2120phillip@transact.comPERFORMANCE MANAGEMENT SYSTEMTo register for a webinar or buy online, go to:www.actpoint.com/PA- or call: 425-977-2120email: phillip@transact.com03/05/2014 2014 TransACT Communications, Inc.ActPoint is a registered trademark of TransACT Communications, Inc.All Rights Reserved.
Total Accounts Payable department personnel costs plus AP department non-personnel costs, divided by total district operating revenue over 100,000. Accounts Payable Cost Per 100k Revenue Finance - Accounts Payable Summary of Results PA National 1st Quartile: 32.03 to 90.16 22.87 to