Transcription
EUV IMAGING SPECTROMETERHinodeEIS SOFTWARE NOTE No. 12Version 15 February 2010STRAY LIGHTIgnacio UgarteNaval Research Laboratory4555 Overlook Ave SWWashington, DC 20004U.S.A.iugarte@ssd5.nrl.navy.mil
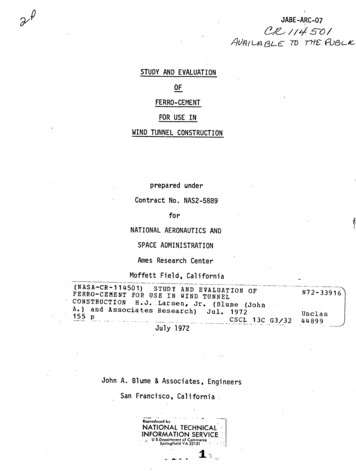
1IntroductionStray light is the part of the radiation that impinges the detector following paths that were notoriginally intended in the optical system. The source can be light scattered by external or internalagents, including dust, imperfections in the optical system, scattering from supporting structures,etc.In this EIS note, we present a brief analysis of observations during a solar eclipse to show theeffects that stray light can have in the observations. The purpose of this note is to make the EISusers aware of this potential contamination effect. As of this version, no correction is provided.2Sample dataset: solar eclipseTo measure the stray light component we need to separate it from the direct component. Duringan eclipse, with no direct light aimed at the detector, any measurement on the EIS detector willbe due to the stray contribution.Figure 1: Eclipse on 2010 January 15 when stray light observations were taken. In red the EISfield of view.We investigated the EIS measurements on the detector during the eclipse that took place on2010 January 15 (Fig. 1). An specific sequence was run for this purpose (Table 1). It consisted of aset of sit-and-stare 40′′ slit images in three spectral windows (Ca xvii 192.82 Å, Fe xii 195.12 Å andHe ii 256.32 Å) framed by two dark current measurements (REGCAL015), one before and one after.During the dark current measurements the shutter remains closed and therefore no light (strayor direct) should reach the detector. The counts (data numbers, DN) measured with the shutterclosed are used as the reference to estimate the stray light component when it is open. We shouldstate that we have used only the dark current exposures with the same integration time (10s) asthe observations.1
Table 1: Eclipse’s observing 2.fits044212.fits044512.fitsStudy AcronymREGCAL015TEST STUDYTEST STUDYTEST STUDYTEST STUDYTEST STUDYTEST STUDYTEST STUDYREGCAL015Description8 dark exposures, full CCD (exposure times: 0”][wH:512,nWins:3][ExpT(Delay):10.00(0)]8 dark exposures, full CCD (exposure times: 1,1,10,10,30,30,60,60s)Figure 2: Eclipse sequence as seen in Fe xii 195.12 Å. Top: signal in counts. Bottom: residuals from subtractingthe dark current. When comparing to Fig. 1, note that images on the detector are flipped in the E–W direction.2
Figure 3: Larger panels: intensity cross-sections along the slit for position 30 in Solar X at three different timesduring the eclipse. In red and green dark current measurements before and after the sequence. Dotted lines indicatethe distance traveled by the Moon during the exposure. The residuals from subtracting the dark current are shownin the smaller panels3
Figure 4: Histograms of residuals from subtracting the two dark current files to exposure 04:36:48 UT (time step33). The dotted lines indicate the center of the Gaussian fit given also in the legend with the standard deviationerror from the Gaussian width.The top panels in Fig. 2 show a subset of the frames in the eclipse sequence, as seen in Fe xii195.12 Å. The dark current counts level for this section of the detector is around 500 counts. If wesubtract the dark current (04:45 UT file), we obtain the residuals shown in the bottom row, wherewe have saturated anything above 60 DN. That brings out the signal in the part of the detectorthat has been occulted by the Moon. Signal there is not due to direct light coming from the Sun,but from light following a stray path. The black dots sprinkled over the field of view are warm andhot pixels.One obvious thing to note is that there is no sharp transition between the exposed part of thedetector and the occulted one. Two are the contributions to this effect: the Moon’s displacementaccross the field of view and stray light. The Moon is moving while the exposure is being taken(10s) and this results in a gradual occultation of the disk and therefore a gradient in intensity. Wehave estimated the displacement of the Moon’s leading edge in 6.84 pixels/s and in 3.59 pixels/sfor the trailing one (see the Appendix). The exposures are 10s and therefore the intensity of asmany as 68 and 36 pixels along the slit suffers attenuation due to the Moon movement.Fig. 3 shows this in more detail. The intensity along the slit for one Solar X (green dashedline in Fig. 2) at three different times is displayed as a black solid line: Moon’s leading edge inthe field of view; full occultation; and trailing edge in the field of view. The red and green linesare dark current counts before and after the occultation respectively. The spikes come from warmand hot pixels and have not been removed to show that we are really looking at the same partof the detector in all three curves. Below each intensity panel, we show a smaller panel with theresiduals from subtracting the dark current measurements at each pixel. The dotted lines indicatethe separation in pixels between the spatial start of the intensity decay and the end of the estimateddistance covered by the Moon’s edge at the velocities described earlier. The intensity decay showstwo clearly defined slopes: a steep decrease that coincides with the passage of the Moon while thedetector is being exposed and a slower decay from there onwards. The pixels in the latter part of4
the detector are, according to this, already fully occulted by the Moon. Therefore the excess ofcounts has to come from stray light that shouldn’t be there.An exponential fit A0 exp x/A1 A2 to the gentle slope in the bottom panel (04:38 UT), avoidingspikes, gives an amplitude of A0 25 counts, A1 78 pixels and A2 507 DN. A0 and A1 canchange for different profiles. They are representative, but are not sufficiently accurate to derive auniversally valid correction curve as function of distance to the source. This dataset due to theMoon’s rapid displacement is probably not optimal to estimate that sort of correction.We can, however, estimate the minimum stray light level above the dark current. Fig. 4 showsthe histograms of the residuals from subtracting the two dark current exposures to a exposure fullyeclipsed (04:36:48 UT, time step 33). It reveals an excess of 5–6 DN over the dark current levels.As no significant differences can be found between the two histograms produced using the two darkcurrent files set at the beginning and end of the observational sequence, 20 minutes apart, we canrule out the time variability of the dark current as responsible for that excess. We can thereforesafely conclude that a minimum of 5–6 counts should be expected from stray light in Fe xii 195.12Å. This is when half of the solar disk is eclipsed by the Moon. That is around 2% of the typicalcounts for that line in the field of view.A similar analysis was done with He ii 256.32 Å and the blended Ca xvii 192.82 Å. The Gaussianfits to the histograms return: -1.2 3.6 DN and 0.8 3.7 DN in the first case, and 2.1 3.9 DN and2.7 3.9 DN in the second. These numbers are also at the 2% level of the typical counts in eachspectral window.Figure 5: Left panels: running differences from the same frames as shown in Fig 2. Right panel:average J-map of the sequence. J-map represents height versus time. Velocities from the linear fitto the valleys and peaks at each time step are given color coded.AMoon’s occultation speedThe velocity of the Moon’s edges crossing the EIS field of view was estimated using running difference images. Fig. 5 shows the running differences for the same frames as Fig. 2. Then a J-map5
was constructed by averaging the intensity along the slit for each frame (time step) and stickingthem together in sequence (right panel of Fig. 5). The two inclined ridges represent the edges ofthe Moon crossing the field of view from bottom to top. A linear fit to the central point of theridges at each time step provides us with the velocity. The values we obtain are 6.86 pixels/s forthe leading edge and 3.59 pixels/s for the trailing one.6
2 Sample dataset: solar eclipse To measure the stray light component we need to separate it from the direct component. During an eclipse, with no direct light aimed at the detector, any measurement on the EIS detector will be due to the stray contribution. Figure 1: Eclipse on 2010 January 15
![The GIANO-TNG spectrometer [6269-46]](/img/1/spie-6269-46.jpg)