Transcription
ITALIAN JOURNAL OF PURE AND APPLIED MATHEMATICS – N. 43–2020 (590–602)590Analysis and implementation of kidney stones detection byapplying segmentation techniques on computerized tomographyscansMua’ad M Abu-Faraj Faculty of Information Technology and SystemsThe University of JordanAqabaJordanm.abufaraj@ju.edu.joMohammad ZubiFaculty of BusinessAl-Balqa Applied bstract. Kidney stone disease is one of the risks for life throughout the world andmajority of people with stone formation in kidney at the initial stage do not notice it asdisease and it damages the organ slowly. Current estimation is that there are 30 millionpeople suffering by this disease. There are different imaging techniques for diagnosingkidney diseases, such as CT images, X-rays, and Ultrasound imaging. In this studywe explored the deployment of three segmentation techniques using matlab to examinethe kidney area, and to enhance kidney stone detection. The segmentation techniquesunder investigation are: threshold based segmentation, watershed based segmentation,and edge based segmentation.Keywords: image processing, segmentation, computerized tomography, kidney stones.1. IntroductionThere are various imaging techniques that can be used in the medical practice such as computed tomography (CT) scan, X-rays, and magnetic resonanceimaging (MRI). CT scans are one of the most widely available imaging techniques. These techniques are used for diagnosis and follow-up of different kidneyabnormalities. These abnormalities comprise stone disease, kidney cysts, hydronephrosis (blockage of urine), congenital anomalies, as well as urinary tracttumors. Moreover, successful management and surgical treatment of such conditions depends largely on accurate identification of such anatomical details. Thedetection of kidney stones using ultrasound imaging is a highly challenging taskand is largely operator dependent as they are of low contrast and contain speckle . Corresponding author
ANALYSIS AND IMPLEMENTATION OF KIDNEY STONES DETECTION .591noise. This challenge is overcome by employing other imaging techniques. Infact, non-contrast enhanced CT scan of the urinary tract is considered the goldstandard of stone disease (Petrik, et al., 2016). The performance of CT scanis not only superior to all other imaging modalities but also provides variousvital information that play a crucial role in patient counseling in treatment decision such as stone density, structure of the stone and skin-to-stone distance(Viswanath and Gunasundari, 2015).The images obtained by X-ray or CT in adverse conditions may be contaminated with noise that can affect the detection of diseases, abnormality orcancerous cells. A large number of image processing techniques (filters) havebeen proposed to remove noise. These techniques depend on the type of noisepresent in the image (Sanchez et al., 2012).The operation of producing the estimated clean, original images out fromnoisy/corrupt images is called image restoration. There are many forms ofcorruption on images, such as: motion blur, camera noise, and camera misfocus(Banham and Katsaggelos, 1996). The goal of restorative image investigation isto procure helpful data about the body organs and the medical courses of actionneeded. This can be done by utilizing outer and inside wellsprings of vitality,kidney image analysis performed using CT scans. CT scans are preferred methodto take images of the kidney because of its straightforwardness, convenience andcost viability (Ebrahimi and Mariano, 2015).An important source of information for kidney imaging is the presence anddistribution of micro calcifications in the kidney, this anatomical information canbe obtained with high resolution technology using CT scans, As yet there is nocomprehensive imaging modality for all CT scan applications and needs, despitethe fact that the capacity to mechanize and examine restorative pictures givesa capable intends to help doctors; subsequently computer projects, handlingtechniques that get the information and data from medicinal imaging scannersmust be painstakingly created to save and improve the most imperative clinicaldata as opposed to presenting extra curios. The ability to improve diagnosticinformation from medical images can be further enhanced by designing computerprocessing algorithms, application and software intelligently, that is why weproposed an application based on matlab software to clarified boundaries forstones in kidney (Ebrahimi and Mariano, 2015).The compelling question is: why do physicians treat kidney stones? First ofall, this disease is usually a painful condition where pain medication is a temporary measure and a definitive measure should be undertaken i.e stone removal.Moreover, pain medications are not effective to alleviate pain. Interesting, results from historical landmark observational studies (Blandy and Singh, 1976).In 1970s reported a 10-year mortality rate of up to 30% in patients with largekidney stone (staghorn stone) who were treated conservatively (without surgical removal). Additionally, one quarter of these patients suffer from severeurinary tract infections that have significant impact on kidney function. (Rousand Turner, 1977). In this paper we aim to provide physicians with accurate
592MUA’AD M ABU-FARAJ and MOHAMMAD ZUBIresults related to the existence of kidney stones on the CT images, using efficientsegmentation techniques.2. Literature reviewX-rays and Ultrasound imaging are considered low cost imaging techniques.While CT are considered high cost technique. The researchers in (Vasanthselvakumar, et al., 2017) has focused their studies on applying image processingtechniques on Ultrasonic images, they have applied an automatic detection andclassification of various diseases such as stone, cyst and cancer masses presentin the pelvic region of the kidney.While other researchers have focused on analyzing the images resulted byusing MRI systems (Youngwoo, et al., 2016), and (Hamed and Fei, 2013). Theauthors in (Youngwoo, et al., 2016), have developed an automated method forsegmentation and a method to provide the measurements of kidneys from magnetic resonance images in patients with autosomal dominant polycystic kidneydisease, the authors also assessed the performance of the automated methodwith the reference manual segmentation method. In (Hamed and Fei, 2013),the authors have provided an automatic segmentation of the kidney in 3D MRimages, by extracting texture features and statistical matching of geometricalshape of the kidney. The researchers in (Altintas, et al., 2010) have used xray images to detect kidney stones. The authors in (Tulin and Das, 2017) and(Natarajan, et al., 2013) have applied image processing techniques on CT scanimages.Image segmentation is the process of partitioning a digital image into multiple segments. The goal of segmentation is to simplify or change the representation of an image into something that is more meaningful and easier to analyze.Several image segmentation techniques have been developed by the researchersin order to make images smooth and easy to evaluate. In (Tulin and Das, 2017),the authors aim to remove the Gaussian noise from the abdominal CT scanimages and segment the kidney region from this abdominal area to make a sizemeasurement and to characterize the difference between healthy and diseasedkidney. In (Natarajan, et al., 2013), the authors have developed an approachfor extracting kidney in abdominal CT scan images. The images have beendivided into two stages. In the first stage a template evaluation method hasbeen developed for extracting the desired region in an image on the basis ofproperties of an organ, which helps in processing to a confined region and isan automated process. The second stage uses the concept of intensity values ofa pixel and separates the desired region from the original image on the basisof a computed threshold range. In addition to this, the authors have used aset of morphological operations for fine coarse kidney segmentation and variousfilters for removing noise from an image. In (Ebrahimi and Mariano, 2015), theauthors have provided a development of a semi-automated program that usedimage processing techniques and geometry principles to define the boundary,
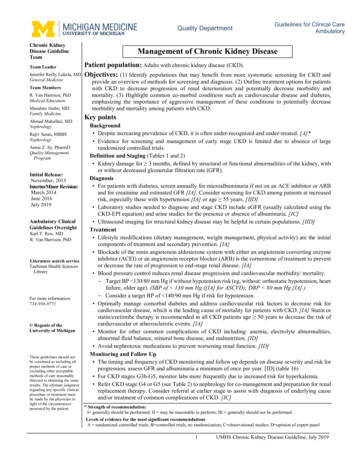
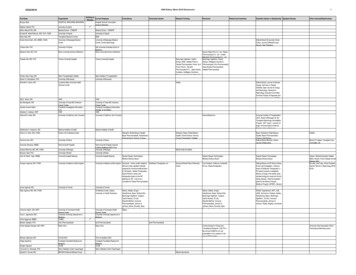
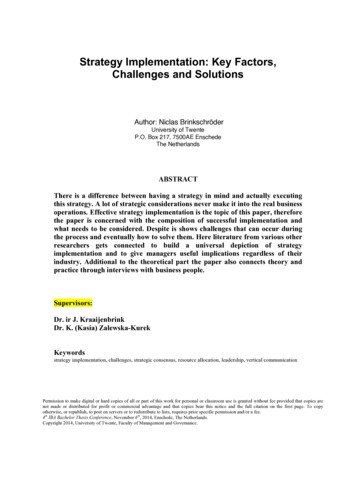
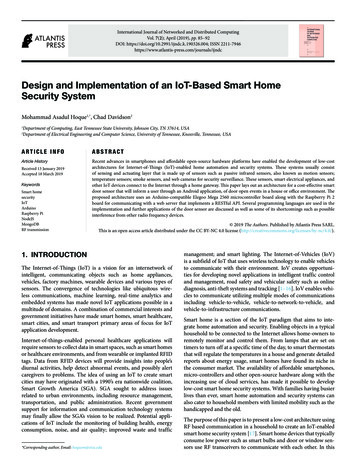
ANALYSIS AND IMPLEMENTATION OF KIDNEY STONES DETECTION .593and segmentation of the kidney area, and to enhance kidney stone detection. Itmarked detected kidney stones and provided an output that identifies the sizeand location of the kidney based on pixel count. The program was tested onstandard Kidney Urine Belly (KUB) CT scan slides. The KUB CT scan slideswho were divided into two groups based on the presence and absence of kidneystones in their hospital records.3. Data and methodologyFigure 1: The Original ImageMatlab is a high-performance language for education and research as it integrates computation, visualization and programming in an easy-to-use environment where problems and solutions are expressed in familiar mathematicalnotation and also it has toolboxes for signal processing, neural network, imageprocessing, database etc. Matlab software was used to implement the algorithm,since Matlab Image Processing Toolbox is a collection of functions that extendthe capability of the Matlab numeric-computing environment. The toolbox supports a wide range of image processing operations, such as Image analysis andenhancement. Region of interest operations, linear filtering and filter design(Beucher, et al., 1990). All the functions and equations used in this study arefrom Matlab image processing toolbox.The CT scan images are taken from (Kidney Stones, 2018), the original image was segmented by threshold, edge-based segmentation, and watershed segmentation, the original image is shown in Fig.1. There are many segmentationtechniques as shown in Fig.3. In this paper we have applied three segmentation techniques on the gray scale image after applied Gaussian filter twice on
594MUA’AD M ABU-FARAJ and MOHAMMAD ZUBIFigure 2: Gray Scale Imageoriginal image shown in Fig.2. These segmentation techniques are Edge basedsegmentation, Watershed segmentation, and Threshold based segmentation.Figure 3: Image Segmentation Techniques3.1 Edge based segmentationAll images produced in this paper were processed using matlab software. Asshown in Fig.4 illustrate steps edge based segmentation method started by reading image, then detecting the entire cell, two cells are presented in this image,but only one cell can be seen in its entirety, this cell will be detected. Anotherword for object detection is segmentation. The object to be segmented differsgreatly in contrast from the background image. Changes in contrast can bedetected by operators that calculate the gradient of an image. The gradientimage can be calculated and a threshold can be applied to create a binary maskcontaining the segmented cell. First, we use edge and the Sobel operator tocalculate the threshold value. We then tune the threshold value and use edge
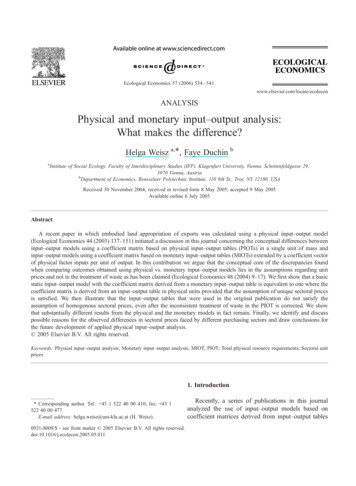
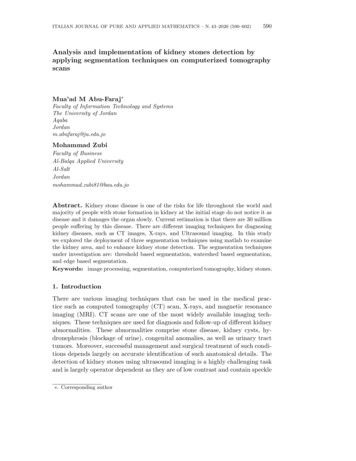
ANALYSIS AND IMPLEMENTATION OF KIDNEY STONES DETECTION .595again to obtain a binary mask that contains the segmented cell. The next stepis to dilate the image. The binary gradient mask shows lines of high contrast inthe image. These lines do not quite delineate the outline of the object of interest. Compared to the original image, you can see gaps in the lines surroundingthe object in the gradient mask. These linear gaps will disappear if the Sobelimage is dilated using linear structuring elements, which we can create with thestrel function. The binary gradient mask is dilated using the vertical structuringelement followed by the horizontal structuring element. The imdilate functiondilates the image. Filling the interior gaps is the next step. The dilated gradientmask shows the outline of the cell quite nicely, but there are still holes in theinterior of the cell. To fill these holes, we use the imfill function. Then theconnected objects in border should be removed. The cell of interest has beensuccessfully segmented, but it is not the only object that has been found. Anyobjects that are connected to the border of the image can be removed using theimclearborder function. The connectivity in the imclearborder function was setto 4 to remove diagonal connections. The next step is smoothening the object.Finally, in order to make the segmented object look natural, we smoothen theobject by eroding the image twice with a diamond structuring element. Wecreate the diamond structuring element using the strel function. An alternatemethod for displaying the segmented object would be to place an outline aroundthe segmented cell. The outline is created by the bwperim function.Figure 4: Edge Based Segmentation
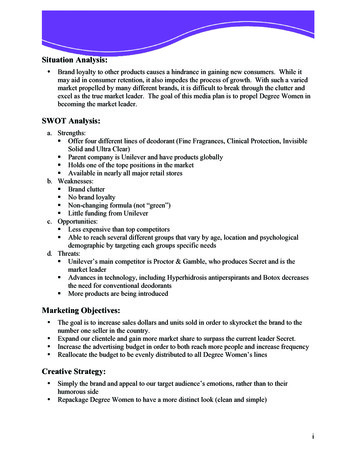
596MUA’AD M ABU-FARAJ and MOHAMMAD ZUBI3.2 Watershed based segmentationThere are many category watershed segmentation techniques. In this paper;marker controlled watershed segmentation has been applied sequential steps onthe original 3D image as Illustrate in Fig.5 Watershed segmentation has beenused to separate touching objects in an image. The watershed transform finds”catchment basins” and ”watershed ridge lines” in an image by treating it as asurface where light pixels are high and dark pixels are low. Segmentation usingthe watershed transform works better if you can identify, or ”mark,” foregroundobjects and background locations. Marker-controlled watershed segmentationfollows the following procedure: compute a segmentation function; where theimage whose dark regions are the objects you are trying to segment. The nextstep is to compute foreground markers, there are connected blobs of pixels withineach of the objects. Then we should compute background markers to remove thepixels that are not part of any object. Applying the segmentation function sothat it only has minima at the foreground and background marker locations. Thelast step is to compute the watershed transform of the modified segmentationfunction.Figure 5: Marker Controlled Watershed Segmentation3.3 Threshold based segmentationThresholding is the simplest method of image segmentation. From a gray scaleimage, thresholding can be used to create binary images. Binary images areproduced from color images by segmentation. Segmentation is the process ofassigning each pixel in the source image to two or more classes. If there are
ANALYSIS AND IMPLEMENTATION OF KIDNEY STONES DETECTION .597more than two classes, then the usual result is several binary images. In imageprocessing, thresholding is used to split an image into smaller segments, orjunks, using at least one color or gray scale value to define their boundary. Theadvantage of obtaining first a binary image is that it reduces the complexity ofthe data and simplifies the process of recognition and classification. The mostcommon way to convert a gray level image to a binary image is to select a singlethreshold value. The input to a thresholding operation is typically a gray scaleor color image. In the simplest implementation, the output is a binary imagerepresenting the segmentation. Black pixels correspond to background and whitepixels correspond to foreground (or vice versa). This method of segmentationapplies a single fixed criterion to all pixels in the image simultaneously. Thereare three types of thresholding algorithms. Global thresholding Local thresholding Adaptive thresholding4. The resultsIn many cases kidney CT scan images cannot give enough information to thephysicians; these information includes: the size, position of stones and otherissues. In this paper, the experiments focused on detecting and clarifying stonesin CT scan images using three methods. The first step is applying enhancementon image as we mentioned before by using double Gaussian filter, and convert theoriginal image to gray scale; this approach is used in edge base segmentation andthresholding segmentation. Segmentation methods are based on gray intensityon image while all medical images are gray scale.4.1 Edge based segmentationIn edge-base segmentation technique; a connected pixel that is found on theboundary of the region is called an edge, so these pixels on the edge are knownas edge points. Edge can be calculated by finding the derivative of an imagefunction. Some edges are very easy to find. These are: Ramp edge, Step edge,Roof edge, Spike edge. Step edge is an abrupt change in intensity level. Rampedges a gradual change in intensity. Spike edges a quick change in intensityand after that returns immediately to an original intensity. Roof edge is notinstantaneous over a short distance. Edge based image segmentation methodfalls under structural techniques. As show in in the figures below, the result fromDilated Gradient Image and Binary Gradient Image is better than thresholdingimage. Kidney stone is cleared and surrounded by edge, edge-base segmentationis also fit for two dimension images.
598MUA’AD M ABU-FARAJ and MOHAMMAD ZUBIFigure 6: Dilated Gradient ImageFigure 7: Binary Gradient Image4.2 Marker-controlled watershed segmentationFigure 8: Superimposed ImageFigure 9: Gradient Magnitude ImageIn watershed Segmentation technique after applying the double Gaussianfilter of the three dimension image (topography surface) and then start fillingimages by water, this is done to create Dam. This technique give us notificationsabout topography of images (high and low places), this technique will coloredsegments with different color, its helpful for physician to detect and allocatestones in kidney as show in Figure 13.4.3 Threshold segmentationIn threshold based segmentation: images will change pixels color that conveyvalue of intensity to 1or 0 based in thresholding variable T, as given in the equation 1. As seen in Fig. 15, the result after applying thresholding segmentation
ANALYSIS AND IMPLEMENTATION OF KIDNEY STONES DETECTION .599Figure 10: MarkersandObject Figure 11: Modified Regional MaximaBoundaries SuperimposedSuperimposed on Originalon Original ImageImageFigure 12: Gradient Magnitude ImageFigure 13: Colored Watershed MatrixImagetechnique on gray scale filter. Fig. 15 displays stones in kidney but its notclear when its compared with other techniques. Thresholding is segmentationtechnique suitable for two-dimension images.(1)(1,q(x, y) 0,if p(x, y) Tif p(x, y) T.
600MUA’AD M ABU-FARAJ and MOHAMMAD ZUBIFigure 14: Gray Scale ImageFigure 15: ThresholdImageSegmentation5. Conclusions and future workIn this work we investigated the application of different segmentation techniquesin detecting kidney stones. The segmentation techniques under investigationare: edge based segmentation, watershed based segmentation and thresholdbased segmentation. Furthermore, depending on our experiments, we nominatewatershed algorithms for detecting kidney stones. Future work may focus onapplying other segmentation techniques to detect kidney stones, and improvingthe quality and efficiency of a reasonable analysis algorithm. Another interestingwork is to expand the analysis region to apply different segmentation techniquesto be used for diagnosis and follow-up of different kidney abnormalities. Theseabnormalities comprise stone disease, kidney cysts, hydronephrosis (blockage ofurine), congenital anomalies, as well as urinary tract tumors.References[1] A. Altintas, C. Unsalan, A. Keskin, F. Yencilek, Detection of kidney stonesfrom X-ray images, 15th National Biomedical Engineering Meeting, 2010,320-328.[2] M.R. Banham, A.K. Katsaggelos, Spatially Adaptive Wavelet-Based Multiscale Image Restoration, IEEE Trans. Image Processing, 5 (1996), 619-634.[3] S. Beucher, et al., Road segmentation by watershed algorithms, Proceedingsof the Pro-art vision group Prometheus workshop, 1990, 212-246.[4] J.P. Blandy, M. Singh, The case for a more aggressive approach to staghornstones, Journal of Urolology, 115 (1976), 505506.
ANALYSIS AND IMPLEM
Al-Balqa Applied University Al-Salt Jordan mohammad.zubi81@bau.edu.jo Abstract. Kidney stone disease is one of the risks for life throughout the world and majority of people with stone formation in kidney at the initial stage do not notice it as disease and it damages the orga