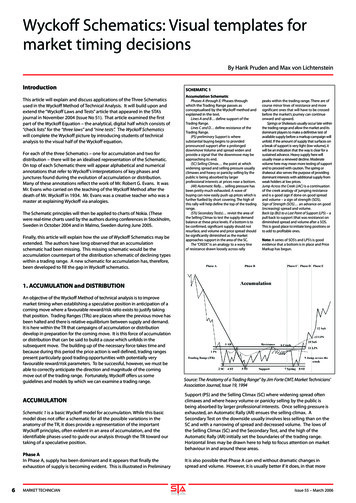
Transcription
Wyckoff Stock Market InstituteP.O. Box 4130Clifton Park, NY 12065www.wyckoffstockmarketinstitute.comAnalyzing Trends using the Wycloff MethodWyckoff tells us that the most important thing that anyone can know about the market or anindividual issue is its trend. The trend is most simply defined as being the line of least resistance.Prices will tend to follow the line of least resistance until there is a significant development inthe action that suggests that a change in trend should be anticipated. A trader can look at theprice of a market or issue and compare it to the price from the previous day, week, month or yearand determine the direction in which it is trending. While this can be helpful in keeping a traderon the right side of the action, Wyckoff had something more specific in mind for determining thetrend. He provided guide lines as to the proper way to define a trend so that it could be morehelpful in applying the five steps of the Wyckoff Method.Trends can be defined in three directions and in at least three time frames. There are up trends,down trends and horizontal trends normally referred to as trading ranges. Trends can be shortterm in nature, intermediate term or long term. The time frames that one Wyckoff trader uses todefine the three durations of trends may be different than another Wyckoff trader uses. This doesnot necessarily mean that one trader is correctly defining the trends and the other is incorrectlydefining them. The important point is that the trends that are defined by consistent with the timeframe of the market operation that is being undertaken. A short term trader may define the shortterm trend as being one that is defined and completed in just a few days. This trader may viewintermediate term trends as being those that are defined and completed over several weeks andhe may look at long term trends as those that last no more than a couple months. Theintermediate term or longer term trader may see the short term traders idea of a long term trendas being his short term trend. These traders may look at intermediate trends as lasting for severalmonths and long term trends as lasting a year and more. These traders cannot be faulted for thedifferent time frames they use to define trends of different durations. A problem only develops ifa trader defines trends in one time frame, but then attempts to operate in a different time frame.This type of error can be fatal for a market operation.An up trend in any time frame is defined by a demand line and an over bought line. A demandline connects the low points of two consecutive reactions of similar significance where thesecond reaction low is at a higher level than the first. Finding two reaction lows where thesecond is higher than the first is a simple matter. However, some Wyckoff traders who are newto the approach have difficulty with the idea of similar significance. Looking for reactions thatlast for approximately the same number of days or move the price approximately the samedistance can be helpful in identifying reactions of similar significance. While Wyckoff would notnecessarily frown on this approach, he would prefer that the trader identify two consecutivereaction lows that are both important points in the action. The most important points in the actionfor those looking for an up trend are the primary buying opportunities. Combining two of these
to define the demand line of an up trend is seen as being the best approach.To complete the definition of an up trend, the Wyckoff trader needs to define the over boughtline of the trend. This line is constructed parallel to the demand line. It passes through the top ofthe rally or advance that is between the two reaction lows used to define the demand line. Acommon error that new Wyckoff traders make in defining the over bought line is to use a top thatcomes before or after the two lows used to define the demand line. Making this error will resultin a trend channel that is either too wide or too narrow. The purpose of the over bought line is toindicate where thrusts in the up trend are likely to end. Defining a trend that is too wide or toonarrow can result in the trader looking for rallies to end higher than is likely or to close outpositions at prices that are lower than necessary.A down trend is defined by a supply line and an over sold line. The supply line connects the highpoints of two consecutive rallies of similar significance where the top of the second rally is at alower level than the first/ Wyckoff would prefer that two consecutive lows that are bothimportant points in the action be used to define the supply line. The most important points in theaction are those that Wyckoff identifies as primary selling opportunities. The over sold line of adown trend is constructed parallel to the supply line through the low point of the reaction ordecline that separates the two points used to define the supply line. Defining the over sold linethrough a point before or after the two points used to define the supply line will result in adistorted trend.Normal trend development will have an up trend and a down trend or two trends pointing in thesame direction separated by a horizontal trend or trading range. Trading ranges are defined by asupport level and a resistance level. If a trading range is following an up trend, the resistancelevel will be defined first. If a trading range is following a down trend, the support level will bedefined first. The resistance level of a trading range following an up trend is defined horizontallythrough the high point of the up trend that is being completed. The support level of this tradingrange is constructed parallel to the resistance level and passes through the low point of thereaction that follows the point used to define the resistance level. The trading range is confirmedby the rally that follows the low used to construct the support level if that rally respects theresistance level of the range. The support level of a trading range following a down trend isdefined horizontally through the low point of the down trend being completed. The resistancelevel of this trading range is constructed parallel to the support level and passes through the highpoint of the rally that follows the point used to define the support level. This trading range isconfirmed by the next reaction if that reaction does not make a lower low than the one used todefine the support leve,Since the trend is the most important thing that any Wyckoff trader can know about the action ofa market or an issue, defining the appropriate trend or trends for the time frame of the marketoperation that is being undertaken is the first thing that a trader should do each time anassessment of the action is made. A chart that does not have accurately defined trends drawn onit is unlikely to produce a profit for the trader. Without trend channels, it is not possible toidentify buying or selling opportunities or to properly asses the progress of an existing position.The trend is your friend as long as you trade in harmony with it.
Wyckoff Stock Market InstituteP.O. Box 4130Clifton Park, NY 12065www.wyckoffstockmarketinstitute.comStock Market Primary Buying OpportunitiesTest of SpringsAfter the stock market or an individual issue has been in a spring position and has responded tothe spring with a rally, there is likely to be a test of the spring. The test provides supply with asecond opportunity to come pouring into the market to crush the price and begin a sustaineddecline. In these cases, the test is said to have failed.However, in those cases where supply does not take control of the action, the test is said to havebeen successful. These are the tests that Wyckoff traders want to consider buying. As was thecase with the spring position, successful tests of springs are likely to be followed by a rally. Mostof the time, the response to the test of a spring takes the price to a higher level than was recordedon the initial response to the spring. Sometimes, the higher high is much higherThe quality of a test of a spring and its desirability as an entry point on the long side aredetermined by price spread and volume. A high quality test is one that unfolds on narrowingprice spreads and decreasing volumes. The ideal test is one where the average volume as the testdevelops is less than the average volume that was seen during the days leading to the springposition.The same is true with the price spreads. A high quality test will unfold on price spreads that onaverage are narrower than those leading to the spring. A third factor to consider in determiningthe quality of a test is where the low point of the test is in relationship to the low point of thespring. A high quality test will put in a higher bottom than was recorded on the spring.Not all tests are of high quality. However, not all lower quality tests fail. There are three ways inwhich a test can reveal itself to be of questionable quality. One is by making a lower low thanthe spring. This is a concern especially for the trader who took an initial position on the springbecause it provides supply with another opportunity to step up and take control of the action.A test can also be considered to be of lower quality if the average volume on the test is greaterthan it was on the development of the spring. The lowest quality tests are those that make alower low than the spring and are done on higher volume. As a general rule, these tests shouldnot be traded. The risk of the test failing is too great if it is of the lowest quality.
With some tests ending well above the low point of the spring while others more nearly reach thelow point of the spring and still others make new lows, it can be difficult to judge exactly wherethe test will end and where a position should be established. There are guidelines to consider inmaking these decisions. One is the halfway point of the response to the spring. Since it is normalfor a bullish rally to be followed by a halfway correction, the halfway point of the response tothe spring can be used a place to open a position.Another level to consider is the support level that was sprung. If the price respects that supportlevel on the test, it is indicating that a position can be justified. A third level of importance is thesupport level defined by the low point of the spring. This is the lowest level at which a positionshould be seriously considered.Those tests that are judged to be of lower quality either because of a lower low, higher volume orboth will likely be tested again at a later date assuming they do not fail. These are usuallyreferred to as being more important tests. Their quality is also determined by price spread,volume, low point and by a fourth factor. As with the initial test, the Wyckoff trader is lookingfor narrower price spreads, lower volumes and a higher bottom on the more important test.The fourth factor to consider is whether the response to the first test put in a higher high than theinitial response to the spring. The ability to make a higher high on the response to the first testindicates that the bulls are willing to follow the price higher. If a more important test exhibits allfour factors mentioned, it can be considered to have corrected the problem or problems that werepresent on the first test and taking a position can be considered.The disciplined Wyckoff trader will never take a position without at the same time placing a stopor buying some insurance. When a position is taken on the test of a spring, it is important that thestop be placed below the low point of the spring to keep the stop from being vulnerable. If thepotential indicated by the figure chart is not sufficient to allow the stop to be placed below thelow point of the spring, a position should not be taken. The determination as to whether the stopcan be placed below the low point of the spring is based on how many points are being riskedand how many points of potential profit are indicated. At least three points of potential profitshould be indicated for each point that is risked.Some Wyckoff traders choose to take their full position on the spring. Some choose to take theirfull position on the test of the spring. Both groups are taking more risk than those who choose totake only a partial position on the spring and then adding a second partial position on the test.The goal is to build a winning position as the action unfolds. After the test of the spring, thereare two additional opportunities that may provide places to add other partial positions. The Jamison Group, Inc.: Stock Market Primary Buying Opportunities- Back Ups
Wyckoff Stock Market InstituteP.O. Box 4130Clifton Park, NY 12065www.wyckoffstockmarketinstitute.comPrimary Buying OpportunitiesNormal CorrectionsEven after an issue or the market has left a trading range to the up side, jumped the creek andbacked up, a Wyckoff trader may still be presented with one more type of primary buyingopportunity. It or they depending on how the action unfolds develop on normal corrections inthe up trend that follows the trading range. Most advances develop as a series of thrusts ratherthan one sustained push toward the indicated objective. After each thrust, a correction of thatportion of the advance that has just been completed is likely. If the correction is normal and ifthe character of the action during the correction is bullish, a Wyckoff trader is provided with anopportunity to add to a position that was opened earlier at a lower level, or to take an initialposition if the amount of remaining potential in the anticipated move is large enough to make theeffort worthwhile.What is a normal correction? A normal correction is one where the price retreats to the vicinityof the halfway point of the previous thrust to the up side. Over the years, the vicinity of thehalfway point has come to be known as anything between the one third and two thirds point ofthe previous advance. If the up
Wyckoff tells us that the most important thing that anyone can know about the market or an individual issue is its trend. The trend is most simply defined as being the line of least resistance. Prices will tend to follow the line of least resistance until there is a significant development in the action that suggests that a change in trend should be anticipated. A trader can look at the price .File Size: 429KBPage Count: 106
