Transcription
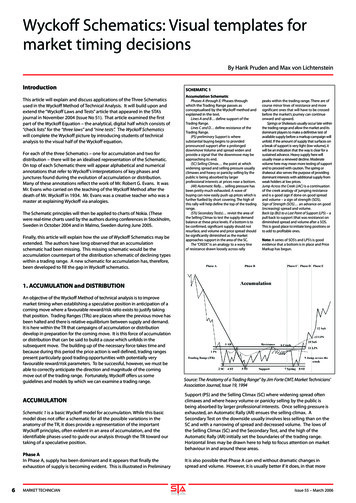
Wyckoff Schematics: Visual templates formarket timing decisionsBy Hank Pruden and Max von LichtensteinIntroductionThis article will explain and discuss applications of the Three Schematicsused in the Wyckoff Method of Technical Analysis. It will build upon andextend the “Wyckoff Laws and Tests” article that appeared in the STA’sjournal in November 2004 (Issue No 51). That article examined the firstpart of the Wyckoff Equation – the analytical, digital half which consists of“check lists” for the “three laws” and “nine tests”. The Wyckoff Schematicswill complete the Wyckoff picture by introducing students of technicalanalysis to the visual half of the Wyckoff equation.For each of the three Schematics – one for accumulation and two fordistribution – there will be an idealised representation of the Schematic.On top of each Schematic there will appear alphabetical and numericalannotations that refer to Wyckoff’s interpretations of key phases andjunctures found during the evolution of accumulation or distribution.Many of these annotations reflect the work of Mr. Robert G. Evans. It wasMr. Evans who carried on the teaching of the Wyckoff Method after thedeath of Mr. Wyckoff in 1934. Mr. Evans was a creative teacher who was amaster at explaining Wyckoff via analogies.The Schematic principles will then be applied to charts of Nokia. (Thesewere real-time charts used by the authors during conferences in Stockholm,Sweden in October 2004 and in Malmo, Sweden during June 2005.Finally, this article will explain how the use of Wyckoff Schematics may beextended. The authors have long observed that an accumulationschematic had been missing. This missing schematic would be theaccumulation counterpart of the distribution schematic of declining typeswithin a trading range. A new schematic for accumulation has, therefore,been developed to fill the gap in Wyckoff schematics.SCHEMATIC 1Accumulation SchematicPhases A through E: Phases throughwhich the Trading Range passes asconceptualised by the Wyckoff method andexplained in the text.Lines A and B define support of theTrading Range.Lines C and D define resistance of theTrading Range.(PS) preliminary Support is wheresubstantial buying begins to providedpronounced support after a prolongeddownmove Volume and spread widen andprovide a signal that the downmove may beapproaching its end.(SC) Selling Climax the point at whichwidening spread and selling pressure usuallyclimaxes and heavy or panicky selling by thepublic is being absorbed by largerprofessional interests at prices near a bottom.(AR) Automatic Rally selling pressure hasbeen pretty much exhausted. A wave ofbuying can now easily push up prices which isfurther fuelled by short covering. The high ofthis rally will help define the top of the tradingrange.(STs) Secondary Test(s) revisit the area ofthe Selling Climax to test the supply demandbalance at these price levels. If a bottom is tobe confirmed, significant supply should notresurface, and volume and price spread shouldbe significantly diminished as the marketapproaches support in the area of the SC.The “CREEK” is an analogy to a wavy lineof resistance drawn loosely across rallypeaks within the trading range. There are ofcourse minor lines of resistance and moresignificant ones that will have to be crossedbefore the market’s journey can continueonward and upward.Springs or Shakeouts usually occur late withinthe trading range and allow the market and itsdominant players to make a definitive test ofavailable supply before a markup campaign willunfold. If the amount of supply that surfaces ona break of support is very light (low volume), itwill be an indication that the way is clear for asustained advance. Heavy supply here willusually mean a renewed decline. Moderatevolume here may mean more testing of supportand to proceed with caution. The spring orshakeout also serves the purpose of providingdominant interests with additional supply fromweak holders at low prices.Jump Across the Creek (JAC) is a continuationof the creek analogy of jumping resistanceand is a good sign if done on good spreadand volume – a sign of strength (SOS).Sign of Strength (SOS) an advance on good(increasing) spread and volume.Back Up (BU) to a Last Point of Support (LPS) – apull back to support (that was resistance) ondiminished spread and volume after a SOS.This is good place to initiate long positions orto add to profitable ones.Note: A series of SOS’s and LPS’s is goodevidence that a bottom is in place and PriceMarkup has begun.1. ACCUMULATION and DISTRIBUTIONAn objective of the Wyckoff Method of technical analysis is to improvemarket timing when establishing a speculative position in anticipation of acoming move where a favourable reward/risk ratio exists to justify takingthat position. Trading Ranges (TRs) are places where the previous move hasbeen halted and there is relative equilibrium between supply and demand.It is here within the TR that campaigns of accumulation or distributiondevelop in preparation for the coming move. It is this force of accumulationor distribution that can be said to build a cause which unfolds in thesubsequent move. The building up of the necessary force takes time andbecause during this period the price action is well defined, trading rangespresent particularly good trading opportunities with potentially veryfavourable reward/risk parameters. To be successful, however, we must beable to correctly anticipate the direction and magnitude of the comingmove out of the trading range. Fortunately, Wyckoff offers us someguidelines and models by which we can examine a trading range.ACCUMULATIONSchematic 1 is a basic Wyckoff model for accumulation. While this basicmodel does not offer a schematic for all the possible variations in theanatomy of the TR, it does provide a representation of the importantWyckoff principles, often evident in an area of accumulation, and theidentifiable phases used to guide our analysis through the TR toward ourtaking of a speculative position.Phase AIn Phase A, supply has been dominant and it appears that finally theexhaustion of supply is becoming evident. This is illustrated in Preliminary6MARKET TECHNICIANSource: The Anatomy of a Trading Range” by Jim Forte CMT, Market Technicians’Association Journal, Issue 19, 1994Support (PS) and the Selling Climax (SC) where widening spread oftenclimaxes and where heavy volume or panicky selling by the public isbeing absorbed by larger professional interests. Once selling pressure isexhausted, an Automatic Rally (AR) ensues the selling climax. ASecondary Test on the downside usually involves less selling than on theSC and with a narrowing of spread and decreased volume. The lows ofthe Selling Climax (SC) and the Secondary Test, and the high of theAutomatic Rally (AR) initially set the boundaries of the trading range.Horizontal lines may be drawn here to help to focus attention on marketbehaviour in and around these areas.It is also possible that Phase A can end without dramatic changes inspread and volume. However, it is usually better if it does, in that moreIssue 55 – March 2006
dramatic selling will generally clear out all the sellers and pave the way fora more pronounced and sustained markup.Where a TR represents a Reaccumulation (a trading range within acontinuing upmove), we will not have evidence of PS, a SC, and ST asillustrated in phase A of ?Schematic 1Phase A will instead look more like Phase A of the basic Wyckoffdistribution schematic (described later in the article under Schematic 2 or3) but, nonetheless, Phase A still represents the area of the stopping of theprevious move. The analysis of Phase B through E would generally proceedin the same way as within an initial base area of accumulation.Phase BIn Phase B, Supply and Demand on a major basis are in equilibrium and thereis no decisive trend. The clues to the future course of the market are usuallymore mixed and elusive, however here are some useful generalisations.In the early stages of Phase B, the price swings tend to be rather wide, andvolume is usually greater and more erratic. As the TR unfolds, supplybecomes weaker and demand stronger as professionals are absorbingsupply. The closer you get to the end or to leaving the TR, volume tendsto diminish. Support and resistance lines, (shown as horizontal lines A, B,C, and D on the Accumulation Schematic 1) usually contain the priceaction in Phase B and will help define the testing process that is to comein Phase C. The penetrations or lack of penetrations of the TR enable us tojudge the quantity and quality of supply and demand.Phase CIn Phase C, the stock goes through a testing process. The stock may beginto come out of the TR on the upside with higher tops and bottoms or itmay go through a downside spring or shakeout, breaking previoussupports. This latter test is preferred, given that it does a better job ofcleaning out remaining supply from weak holders and creates a falseimpression as to the direction of the ultimate move. Schematic 1 showsus an example of this latter alternative.A spring is a price move below the support level of a trading range thatquickly reverses and moves back into the range. A spring is an example ofa “bear trap” because the drop below support appears to signal resumptionof the downtrend. In reality, though, the drop marks the end of thedowntrend, thus “trapping” the late sellers, or bears. The extent of supply,or the strength of the sellers, can be judged by the depth of the pricemove to new lows and the relative level of volume on that penetration.Until this testing process, we cannot be sure the TR is accumulation andmust wait to take a position until there is sufficient evidence that mark-upis about to begin. If we have waited and followed the unfolding TRclosely, we have arrived at the point where we can be quite confident ofthe probable upward move. With supply apparently exhausted and ourdanger point pinpointed, our likelihood of success is good and ourreward/ risk ratio favourable.The shakeout at point 8 on our Schematic 1 represents our first prescribedplace to initiate a long position. The secondary test at point 10 is better,since a low volume pullback and a specific low risk stop or danger point atpoint 8 gives us greater evidence and more confidence to act. A sign ofstrength (SOS) here will bring us into Phase D.Phase DIf we are correct in our analysis and our timing, what should follow here is aconsistent dominance of demand over supply as evidenced by a pattern ofadvances (SOSs) on widening spreads and increasing volume, andreactions (LPSs) on smaller spreads and diminished volumes. If this patterndoes not occur, then we are advised not to add to our position and look toclose our original position until we have more conclusive evidence thatmarkup is beginning. If the market or stock progresses as stated above,then we have additional opportunities to add to our position.Our aim here is to initiate a position or add to our position as the stock orcommodity is about to leave the trading range. At this point, the force ofaccumulation has built a good potential and could be projected by usingthe Wyckoff point and figure method.We have waited until this point to initiate or add to our positions in aneffort to increase our likelihood of success and maximise the use of ourIssue 55 – March 2006trading capital. In Schematic 1, this opportunity comes at point 12 on the“pullback to support” after “jumping resistance” (in Wyckoff terms this isknown as “Backing Up to the Edge of the Creek” after “Jumping Across theCreek”). Another similar opportunity comes at point 14, a more importantpoint of support and resistance. (See Side Bar).In Phase D, the mark-up phase blossoms as professionals begin to moveinto the stock. It is here that our best opportunities to add to our positionexist, before the stock leaves the TR.Phase EIn Phase E, the stock leaves the TR and demand is in control. Setbacks areunpronounced and short lived. Having taken our positions, our job hereis to monitor the stock’s progress as it works out its force of accumulation.At each of points 8, 10, 12, and 14 we may take positions and use pointand figure counts from these points to calculate price projections andhelp us to determine our reward/risk prior to establishing our speculativeposition. These projections will also be useful later in helping us targetareas for closing or adjusting our position.Remember that Schematic 1 shows us just one idealised model oranatomy of a trading range encompassing the accumulation process.There are many variations of this accumulation anatomy and weaddressed some of these considerations earlier. The presence of aWyckoff principle like a selling climax (SC) doesn’t confirm thataccumulation is occurring in the TR, but it does strengthen the case for it.However, it may be accumulation, redistribution or nothing. The use ofWyckoff principles and phases identifies and defines some of the keyconsiderations for evaluating most trading ranges and helps us determinewhether it is supply or demand that is becoming dominant and when thestock appears ready to leave the trading range.THE “JUMP” ACROSS THE CREEK” ANALOGYThe term “jump” was first used by Robert G. Evans, who piloted theWyckoff Associates educational enterprise for numerous years after thedeath of Richard D. Wyckoff. One of his more captivating analogies wasthe “jump across the creek” (JAC) story he used to explain how a marketwould break out of a trading range. In the story, the market is symbolisedby a Boy Scout, and the trading range by a meandering creek, with its“upper resistance line” defined by the rally peaks within the range. Afterprobing the edge of the creek and discovering that the flow of supply wasstarting to dry up, the Boy Scout would retreat in order to get a runningstart to “jump across the creek.” The power of the movement by the BoyScout would be measured by price spread and volume.Defining the JumpA jump is a
annotations that refer to Wyckoff’s interpretations of key phases and junctures found during the evolution of accumulation or distribution. Many of these annotations reflect the work of Mr. Robert G. Evans. It was Mr. Evans who carried on the teaching of the Wyckoff Method after the death of Mr. Wyckoff in 1934. Mr. Evans was a creative teacher who was a