Transcription
MassMutual Whole Life InsuranceThe Story Behind The NumbersA guide to reading your Whole Life illustration insure invest retire Life Insurance
Life insurance is the foundationupon which many financial plansare built.That’s because, at its core, it helps you fulfill your promises to the people you care about by delivering a financialresource when it’s needed most. It’s guaranteed protection your loved ones can count on when you are no longerthere to take care of them. It’s also a legacy you canchoose to leave for the future.What is an illustration?A life insurance policy, in particular a whole life insurancepolicy, can be a flexible protection product that providesboth guaranteed and non-guaranteed benefits. An illustration is a presentation that shows potential policy performance based on both guaranteed and non-guaranteedelements of a life insurance product over a number ofyears. Illustrations demonstrate how a life insurancepolicy works and how policy values (premiums, dividends, cash value, and death benefit) would be realizedunder the current dividend schedule, which is not guaranteed and is likely to change over time.What is the value of an illustration?can help show how your policy can provide the benefitsyou and your family are counting on over the course ofyour lifetimes.How do you read an illustration?In this guide, you will find a sample of the “TabularValues” section of a whole life insurance illustration. Thissection shows all of the key guaranteed and non-guaranteed values, along with other key policy details. We’veincluded explanations of these columns to help youbetter understand what this information means to you.An illustration must be provided to you prior to yourMassMutual policy being issued. However, to make amore informed decision, it may be beneficial to ask yourfinancial professional to show you different variations ofthe illustration earlier in the sales process.For additional explanations and definitions, be sure toread the sections of your personal illustration entitledIllustration Summary, Narrative Summary, and NumericSummary before making any purchase.While an illustration is not meant to predict the future, andvalues shown are likely to vary from your actual results, itThe decision to purchase life insurance should be based on long-term financial goals and the need for a deathbenefit. Life insurance is not an appropriate vehicle for short-term savings or short-term investment strategies.While the policy allows for access to the cash value in the short-term, such as through loans or partial surrenders, these transactions will impact the policy’s death benefit if the values are not restored prior to the insured’sdeath. You should know that there may be little to no cash value available for loans in the policy’s early years.
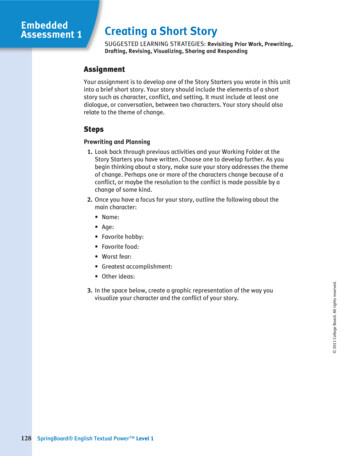
At the top of the illustration, you will find fourcritical pieces of information:a. Policy Nameb. Base Policy Face Amount – guaranteed amountthat will be paid to the policy beneficiary at thedeath of the insured as long as premiums are paid.c. Riders – any riders attached to the policy, someat an additional charge. Riders are options thatyou can add to your base policy to enhance yourcoverage (ask your financial professional for moreinformation on the rider options that are availablewith each product and any additional charges).d. Annual Premium – the amount the policy ownermust pay each year to keep the policy in force. Dividend Option – Dividends are paid annually toeligible participating policy owners and representan equitable share of a portion of the company’searnings. Dividends will fluctuate year after year andare not guaranteed. They are based on investmentresults, mortality savings, and savings on expenses.Eligible participating policyholders may elect toreceive dividends in cash or, depending on the typeof policy purchased, they may elect to have dividends: Reduce their premiums Purchase additional insurance without payingadditional premiums (paid up additions) Accumulate at interest Purchase additional one-year term insurance Repay a loanNow let’s work our way across the columns fromleft to right to explain what each group of numbersmeans to you and your insurance coverage. The first 3 columns in the illustration providebasic information:a. Year – the number of years the policy is assumedto have been in force.b. Age End Year – the insured’s age at the end ofeach policy year.c. Contract Premium Beg. Year – the premiumpayment amount that will be required at thebeginning of each policy year. The next two columns provide the guaranteed valuesin the policy.a. Guaranteed Cash Value End Year – the amount of thecash value that is guaranteed under this policy. Whenyour premium payments equal more than the cost ofinsurance, the excess is your policy’s cash value.b. Guaranteed Death Benefit End Year – the amount ofdeath benefit that is guaranteed to be paid on thispolicy at the insured’s death. The last group of columns shows the non-guaranteed,or potential, values that you may see within your policy.a. Annual Dividend End Year – the total amountof annual dividend payable at the end of thepolicy year; based on current dividends andnot guaranteed.b. Cash Value of Additions End Year – the amountof additional cash value the paid up additionspurchased with dividends at the end of eachpolicy year based on current dividends.c. Total Cash Value End Year – total cash value including all guaranteed and non-guaranteed values. Thisis the amount that would be paid if you surrenderedthe policy at the end of a given policy year.d. Paid-Up Additions End Year – the additional deathbenefit purchased with dividends at the end ofeach policy year based on current dividends.e. Total Death Benefit End Year – the amount thatwould be paid if death occurred at the end of agiven policy year. It equals the combined amountof guaranteed death benefit and paid up additionsbased on current dividends.f. Total Paid-Up Insurance End Year – the amount ofdeath benefit that would be paid at the end of eachyear if the policy owner decided to stop paying premiums and let the cash value fund the policy. Thepolicy will continue to earn dividends, if paid, whichcan be used to purchase additional insurancewithout paying additional premiums.Let’s shift our attention to the bottom portion ofthe illustration. Shows how much in premiums you would pay basedon the mode in which you decide to pay: annually,semi-annually, quarterly, or monthly. On the bottom of the illustration is where you willfind more of your personal information: sex, ageand risk class. Your risk class is assumed and maybe different than what is originally illustrated. It’sbased on your health, medical history and otherfactors and will affect the cost of your life insuranceprotection. If your risk class is different from what isoriginally illustrated, your agent will provide you witha new illustration.
Legacy 100 Whole LifeLife Insurance IllustrationPolicy: Legacy 100 Whole Life PolicyBase Policy Face Amount: 500,000.00Riders: ABR TIR Annual Premium: 9,060.00Tabular ValuesDividend Option: Dividends used to purchase Paid-Up Additions. Dividends are not guaranteed and are subject tosignificant fluctuations over the lifetime of the policy. Changes in dividends will change all Non-Guaranteedvalues shown in this illustration. ContractPremiumAgeYear End Year Beg YearGuaranteedCash ValueEnd Year----Non-Guaranteed Values----GuaranteedDeathBenefitEnd YearAnnualDividendEnd YearCashValue ofAdditionsEnd YearTotalCashValueEnd YearPaid-UpAdditionsEnd YearTotalDeathBenefitEnd YearTotalPaid-UpInsuranceEnd 701756,591796,927838,724 CoverageBase Policy Non-guaranteed values include dividends which are neither estimates nor guarantees, but are based on the 2007 dividend scale. Thedividend scale is reviewed annually and it is likely that dividends in future years will be lower or higher depending on the Company'sactual experience. For this reason, we strongly recommend that you look at a hypothetical lower scale illustration available uponrequest.Refer to the Narrative Summary for assumptions, explanations and additional information. Prepared on: September 20, 2007Version Number: 7.64 (CT)TAMRA: 23,990.00Prepared for: Male 45 (Male, 45, Select Preferred Non-Tobacco)Presented by: MassMutual Financial GroupPage 9 of 14
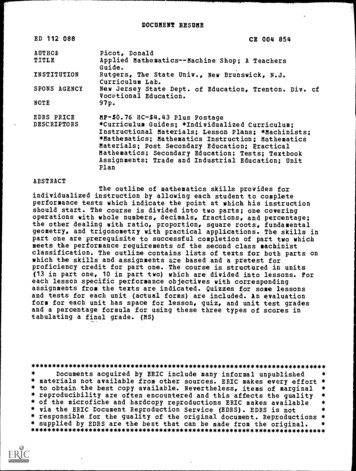
Key Milestones In YourWhole Life Insurance PolicyWhole life insurance, just as its name implies, provides protection for your whole life. Let’s take a closer look at someof the key milestones in the life of a whole life contract.Earn An Annual DividendOnce your policy is eligible to earn dividends, they maybe paid at the end of each year (dividends are notguaranteed). Your policy may not earn dividends in theearly policy years.In Year 3, our sample policy earns its first dividend of 1,090 andcontinues to earn a dividend each year after that based on thecurrent dividend schedule.Total cash value grows by amount greater than yourpremium paymentIn the early years of the policy, there is not a significantamount of cash value growth. However, once dividends startbeing paid into the policy, you will notice that your annualcash value amount exceeds your annual premium amount.Then, from that time on, the total cash value may increaseby more than the annual premium you pay each year.In Year 3, our sample policy’s total cash value of 9,990 exceedsthe annual premium payment amount of 9,060. Then, in theyears following, the total cash value increases each year bymore than 9,060.By reviewing the “Non-Guaranteed Cash Value IncreaseReport” pages in the illustration, you can easily see the yearto year Annual Cash Value Increase.Guaranteed cash value grows by amount greater thanyour premium paymentLet’s say MassMutual doesn’t pay a single dividend intoyour policy. In most policies, at some point in time, theannual guaranteed cash value increases will exceed theannual premium.In Year 6, our sample policy’s guaranteed cash value increasesfrom 26,340 to 35,470 or 9,130. This exceeds the annualpremium payment amount of 9,060.Total cash value is greater than the total premiumsyou’ve paidThis is the point in time when the total cash value in thepolicy exceeds the total amount of premiums you’ve paidinto the policy, based on the current dividend scale.In Year 10, our sample policy’s total cash value of 91,048exceeds the cumulative premium of 90,600.MassMutual. We’ll help you get there.SMMassMutual builds confidence among policyholdersthrough outstanding financial performance. Financialstrength ratings are a key measure of a company’s abilityto meet its financial obligations to its policyholders, andMassMutual’s financial strength ratings are among thehighest of any company in any industry.Financial Strength RatingsA.M. Best CompanyFitch RatingsLegacy 100 Whole LifeLife Insurance IllustrationPolicy: Legacy 100 Whole Life PolicyBase Policy Face Amount: 500,000.00Riders: ABR TIRAnnual Premium: 9,060.00Non-GuaranteedCash Value Increase ReportNon-Guaranteed Cash Value Increase ReportDividend Option: Dividends used to purchase Paid-Up Additions. Dividends are not guaranteed and are subject tosignificant fluctuations over the lifetime of the policy. Changes in dividends will change all Non-Guaranteedvalues shown in this illustration.--------Non-Guaranteed Values--------AgeYear End YearTotalNetOutlayTotalAnnualCash ValueIncreaseTotalCashValueEnd Year. . . . . . . . . . . . . . . . . . . . A (Superior). . . . . . . . . . . . . . . . . . . . . . . . . . . AAA (Exceptionally Strong)Moody’s Investors Service, Inc. . . . . . . . Aa1 (Excellent)Standard & Poor’s Corp. . . . . . . . . . . . . . . AAA (Extremely Strong)This information is current as of February 1, 2008. Ratings are subject tochange. Ratings apply to MassMutual and its subsidiaries C.M. Life InsuranceCompany and MML Bay State Life Insurance Company.TotalDeathBenefitEnd 1201,013,4991,053,6031,095,5941,139,607This brochure should be accompanied by anillustration that your financial professional hasprepared specifically for you. Go over it in detailand ask questions. Your illustration is designedto show you the power of your whole lifeNon-guaranteed values include dividends which are neither estimates nor guarantees, but are based on the 2007 dividend scale. Thedividend scale is reviewed annually and it is likely that dividends in future years will be lower or higher depending on the Company'sactual experience. For this reason, we strongly recommend that you look at a hypothetical lower scale illustration available uponrequest.Refer to the Narrative Summary for assumptions, explanations and additional information. This illustration is not valid unlessaccompanied by or preceded by a Basic Illustration dated 09/26/2007. Refer to the Basic Illustration for guaranteed elements and otherimportant information.Prepared on: September 26, 2007Version Number: 7.64 (CT)TAMRA: 23,990.00Prepared for: Male 45 (Male, 45, Select Preferred Non-Tobacco)Presented by: MassMutual ProducerPage 12 of 16insurance contract and how it can provideguarantees and flexibility for a lifetime.
Massachusetts Mutual Life Insurance Companyand affiliates, Springfield, MA 01111-0001www.massmutual.comSecurities offered through registered representatives of MML InvestorsServices, Inc., 1295 State Street, Springfield, MA 01111. 2008 Massachusetts Mutual Life Insurance Company, Springfield, MA. All rights reserved. www.massmutual.com.MassMutual Financial Group is a marketing name for Massachusetts Mutual Life Insurance Company (MassMutual)[of which Retirement Services is a division] and its affiliated companies and sales representatives.LI2007050 308CRN200910-95288
A life insurance policy, in particular a whole life insurance policy, can be a flexible protection product that provides both guaranteed and non-guaranteed benefits. An illus-tration is a presentation that shows potential policy per-formance based on both guaranteed and non-guaranteed elements of a life insurance product over a number of years.