Transcription
Preserving the Big Picture: Visual Network Traffic Analysis with TNVJohn R. GoodallWayne G. LuttersPenny RheingansAnita KomlodiUniversity of Maryland, Baltimore CountyABSTRACTWhen performing packet-level analysis in intrusion detection,analysts often lose sight of the “big picture” while examiningthese low-level details. In order to prevent this loss of context andaugment the available tools for intrusion detection analysis tasks,we developed an information visualization tool, the Time-basedNetwork traffic Visualizer (TNV). TNV is grounded in anunderstanding of the work practices of intrusion detectionanalysts, particularly foregrounding the overarching importance ofcontext and time in the process of intrusion detection analysis.The main visual component of TNV is a matrix showing networkactivity of hosts over time, with connections between hostssuperimposed on the matrix, complemented by multiple, linkedviews showing port activity and the details of the raw packets.Providing low-level textual data in the context of a high-level,aggregated graphical display enables analysts to examine packetlevel details within the larger context of activity. Thiscombination has the potential to facilitate the intrusion detectionanalysis tasks and help novice analysts learn what constitutes“normal” on a particular network.CR Categories: H.5.2 [Information Interfaces And Presentation]:User Interfaces—Graphical User Interfaces (GUI); C.2.0[Computer-Communication Networks]: General—Security andProtectionKeywords: Network visualization, network analysis, informationvisualization, intrusion detection1INTRODUCTIONWith the size and complexity of networks continuouslyincreasing, security analysts face mounting challenges of securingand monitoring their computing infrastructure for attacks. Thistask is generally aided by an Intrusion Detection System (IDS),which attempts to automatically identify successful andunsuccessful attacks or abuse of computer systems [21].Automated IDSs are a useful starting point for uncoveringsecurity compromises, but they are just that: a starting point.Analysts must then dig deeper into supplemental data sources todetermine the accuracy and severity of an IDS alert. This usuallyincludes the arduous task of collecting and identifying the relevantdetails of network traffic related to the event being investigated.In addition to an IDS alert, the initial trigger event can comefrom other data sources as well. However, other sources ofsecurity related events often do not include the same level ofdetail as IDS alerts. These more ambiguous sources could comeemail: jgood@umbc.eduemail: lutters@umbc.eduemail: rheingan@cs.umbc.eduemail: komlodi@umbc.eduWorkshop on Visualization for Computer SecurityOctober 26, Minneapolis, MN, USA0-7803-9477-1/05/ 20.00 2005 IEEE.from, for example, a network monitoring system showing unusualspikes in traffic or users complaining to the help desk that thenetwork seems slow. These types of vague starting points makefurther investigation problematic using current network analysistools. From an IDS alert, an analyst can usually pinpoint the timeof the event and the hosts involved in a potential attack.Whether the starting point of analysis is data rich, such as anIDS alert, or data impoverished, such as a phone call from a user,analysis of a network security event is a complex task. The toolsthat analysts currently use, such as Tcpdump [4] or Ethereal [1],focus on extracting the details of individual packets, but lack amechanism for providing a simultaneous “big picture” view of thedata. This places the burden of putting individual packet detailsinto a larger context of surrounding network activity on theanalyst. Additionally, these kinds of tools excel at filtering andsearching for details, but the analyst needs to know exactly whatthey are looking for in the data; they are not as useful for lessstructured data exploration.To provide intrusion detection (ID) analysts with morecomplete support of the entire process of ID, we developed theTime-based Network traffic Visualizer (TNV). The design of thisvisualization is grounded in the work practices of ID analysts.Because of potentially ambiguous security trigger events, TNVemphasizes the temporal aspects of the data, which often serves asthe starting point for analysis. The timeline of an event andputting an event into the larger context of activity were found tobe crucial in ID analysis tasks. Thus, TNV preserves context bypresenting a big picture view of the data linked to other visual andtextual views of the data. This allows analysts to explore networktraffic details at a simultaneous macro- and micro-levels.This paper is organized as follows: section 2 outlines relatedresearch in the area of visualization for network security andanalysis, section 3 presents TNV’s design and interactionmechanisms, section 4 describes some typical scenarios of howTNV can facilitate analysts’ decision making, section 5 presentsour future work, and section 6 presents our conclusions.2RELATED RESEARCHMany information visualizations of network data have used a linkand node graph-based techniques to show communication patternsbetween nodes. Some visualizations of network data have placednodes according to their geography (e.g., [6, 23]), while othersclustered nodes according to their similarity (e.g., [8]). As oneexample, SeeNet uses a graph visualization that places nodesaccording to their natural geographic location and uses thicknessand color to encode network statistics to provide a high-level viewof network traffic [6]. These kinds of graph-based visualizationsare useful in mapping networks and usage patterns by explicitlyshowing links between nodes, but can have problems withscalability, display clutter, and occlusion.Researchers have recently begun applying informationvisualization to the particular problem of network security.Erbacher and colleagues have developed an animated glyph-basedvisualizations that use system log files to show connections fromexternal hosts to a monitored server or small network environment[9, 10]. Several systems have adapted parallel coordinates ofintrusion detection related data to: fingerprint network attack tools47
[7], visualize log files [11], support new IDS event triage [25],and facilitate situational awareness [26]. Also in support ofproviding analysts with better situational awareness is NVisionIP,which visualizes NetFlow data in a scatterplot-based system withmultiple levels of granularity for drilling down into the datavisually [19]. PortVis takes summary network data and visualizesport activity as a scatterplot linked to several other views of thedata [22].In attempting to understand the challenges of network securitywork and how information visualization can be successfully usedto facilitate this work, there have been several user studies ofsecurity analysts. Research at the National Center forSupercomputing Applications described the importance ofproviding analysts with situational awareness, derived frominterviews with security analysts, and presents two informationvisualization tools to support this area of need [27]. Research atIBM also underlines the importance of situational awareness,particularly in relation to the difficult problem of new securityevent triage [25]. Ball, Fink, and North [5] noted the varied jobtypes associated with system administration work and describeadministrators’ foremost interest in activity on their own networkrelated to the machines they manage.In our own research to understand the work practices of IDanalysts, we interviewed analysts working in diverse job roles andorganizations [12]. One important outcome from that research isthe development of a basic task model of ID work. The work ofID includes three main tasks: monitoring, analysis, and response.The monitoring task is typically focused on the surveillance of theoutput of an IDS, involving the need for situational awareness.Analysis focuses on determining the accuracy and severity of asecurity event uncovered in the monitoring task. This is the mostcomplex task, requiring a great deal of knowledge and experienceto accomplish successfully. Response refers to an analyst’sreaction to a security event. Both the monitoring and analysistasks could be aided through information visualization tools.However, most of the visualizations for security to date seem tobe targeted more towards facilitating monitoring than analysis.All of the systems described above seem to be designed tosupport what we broadly refer to as the monitoring task. Thereason for this classification is principally due to the level ofdetail available to these systems, which typically use aggregatedor summary data, or system logs that do not have the raw packetdata available for deeper analysis. These systems can alertanalysts to anomalous activity on their networks or systems,augment the monitoring tasks, or increase situational awareness,but they are not likely to support the more detailed packet-levelanalysis that is necessary in the analysis of network securityevents. To provide analysts with more complete support beyondmonitoring, we designed a visualization that focuses on theanalysis task. One of the primary implications of designing foranalysis is that the exact details of network traffic must be readilyavailable. The tool presented in this paper places these details intothe larger context of all network activity, allowing analysts toexplore the details of an individual packet without sacrificing thecontextual information needed to make decisions on the accuracyand severity of security events.3TNV: TIME-BASED NETWORK TRAFFIC VISUALIZERTNV is a visualization tool designed to facilitate the analysisprocesses related to intrusion detection by providing a focusedview on packet-level data in the high-level network trafficcontext. While it was designed specifically for the needs of IDanalysts, TNV is expected to also be useful in networktroubleshooting and aiding novice administrators in learning theidiosyncrasies of their network environments.48TNV is implemented in Java using the Sourceforge jpcaplibrary [2]. This library utilizes libpcap, a widely deployedstandard for network packet capture. TNV is capable of capturingpackets in real time or opening previously generated libpcap files.3.1TNV Design RationaleOur prior research identified some of the largest problemsexperienced by analysts, including data inundation and aninability to keep sight of the big picture when doing low-levelanalysis. The problem of data overload related to ID is wellknown and there are many examples of these problems in theliterature (e.g., [17, 18]). This pressing problem is one of thereasons that information visualization—which can make datamore compact and understandable—presents such an appealingsolution to the challenges of ID.The need for retaining context when performing analysis was arecurring theme in our requirements gathering and forms the basisof the design of TNV. Analysts are rarely able to make a decisionabout a security event (such as an IDS alert) based solely on thedata available from that artifact. Instead, analysts must build up amore complete picture of the event being investigated byreconstructing the event’s timeline, the root cause of the event,and any related outcomes. These are what form the contextsurrounding an event, and of particular importance is the temporalcontext that helps reconstruct a timeline. For example, an IDSalert describing a potential web server attack will lead the analystto attempt to decipher how the attack was carried out, if it wassuccessful, if any other web servers might have been affected, andif the attacker may have attempted other exploits. Reconstructingthe contextual details surrounding an event is crucial informulating the proper diagnosis of a security event. However, thetools that analysts currently use do not fully support the discoveryand comprehension of this important contextual data. Instead, theyfacilitate directed queries of low-level details throughsophisticated searching and filtering mechanisms, but thispresupposes that the analyst knows what to search for and doesnot help to see the big picture. Analysts repeatedly discussed howthey would lose context when examining the details of packetsand leaving the displays with the high-level contextual data. Toovercome this lack of synchronization, analysts had to rely ontheir short-term memory to integrate low-level and high-level datawithout external representational support. Because of this, thedesign of TNV focuses on making the contextual data surroundingan event explicit and available on one screen; providing a bigpicture view, even when doing packet-level analysis.In addition to providing analysts with context for the detailsthey are investigating, time is crucial in analysis for severalreasons: All of the data sources and tools used by our participantsgenerate a timestamp, which despite being generated ondifferent hosts correspond nearly exactly (all participants useNetwork Time Protocol on their systems). Because thesecurity event triggering analysis may originate from anynumber of sources, the constancy of time across differentsources allows analysts to synchronize different dataelements from different sources. While the security event trigger may be an IDS or othermonitoring system, it could also originate from a moreambiguous source, such as user feedback. This kind of vaguetrigger event often makes beginning the analysis task fromanything other than time problematic. Time is available notonly to all systems, but also to people. Events that occur before or after a trigger event can give theanalyst vital clues about the nature of the event. As a
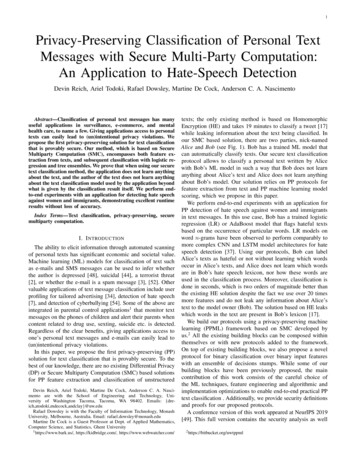
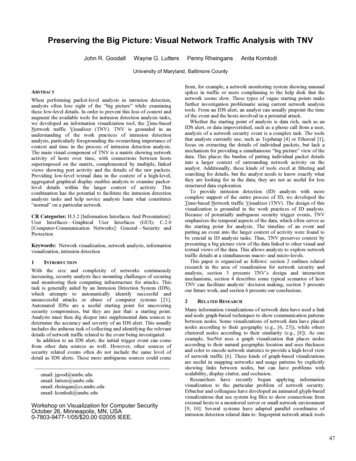
Figure 1. TNV showing 50,000 network packets in almost one and one half hours; network links with web (TCP port 80) activity are highlightedand the details of a selected host (A) are shown at right (port activity) and below (packet details) the main display. (1) is the main visualizationmatrix; (2) is the navigation with data overview mechanism; (3) shows the legend of colors and column time interval; (4) is the table of allpackets for selected host; (5) shows packet details for selected row in table; (6) is the emphasis filtering panel; (7) shows port activity.straightforward example, if immediately prior to the eventbeing investigated, every host on the network was portscanned from a single destination, this could indicate that anattacker doing reconnaissance identified and exploited avulnerability.For these reasons, TNV emphasizes the temporal aspects ofnetwork data and permits the insights learned from using TNV tobe easily correlated and compared with other tools, which willlikely also have a corresponding timestamp.3.1.1Data OverviewAt the highest level of aggregation, to provide analysts with avisual overview of the entire data set, TNV includes a histogramof the relative network traffic activity of the entire dataset (labeled2 in Figure 1). This overview display also provides the primarynavigation for moving around in the data. By default, the entiredata set is shown when a new file is opened or a live packetcapture completes. The analyst can then move either of the scrollhandles to effectively zoom in or out the data on the main display,described below. Moving the scroll handles reduces or increasesthe time interval for each column in the visualization matrix anddetermines how much of the data is shown in the mainvisualization. The current time interval represented by all columnsis shown to the right of the legend panel (labeled 3 in Figure 1).The data currently displayed in the main visualization (labeled 1in Figure 1) is the shaded area between the handles. To zoom intothe data, the handles are moved closer together, decreasing thetime interval for each column; to increase the amount of time foreach column, the handles are moved farther apart. This provides avery high-level overview of the data and keeps the analyst awareof the currently displayed location within the data set.3.1.2Matrix VisualizationThe main visual component of TNV (labeled 1 in Figure 1)combines a matrix display of host IP address and network packettimestamp with a link display explicitly showing connectivitybetween hosts. The visualization matrix displays time on the xaxis and all host IP addresses (source and destination) available in49
the data set along the y-axis, sorted by IP address. Each columnrepresents a time interval, and each row a host, labeled identicallyon both sides of the display. The number of packets for that timeinterval is encoded in the color of the resulting box. This userdefined color-to-number-of-packets mapping is shown in thecenter of the legend panel (labeled 3 in Figure 1). In the exampleshown in Figure 1, gray represents a relatively low number ofpackets and red a high number of packets, with lighter hues withineach color scale representing gradations along the scale. Thus, theanalyst can very quickly identify hotspots, areas with higheramounts of traffic, within the data set. Because the visualization isdesigned around a timeline, the analyst can also easily identifytrends in network activity for individual hosts. For example, ifeach time interval has low number of packets interrupted by atime interval with a very large number of packets, this maywarrant further investigation.Similar to the “home-centric” perspective described in Ball,Fink, and North [5], TNV emphasizes local hosts because of theirparamount importance from an ID analyst‘s perspective thanremote hosts. The analyst can set an IP address range thatconstitutes their home, or local, network, and the hosts in the datathat meet this criterion are subtly differentiated. These local hostshave bolded, larger labels (shown in the identical labels at theright and left of the display) and the height of the rows can beincreased based on a user-defined setting. In this way, it is easyfor the analyst to see which hosts are part of their network, andthus under their purview. This is important because certain kindsof network traffic, such as network monitoring traffic, can beexpected from hosts within a network, but would be suspicious iforiginating from an external host.3.1.3Network LinksWhile visualizing the number of packets is a useful starting pointfor exploring network data, it is not enough by itself to allowanalysts to draw detailed conclusions from the data. It would beobvious where hotspots in the data are, but would not reveal anyadditional insight as to why those areas have a large amount ofactivity. To provide the analyst with additional information aboutthe nature of the data, TNV displays network links between hostswithin a single time period, as shown in the center of thevisualization in Figure 1. The lines are drawn within each columnto represent the network links between two hosts that occurredwithin that time period. Links are drawn from the source of thelink to the destination of the link, starting from either side of thecolumn. In most cases links will be displayed as an X pattern,because hosts often send and receive data as they communicate. Itshould be noted that the absence of this X pattern may indicate ascan where a host sends packets crafted to determine if ports areactive, but without expecting a reply. This can lead to displayclutter and future versions may include an option to draw uniquelinks only once, rather than for each source.The color of the links, defined by the user, shows the protocolof traffic those links represent. Like the color-coding for the hosts,these preferences are always displayed in the legend panel(labeled 2 in Figure 1, at left). By default, links are drawn with avery low opacity and a fixed, relatively narrow width. This allowsthe analysts to get an overall sense of the link communicationsbetween hosts without having the display too cluttered. There arevarious filtering mechanisms, described below,
textual views of the data. This allows analysts to explore network traffic details at a simultaneous macro- and micro-levels. This paper is organized as follows: section 2 outlines related research in the area of visualization for network security and