Transcription
1BY: REV: netscape@pub4/third/CLS journals3/GRP eta/JOB v6-i1/DIV 002901etaJOURNAL OF EMERGING TECHNOLOGIES IN ACCOUNTINGVol. 62009pp. 1–XXXXAmerican Accounting AssociationDOI: XXXXThe Impact of Gartner’s Maturity Curve,Adoption Curve, Strategic Technologieson Information Systems Research, withApplications to Artificial Intelligence, ERP,BPM, and RFIDDaniel E. O’LearyUniversity of Southern CaliforniaABSTRACT: How does technology maturity and adoption affect samples, researchissues, and use of methodologies in information systems? What is a source of someresearch issues in strategic and emerging technologies? This paper addresses thesequestions and others using some frameworks generated by a well-known corporateresearch group.Gartner Group has been an icon to its corporate clients. However, Gartner hasreceived only limited attention by academics. This paper examines three related frameworks used by Gartner for analyzing information systems 共IS兲 and accounting information systems 共AIS兲 research. Although researchers have previously examined the adoption curve, they generally have ignored the impact of the technology maturity curve andthe interaction of the two curves. The paper generates a number of findings, includingthe finding that where a technology is on the maturity curve limits and facilitates thetype of research questions that can be addressed regarding that technology. In addition, Gartner’s “strategic technologies” can provide a basis for understanding whichtechnologies are likely to be appropriate for analysis by researchers.Keywords: Gartner; maturity curve; adoption curve; strategic technologies; AISresearch; information systems research; artificial intelligence; enterpriseresource planning systems; ERP; business process management; BPM;radio frequency identification; RFID.INTRODUCTIONhe Gartner Group provides information about a wide range of technologies, generally tocorporate clients, to facilitate the analysis and purchase of technologies. Although Gartneris well-known in practice, there has been limited research in information systems 共IS兲 oraccounting information systems 共AIS兲 regarding frameworks used by Gartner for technologyTThis is an extended version of an earlier paper that was presented at the 2008 American Accounting Association AnnualMeeting in Anaheim, CA. The author thanks Paul Steinbart for his comments and suggestions on an earlier version of thispaper.Corresponding author: Daniel E. O’LearyEmail: oleary@usc.eduPublished Online: xx xxxx1
1BY: REV: netscape@pub4/third/CLS journals3/GRP eta/JOB v6-i1/DIV 002901eta2O’Learymaturity or adoption. Further, there has been limited research using Gartner’s so-called “strategictechnologies.” Although O’Leary 共2008兲 initiated an analysis of AIS research from the perspectiveof Gartner’s so-called “hype cycle,” this paper analyzes information systems research from theperspective of the maturity and adoption curves, which have found broader-based acceptance.Purpose of this PaperPrevious AIS researchers 共e.g., Murthy and Wiggins 1999兲 have examined the overall issue ofwhat constitutes research in AIS. Other researchers have suggested the use of particular kinds ofresearch, e.g., case studies 共Baker 2002兲 or design science 共e.g., March and Smith 1995兲, toinvestigate information systems research issues. However, it is not clear when case studies or othermethodologies 共e.g., design science兲 are appropriate, or which technologies likely should be investigated.In addition, researchers 共Sutton 2005兲 have indicated that AIS is an applied discipline and thatAIS research can guide practice. However, there has been limited assessment of the flow ofcontribution from practice to AIS. By using some of Gartner’s models, this paper suggests thenotion that practice also influences theory, and that both could gain from taking each other intoaccount.Rogers 共1983兲 and others have examined the impact of the “adoption curve,” e.g., studyingcharacteristics of firms at different stages, such as “innovator firms,” for technology diffusion.However, the role of the maturity of technology has not received the same level of attention andhas not been juxtaposed to technology adoption.Accordingly, the specific purpose of this paper is to examine some of the implications of threedifferent theoretical frameworks, used in practice, on research in accounting information systems.In particular, I will examine how the passage of a technology through a life cycle 共as captured byGartner’s maturity cycle and the adoption curve兲 affects the research that is done on or about thattechnology. In addition, I will examine how using that life cycle can facilitate choice of a methodology and a technology to analyze the effect of the technology. Further, I integrate Rogers’共1983兲 adoption curve into the analysis in order to drive additional understanding, examining thejoint impact of the stage of technology and adoption curve on firms. Finally, I examine thepotential use of Gartner’s strategic technologies to facilitate the choice of technologies to research.I find that different research methodologies are appropriate or inappropriate at particular timesin the technology life cycle, based on factors that can be identified from the maturity cycle andadoption curves. In addition, I find that empirical research about technologies is vulnerable tosample bias, depending on where technologies are in their life cycle. I also find that the “strategictechnologies” concept provides an apparent approach for identifying new technologies researchinvestigations in AIS.Outline of this PaperThis paper proceeds in the following manner. The first section has provided the motivationand the outline of the paper. The next section briefly reviews Gartner’s maturity curve, the adoption curve, and Gartner’s notion of strategic technologies. The third section drills down on thematurity curve and its implications for AIS research. The fourth section analyzes in more detail theadoption curve, examining both Gartner’s cumulative adoption curve and Rogers’ 共1983兲 curve.The fifth section studies the impact of integrating the maturity and adoption curves, and facilitatesan understanding that empirical research may be gathering biased samples. The sixth sectionprovides an example to illustrate the discussion, using enterprise resource planning systems. Theseventh section examines some extensions to the maturity curve. The eighth section analyzesJournal of Emerging Technologies in AccountingAmerican Accounting AssociationVolume 6, 2009
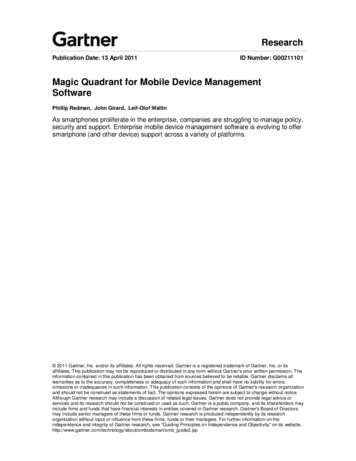
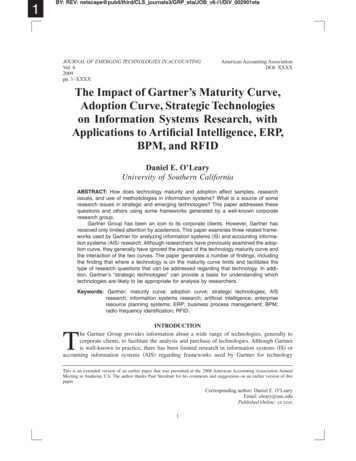
1BY: REV: netscape@pub4/third/CLS journals3/GRP eta/JOB v6-i1/DIV 002901etaThe Impact of Gartner’s Maturity Curve3Gartner’s notions of strategic technologies as a basis of understanding which technologies arelikely to have an impact in AIS. The final section briefly summarizes the paper, and discusses thecontribution and some extensions.MATURITY CURVE, ADOPTION CURVE, AND “STRATEGIC TECHNOLOGY”Linden and Fenn 共2003, 6; see also Fenn 2007, 7兲 indicated that “several technology life cyclemodels attempt to gauge the evolution of a technology. The two most popular are the 关maturitycurve兴, which shows the increase in a technology’s performance over time, and the adoption curve,which shows market adoption over time.” The maturity curve and cumulative adoption curve aresummarized in Figure 1.Maturity Curve: Technology Change CategoriesThe maturity curve traces a technology’s change over time as it matures to meet user needs,and takes the form of a so-called “S” curve. Effectively, the curve maps the cumulative capabilitylevel of a technology. Labels for different stages in the maturity curve have been generated byGartner and are referred to as the “maturity levels.” Fenn 共2007兲 lists key characteristics for theFIGURE 1Adoption S Curve and Maturity CurveSource: Fenn (2007).Journal of Emerging Technologies in AccountingVolume 6, 2009American Accounting Association
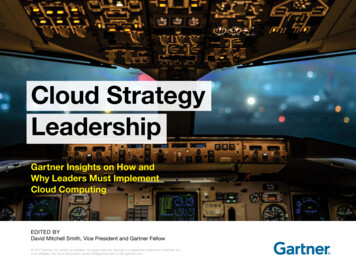
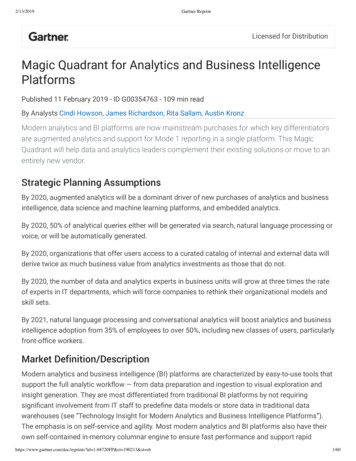
1BY: REV: netscape@pub4/third/CLS journals3/GRP eta/JOB v6-i1/DIV 002901eta4O’Learyseven different levels or stages of the framework 共see Table 1兲: embryonic, emerging, adolescence,early mainstream, mature mainstream, legacy, and obsolescence. The curve can be integrated withthe different qualitative levels as seen in Figure 2.Adoption Curve: Firm Adoption CharacteristicsThe adoption curve has been presented in two different formats. The cumulative version, usedby Gartner, is the adoption curve that traces the cumulative adoption of a technology over time. Atthe intersection of the maturity and adoption curves, a technology has achieved roughly a 20percent adoption rate. Further, when cumulative adoption decreases, it indicates that the technology is obsolete and users are shunning it for other technologies.Rogers 共1983兲 also investigates the adoption curve and includes additional information to theprobability density version of the adoption curve 共in contrast to the cumulative version兲, as seen inFigure 3. So-called “ideal” types of firms are generated based on when the technology is adopted:innovators, early adopters, early majority, late majority, and laggards. The characteristics of theselevels are summarized in Table 2.“Strategic Technology”“Strategic technology” is a bit different from the two previous frameworks. The term impliesa value to enterprises that is associated with the technology, not just with how mature the technology is or how much adoption the technology is getting. In particular, Gartner 共2007兲 defines astrategic technology as a technology:TABLE 1Maturity LevelsMaturity LevelEmbryonicEmergingAdolescentEarly MainstreamMature MainstreamLegacyObsoleteStatusIn labsCommercialization by vendorspilots and deployments byindustry leadersMaturing technologycapabilities and processunderstanding uptakebeyond early adoptersProven technology vendors,technology and adoptionrapidly evolvingRobust technology not muchevolution in vendors ortechnologyNot appropriate for newdevelopments cost ofmigration constrainsreplacementTechnology is rarely used;new technology hassupplanted originaltechnologyProducts/VendorsNoneFirst generation high pricemuch customizationSecond generation lesscustomizationThird generation more out ofbox methodologiesSeveral dominant vendorsMaintenance revenue focusUsed/resale market onlySource: Fenn 共2007兲, available at: http://www.gartner.com/DisplayDocument?id 509085.Journal of Emerging Technologies in AccountingAmerican Accounting AssociationVolume 6, 2009
1BY: REV: netscape@pub4/third/CLS journals3/GRP eta/JOB v6-i1/DIV 002901etaThe Impact of Gartner’s Maturity Curve5FIGURE 2Adoption Curve and Maturity Curve with Levels and Adoption RatesSources: Linden and Fenn (2003) and Fenn (2007).with the potential for significant impact on the enterprise in the next three years. Factors that denotesignificant impact include a high potential for disruption to IT or the business, the need for a majordollar investment, or the risk of being late to adopt.Unlike the maturity curve or the adoption curve, the notion of strategic technologies is focused virtually entirely on the presentation of ten specific technologies for each year. The strategictechnologies for 2004–2008 are summarized in Table 3.MATURITY CURVE AND INFORMATION SYSTEMS RESEARCHThe maturity level framework provides a view of the use of technology changing over time共Table 1 and Figure 2兲. We will examine the impact of the technology maturity of a technology onAIS research by examining each of the stages.EmbryonicThe “embryonic” stage is the first stage on the maturity curve. It is at this stage that mosthardware and computer science-like research is done and that technology design questions areJournal of Emerging Technologies in AccountingVolume 6, 2009American Accounting Association
1BY: REV: netscape@pub4/third/CLS journals3/GRP eta/JOB v6-i1/DIV 002901eta6O’LearyFIGURE 3Adapter Categorization on Basis of InnovativenessSource: Rogers (1983, 247).asked. Further, the models that ultimately are embedded in software and applications are initiatedat this stage, before commercialization. For example, Hart et al. 共1978兲 developed an expertsystem in a geology domain that laid out key principles of representing uncertainty in expertsystems. This is truly a stage where design science 共Hevner et al. 2004兲 dominates. There is nodata for empirical analysis or even case studies of the impact of the technology on organizations,and no actual information about so-called “things gone right” or “things gone wrong” with thetechnology in organizations, since it has not really been deployed in organizations. However, atthis stage, research can begin to anticipate developments and applications by soliciting expertopinion 共O’Leary 2002兲, e.g., in Delphi studies 共Baldwin-Morgan 1993兲. Further, behavioral research might be done that anticipates the use of the technology, e.g., user interface design. Surveyresearch done at this stage can only be exploratory about what a user might want or not want,because the technology has not been deployed in real-world settings at this stage.EmergingTechnologies at the emerging level are being placed in application environments for the firsttime and thus are “emerging” out of the laboratories. There is commercialization by vendors, andthere are pilots and deployments by industry leaders. However, the technology is first-generation.Because the technology and its underlying models have not stabilized, design science developments by academics may contribute to the overall development of the technology. Further, designscience researchers can facilitate organizational adoption with further developments in the technology.It is at this stage in a technology’s maturity that researchers and implementers can begin to seewhat is going right with applications and what is going wrong. Case studies might be used tocapture some of those characteristics to better understand the situation of the technology in orga-Journal of Emerging Technologies in AccountingAmerican Accounting AssociationVolume 6, 2009
1BY: REV: netscape@pub4/third/CLS journals3/GRP eta/JOB v6-i1/DIV 002901etaThe Impact of Gartner’s Maturity Curve7TABLE 2Adopter CategoriesAdopter CategoryInnovatorsEarly AdoptersEarly MajorityLate MajorityLaggardsKey CharacteristicsRoleVenturesome, eager to try newideas. Communicationpatterns among innovatorsare common.Respectable, has the greatestdegree of opinionleadership. The people tocheck with before using anew idea.Deliberate, adopt just beforethe average. Interact withpeers, but not in aleadership position.Skeptical, adopt just after theaverage. Innovations areapproached with skepticaland cautious air.Launches new idea in thesocial system by importingthe innovation from outsidesystem.Decrease uncertainty about anidea by adopting it and thenconveying an evaluation tonear peers.Traditional, they possess noopinion leadership. Theirpoint of reference is in thepast. When laggards adopt,the innovation may havealready been superseded.Provide deliberate willingnessin adopting innovations, butnot lead.Their scarce resources meanthat almost all of theuncertainty about an ideamust be removed before theyadopt it.Last to adopt an innovation.Source: Rogers 共1983兲, pp. 247–251.nizations, as individual firms implement the technology 共e.g., Sviokla and Keil 1988兲. Further,surveys or interviews with experts, vendors, and industry leaders can begin to understand what isor is not working as the technology is introduced into organizations. At this stage, vendors may bereaching out to academics to help with the technology diffusion. As a result, some researchersmight develop prototypes or pilot implementations themselves to study the technology as situatedin organizations 共Barker and O’Connor 1989兲.As technologies move from embryonic to emerging 共and even into later兲 stages, issues otherthan the functionality of the technology become apparent and important. For example, as thetechnology is placed into organizational settings, related issues such as security become important.For example, as expert systems emerged from the laboratories, O’Leary 共1990兲 analyzed howsecurity would become an important part of such systems if they were accepted into organizations.Research investigating the consequences—anticipated or unanticipated—of the new technologymight be initiated at this and later stages as the technology is better understood.At this stage, data can be gathered from organizational settings for empirical research共O’Leary and Turban 1987兲. However, the data is of limited application because the sample of datais biased, for a number of reasons: the technology is of the first generation, the number of adoptersis small, adopters need substantial resources because the technology has a high price, and thetechnology often must be customized to meet user needs.Behavioral research may be used to find limitations or strengths in technology use. Forexample, behavioral research can help understand a technology’s limitations from the user’s ormanager’s perspective and drive change to the second generation.Journal of Emerging Technologies in AccountingVolume 6, 2009American Accounting Association
1BY: REV: netscape@pub4/third/CLS journals3/GRP eta/JOB v6-i1/DIV 002901eta8O’LearyTABLE 3Strategic Technologies 2004–200820042005200620072008VirtualizationOpen SourceGreen ITUnifiedCommunicationsBusiness ProcessModelingWeb ServicesIP cationsPervasiveComputingVirtualizationWireless LANSInstantMessagingWider Use ofWLANsTaxonomiesNetwork Systems ManagementSoftwareTreated as aServiceStatic andUnsharedIsland, mputingGridInstant MessagingReal-Time Data WarehousingIP TelephonyUtility ComputingGrid ComputingNetwork Security TechnologiesRFID TagsNetworkSecurityConvergenceRFID TagsOLED/LEPTechnologiesLocationAwareServices essagingServiceRegistries rmationAccessWeb 2.0 AjaxRich ClientsWeb 2.0Mash-UpCompositeModelCommunitiesand tion 2.0Mash-Ups andComposite AppsWeb Platform andWOAComputing FabricReal World WebSocial SoftwareCompiled November 2008.Technologies in italics occur more than one year.AdolescentSince the technology is now in its second generation, there are fewer opportunities to addressdesign science issues. However, case studies are likely to be important as leading firms struggle toimplement the technology. Since the technology is now in its second generation, the technology isbeginning to stabilize. Further, organizations are gaining experience with the technology so thatbest practices are beginning to emerge. Accordingly, research using case studies or surveys on“things gone right” and “things gone wrong” is likely to find its way into the literature and theclassroom. For example, Barker and O’Connor 共1989兲 investigated the use of expert systems atDigital Equipment, providing insights into what was working and what were some key problems.As firms begin to adopt the technology, opinion studies become less interesting since there areactual settings in which the technology is being implemented 共O’Leary 2002兲. However, as firmsJournal of Emerging Technologies in AccountingAmerican Accounting AssociationVolume 6, 2009
1BY: REV: netscape@pub4/third/CLS journals3/GRP eta/JOB v6-i1/DIV 002901etaThe Impact of Gartner’s Maturity Curve9adopt the technology, impact studies about the actual effect of the technology gather interest.Further, survey research about the use of the technology can be developed since some firmsactually are implementing the technology.Sample bias using empirical research can emerge at this step. Some firms may be usingdifferent 共either first or second兲 generations of the technology. For example, the adoption of RFIDby Metro 共Ton et al. 2005兲 requires choosing which g
Further, there has been limited research using Gartner’s so-called “strategic technologies.” Although O’Leary 2008 initiated an analysis of AIS research from the perspective . methodologies e.g., design science are appropria