Transcription
U.S. Environmental Protection AgencyCooperative Research and Development PartnershipsSarah Roberts and Carl FulperU.S. Environmental Protection AgencyOffice of Transportation and Air QualityNational Vehicle and Fuel Emissions LaboratoryAnn Arbor, MichiganCARTEEH Transportation, Air Quality, and Health SymposiumFebruary 18-20, 2019 Austin, TX
Real-World Mobile Source Activity and Emissions Data There have been major advances over the last decade in our ability togather and manage mobile source activity and emissions data: Portable Emission Measurement Systems (PEMS) gather detailedactivity, engine, and emissions data during real-world operations Lower-cost Portable Activity Measurement Systems (PAMS) collectdetailed activity and engine data Onroad and nonroad vehicle fleets increasingly using onboardtelematics and fleet management software EPA relies on these real-world data to develop and refine mobile sourceemissions inventory models (MOVES, Nonroad): Baseline emission ratesVehicle speed profiles, age distributions, drive cyclesSpatial and temporal allocation of activity and emissionsRegional and seasonal variability in nonroad equipment usageU.S. EPA Cooperative Research and Development Partnerships Transportation, Air Quality, and Health Symposium Feb 18-20, 2019 Austin, TX2
Integrated Real-World Test DesignMobile Emissions Models Example data sources: DMV, port gate data,fleet data Population and temporal allocationDetailStatistical PowerPopulationScreened Population Remote sensing of random population of vehiclesfor days to months Emission “snap shots” to identify high emittersPAMS Hundreds of vehicles measured over several weeks tomonths in the real world Activity and temporal allocationPEMS Less than 100 vehicles measured for one day of operation inthe real world Activity, emissions, temporal allocationU.S. EPA Cooperative Research and Development Partnerships Transportation, Air Quality, and Health Symposium Feb 18-20, 2019 Austin, TX3
Leveraging Resources Collecting real-world mobile source data requires substantial investmentin equipment, data, computing, and staff Collaborating with state and local agencies, academic institutions, andprivate fleets allows EPA and its partners to leverage resources in orderto meet respective research needs Partners work together to: Develop data and testing procedures and protocols Gather data Develop new sampling methodologies Test/develop measurement equipment Enhance modeling efforts Results in a data “win-win” EPA’s support mechanisms include CooperativeResearch and Development Agreements(CRADAs), Interagency Agreements (IAGs), andcontractor supportMeasurementMethodEquipment Costs(per unit)PAMS 600 – 1,000Mini-PEMS 20,000 – 30,000PEMS 200,000 – 300,000Laboratory testing:chassis and/ordynamometer 3,000,000 EPAPARTNERSResearch/planning needsEquipmentTechnical expertiseLaboratory timeResearch/planning needsAccess to fleets/vehiclesTechnical expertiseStakeholder outreachDATAU.S. EPA Cooperative Research and Development Partnerships Transportation, Air Quality, and Health Symposium Feb 18-20, 2019 Austin, TX4
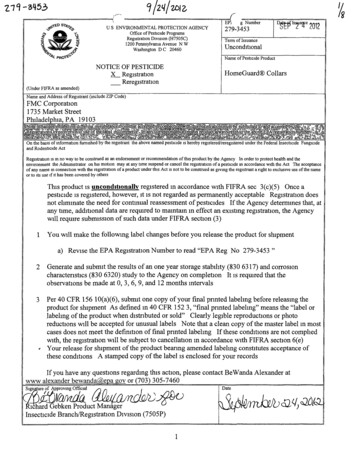
IAG: DOE National Renewable Energy Laboratory Interagency Agreement with U.S. Department of EnergyNational Renewable Energy Laboratory (Golden, CO)focused on heavy-duty vehicle activity data NREL operates the FleetDNA clearinghouse of commercialfleet vehicle operating data FleetDNA collects real-world vehicle operation data formedium- and heavy-duty commercial vehicles from avariety of locations and vocations Example use: second-by-second data from 131 long-haultrucks are being used to update hoteling assumptions andrates in MOVES Incorporating NREL FleetDNA data into MOVES willyield significantly lower hoteling rates New hoteling rates consistent with other studiesMOVES2014aNRELUC Davis (2004)U.S. EPA Cooperative Research and Development Partnerships Transportation, Air Quality, and Health Symposium Feb 18-20, 2019 Austin, TX5
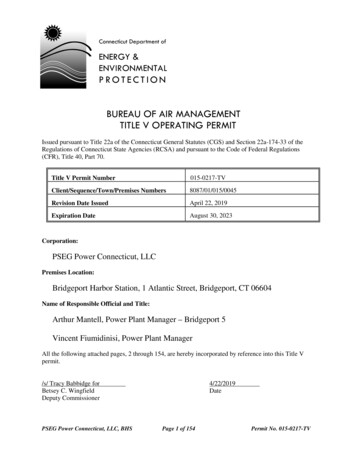
CRADA: Colorado Dept. of Public Health & Environment Ongoing CRADA with State of Colorado’s Department ofPublic Health and EnvironmentMOVES2014a NOx rates vs. Denver I/MTier 2 passenger cars, MY 2010-2016160 Data used to evaluate and adjust MOVES base emission rates MOVES rates for Tier 1 vehicles appear higher thancorresponding I/M and RSD results MOVES rates for Tier 2 vehicles appear lower thancorresponding I/M and RSD results140IM240 NOx (mg/mi) Focused on collecting light-duty emissions data in the DenverI/M area Longitudinal testing of over 100,000 Tier 1 and Tier 2vehicles Remote Sensing Device (RSD) measurements over 15years ( 100 million readings) Multiple evaporative emissions test programs120MedianMeanMOVES sim. IM2401008060402000 1 2 3 4 5 6 7 8 9 10 11 12 13 14 15 16 17 18 19 20 21 22 23 24 25Age at Test (years)For more information on evaluating MOVES with Denver I/M and RSDdata, please see: documents/03 - model evaluation.pdfU.S. EPA Cooperative Research and Development Partnerships Transportation, Air Quality, and Health Symposium Feb 18-20, 2019 Austin, TX6
CRADA: University of California, Riverside CE-CERT Ongoing CRADA with University of California, RiversideCenter for Environmental Research and Technology(CE-CERT) Supported California Air Resources Board (CARB) On-RoadHeavy-Duty Vehicle Program Instrumented MY 2010 heavy-duty trucks representingvarious vocations (e.g., concrete, refuse, delivery) withPEMS and PAMS, to collect second-by-second data Gathered over 100 engine data fields and GPS data Created an online dashboard to monitor dataloggers andvehicles, allowing for “real-time” data analysis CE-CERT/EPA CRADA will also support PEMS and PAMStesting of nonroad construction equipment ( 50 pieces), incollaboration with CARB and South Coast Air QualityManagement DistrictU.S. EPA Cooperative Research and Development Partnerships Transportation, Air Quality, and Health Symposium Feb 18-20, 2019 Austin, TX7
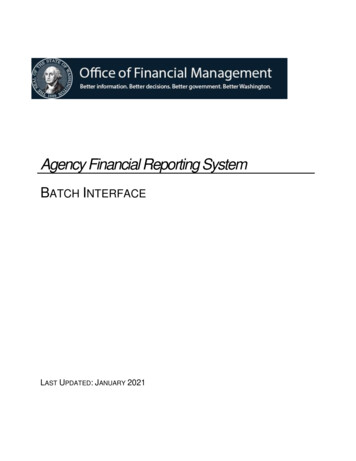
CRADA: University of California, Riverside CE-CERTDifferent vehicle speed binand time of use patternsVMT Distribution for Refuse TrucksVMT Distribution for Line-Haul TrucksSource: Boriboonsomsin, K., Johnson, K., Scora, G., Sandez, D., Vu, A., Durbin, T., et al. (2017). Collection of Activity Data from On-Road Heavy-Duty Diesel Vehicles. UC Riverside: CE-CERT.U.S. EPA Cooperative Research and Development Partnerships Transportation, Air Quality, and Health Symposium Feb 18-20, 2019 Austin, TX8
CRADA: Texas A&M Transportation Institute (TTI) CRADA with Texas A&M Transportation Institute, undertaking multiple heavy-duty vehicle projects throughout Texas PAMS installed on four Dallas Area Rapid Transit CNG busesoperating in downtown DallasEach bus sampled for 3-4 weeks ( 1,900 miles per bus)Logged detailed engine data (speed, RPM, temperatures,load, key on/off) and location (GPS)Worked with Houston-Galveston Area Council (H-GAC) to identifydrayage truck owners to participate in the studyPAMS installed on 39 new Class 8 trucks operating in the HoustonGalveston-Brazoria area; each truck was sampled for 3-5 monthsData from over 22,566 hours of operation (410,000 total miles)PAMS data supplemented with GPS data collected by H-GACAbove: PAMS logger installed on DART busPAMS installed on 15 Texas A&M University fleet busesEach bus sampled for 2-3 weeksPAMS and GPS data allow for detailed analyses of bus fleet drivecycles important for MOVESU.S. EPA Cooperative Research and Development Partnerships Transportation, Air Quality, and Health Symposium Feb 18-20, 2019 Austin, TX9
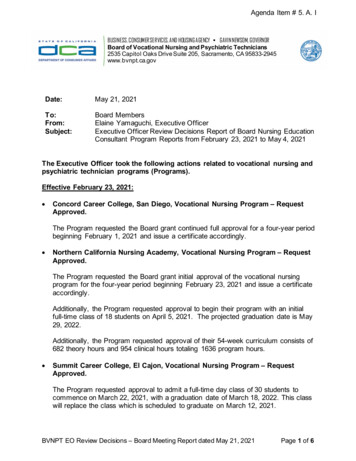
CRADA: Texas A&M Transportation Institute (TTI) TTI-EPA CRADA also focuses on nonroad (Construction) sector Working with state DOTs and private fleets to access fleet informationand telematics data Currently analyzing data from TxDOT, Caltrans, and a privateconstruction company These real-world equipment and usage data will inform thedevelopment of EPA’s updated MOVES-Nonroad emissions modelDozer activity data: hours of operation byweek and day (PAMS data from 2007)Example: Dozer Activity (hours/year)Current MOVES assumptions: Rubber Tire Dozers operate 900 hrs/year; Crawler Dozers operate 700 hrs/yearActivity is constant by equipment size (hp) and fuel typeActivity is constant over time (populations vary, but not activity levels)Activity is constant by region (same in all states, counties)U.S. EPA Cooperative Research and Development Partnerships Transportation, Air Quality, and Health Symposium Feb 18-20, 2019 Austin, TX10
Partnering with EPA EPA continues to develop tools and methodologies to further support gathering mobile source activity andemissions data partnerships are a cornerstone of this effort EPA is actively seeking partnerships to help gather better data to address current and future research needs andimprove our data analysis and modeling capabilities Contact:Sarah RobertsRoberts.Sarah@epa.govCarl FulperFulper.Carlr@epa.govU.S. Environmental Protection AgencyOffice of Transportation and Air QualityNational Vehicle and Fuel Emissions LaboratoryAnn Arbor, MichiganU.S. EPA Cooperative Research and Development Partnerships Transportation, Air Quality, and Health Symposium Feb 18-20, 2019 Austin, TX11
telematics and fleet management software EPA relies on these real-world data to develop and refine mobile source emissions inventory models (MOVES, Nonroad): Baseline emission rates Vehicle speed profiles, age distributions, drive cycles