Transcription
www.academicjournals.com
Asian Journal of Animal and Veterinary AdvancesOPEN ACCESSISSN 1683-9919DOI: 10.3923/ajava.2018.85.90Research ArticleMedicine Inventory Management by ABC-VED Analysis in thePharmacy Store of Veterinary Hospital, Yogyakarta, Indonesia1Ida Fitriana, 1Raden Gagak Donny Satria and 2Dwi Cahyo Budi Setiawan1Departement of Pharmacology, Faculty of Veterinary Medicine, Universitas Gadjah Mada, Yogyakarta, IndonesiaDepartement of Pharmacology-Veterinary Hospital, Faculty of Veterinary Medicine, Universitas Gadjah Mada, Yogyakarta, Indonesia2AbstractBackground and Objective: A good inventory control will support and accelerate the availability of drug services provided. The always,better and control (ABC) analysis, vital, essential and desirable (VED) analysis and the combination of ABC-VED analysis or ABC-VED matrixcan be used for drug supply control. This study aimed to analyze the annual medical materials expenditure and consumption usinginventory control techniques. Methodology: To prove that usefulness, a qualitative descriptive research was used in this study. Theprimary data were obtained through interviews and secondary data were obtained from pharmacy store and division of finance. Thesample was a drug used by the pharmacy store of Veterinary Hospital Prof. Soeparwi, Faculty of Veterinary Medicine, Universitas GadjahMada, during January-December, 2016. Data were analyzed with Microsoft Excel and grouped by ABC-VED analysis category.Results: The total annual drug expenditure (ADE) incurred on 191 drug items issued in 2016 was Rp. 209,342,860.58. The ABC analysisshowed that 14.14, 20.42 and 65.45% items drugs were found as always, better and control category items, respectively, amounting for69.87, 20.42 and 9.71% of ADE of the pharmacy store. The VED analysis revealed that 14.14, 69.63 and 16.23% drug items were found tobe Vital, Essential and Desirable category items, respectively, accounting for 26.10, 57.65 and 16.25% of ADE of the pharmacy store. Onthe ABC-VED matrix analysis, 25.13, 67.02 and 7.85% of drug items were found to be category I, II and III items, accounting for 74.17, 24.57and 1.26% of ADE of the pharmacy store, respectively. Conclusion: The ABC-VED analysis can be adopted in drug inventory of hospitaldrug management so that it can plan the availability of drugs efficiently the quality of patient care.Key words: ABC analysis, VED analysis, ABC-VED matrix, drug management, inventory controlReceived: August 09, 2017Accepted: October 02, 2017Published: December 15, 2017Citation: Ida Fitriana, Raden Gagak Donny Satria and Dwi Cahyo Budi Setiawan, 2018. Medicine inventory management by ABC-VED analysis in thepharmacy store of veterinary hospital, Yogyakarta, Indonesia. Asian J. Anim. Vet. Adv., 13: 85-90.Corresponding Author: Ida Fitriana, Departement of Pharmacology, Faculty of Veterinary Medicine, Universitas Gadjah Mada, Jl. Fauna No. 2, Sleman,55821 Yogyakarta, Indonesia Tel. 62 85728836789Copyright: 2018 Ida Fitriana et al. This is an open access article distributed under the terms of the creative commons attribution License, which permitsunrestricted use, distribution and reproduction in any medium, provided the original author and source are credited.Competing Interest: The authors have declared that no competing interest exists.Data Availability: All relevant data are within the paper and its supporting information files.
Asian J. Anim. Vet. Adv., 13 (1): 85-90, 2018to drug unavailability. Additionally, for example, at the end ofDecember, 2014, the availability of drugs and disposablemedical devices was expired. Therefore, the control ofpharmaceutical supplies especially drugs is very important.There are various techniques for drugs inventorymanagement, commonly used are: always, better and control(ABC) analysis, vital, essential and desirable (VED) analysis andstock card8-11. ABC analysis is a method of classifying itemsaccording to their cost. It is also known as the Paretoprinciple10,11. The analysis classifies the items into threecategories: 10-15% of the items account for approximately70% of cumulative value (category A), 20-25% are categoryB items that account for further 20% of cumulative valueand the remaining 65-70% are category C items amounting fora mere 10% of the total value10-13. The limitation of ABCanalysis is that it is based only on monetary value and cost ofconsumption of items. Some items of low monetary value arevital or life saving. Their importance cannot be overlookedsimply because they are not in category A. Therefore, anadditional parameter of assessment is their criticality by VEDanalysis. Vital pharmaceuticals items can be given valuesbased on their potential on live saving, crucial for healthservices and if it is impossible without them to safely alive andprevent death or disability of the patient. Essentialpharmaceuticals are effective against less severe butsignificant illness. Desirable pharmaceuticals are effective forminor illness and low therapeutic advantage, unavailability ofwhich will not interfere with functioning10-12. ABC-VED matrixanalysis takes both the above analysis in consideration andgives result based on economic as well as critical value ofdrugs simultaneously. It also classifies drugs into categoriesaccording to the priority of their control14. The drug inventorymanagement can bring out significant improvement inpatient care and the optimal use of resources 15.The objectives of this study were (1) To analyze theconsumption of drug items and drug procurementexpenditures in January-December, 2016, (2) To prioritizedrug procurement systems based on ABC, VED and ABC-VEDmethods and (3) To identify drug items that require greatermonitoring or supervision.INTRODUCTIONRegulations in Indonesia concerning veterinary medicalservices mention that the animal hospital is a veterinarymedical service business that provides inpatient, outpatientand emergency services. Animal hospitals as an institutionentrusted to perform services of medical veterinary coursemust provide quality services. To achieve quality services,support of health services in the hospital such aspharmaceutical supplies, food supplies, general logisticssupplies and techniques 1,2.In general, hospitals have the largest routine fees onprocurement of pharmaceutical supplies3. Various surveysshowed that the drug costs about 40-50% of the pharmaceutical service as a support service is the mainrevenue center. This is the fact that over 90% of hospitalhealth services use pharmaceutical supplies, such asmedicines, chemicals, radiological materials, consumables,medical devices and medical gases. Fifty percent of all hospitalincome comes from the management of pharmaceuticalsupplies2.Good pharmaceutical supply control is the mostimportant factor for the hospital. Careful, efficient, effective,responsible and sustainable management of the drug willhave a positive impact and will serve to increase the incomeof the hospital. Poor management can impact hospitalrevenue decline2,4. For example, an excess supply ofmedication causes requiring many capital and incurring thehigh costs. Conversely, there is a shortage of inventory impacton impaired hospital services.The present study was conducted in the pharmacy storeof Veterinary Hospital Prof. Soeparwi, Faculty of VeterinaryMedicine, Universitas Gadjah Mada (VHS). Veterinary HospitalProf. Soeparwi, Faculty of Veterinary Medicine, UniversitasGadjah Mada is a non-profit institution, veterinary hospitaleducation for prospective veterinarians and also expected toprovide the best quality of service for animal patients. Duringthe observation, drug procurement was performed based onmonthly average drug usage data, so there was oftenunexpected purchase of drugs to be hastened (cito) andpurchases to outside pharmacies. The calculation of drugstock is also problematic, namely the discrepancy of endingstock figures between physical stocks with recording donemanually or with computer system. Meanwhile, there are stillveterinarians who make prescription drugs that are notavailable in the veterinary hospital. This became one of thecauses of drug purchases to outside pharmacies. Other causesare they do not serve recipes especially for cash patients dueMATERIALS AND METHODSData collection: The research is descriptive qualitativeresearch. The study was conducted at the pharmacy store ofthe VHS. The primary data were obtained from observationsand interviews. The secondary data were obtained from thepharmacy store and finance division. The data of annual drugconsumption and expenditure incurred on each drug items ofthe pharmacy store, for the financial year 2016 were collected.86
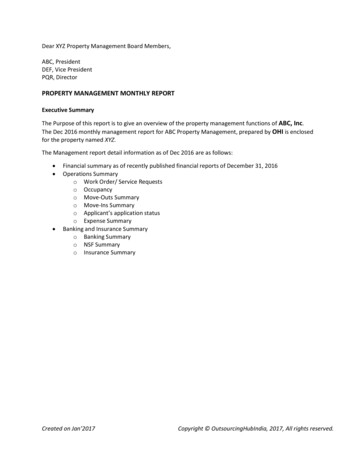
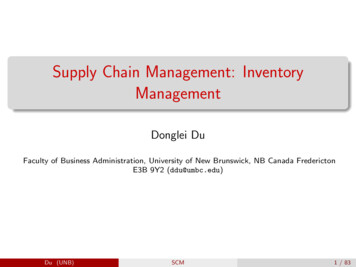
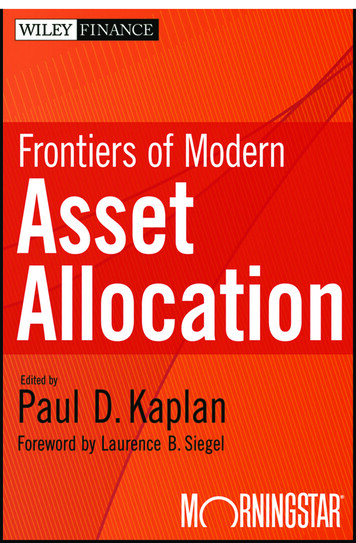
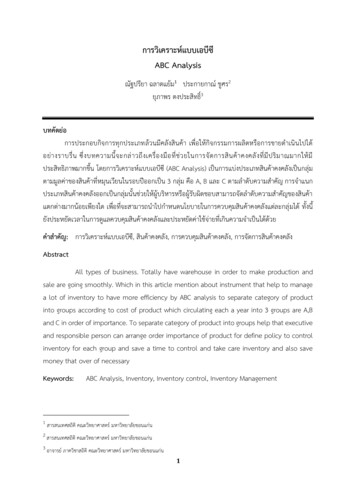
Asian J. Anim. Vet. Adv., 13 (1): 85-90, 2018category III. In these subcategories, the 1st alphabet denotedits place in the ABC analysis, while the second alphabet stoodfor its place in the VED analysis9,11.ABC analysis: The investment value is calculated by followingthe steps below: (1) Annual drug expenditure (ADE) wascalculated for the financial year 2016 by adding theexpenditure incurred on each drug items, (2) The ABC analysisof all the drugs in the inventory was done. For this, the annualexpenditure of individual drug items was arranged indescending order. The cumulative cost of all the drug itemswas calculated. As well, the cumulative percentage ofexpenditure and the cumulative percentage of number ofdrug items were calculated. Based on the cumulative costpercentage of 70, 20 and 10% from this list, they were thenrespectively subdivided into A, B and C categories 9, 11.Statistical analysis: The data were transcribed in a WindowsExcel spreadsheet6,11,16. The statistical analysis was carried outusing the MS Excel statistical functions (Microsoft Corporation,United State).RESULTS AND DISCUSSIONThe total ADE of the pharmacy store VHS on drugitems issued in January-December, 2016 was 209,342,860.58rupiah. The drug used for the hospital consisted of 191 drugitems.VED analysis: The VED criticality analysis of all the listed drugitems was conducted by classifying the drug items into vital(V), essential (E) and desirable (D) categories. The VED statusof each drug items was discussed with justification byveterinarians. Since the inventory of drugs was for the fieldpractice area, the classification of drugs into VED was carriedout keeping in mind the role and functions of a primary healthcenter. The drug items critically needed the survival, that mustbe available all the times as their non-availability can seriouslyaffect for the patient and the image of the VHS were includedin the vital (V) category. The drug items with a lower criticalityneed and those, whose shortage can be tolerated for a shortperiod at the VHS, were included in the essential (E) group.The remaining drug items with lowest criticality, the shortageof which would not be detrimental to the health of thepatients, were included in the desirable (D) group 9,11.ABC analysis: The result of ABC analysis showed that 14.14%(27), 20.42% (39) and 65.45% (125) drug items were found tobe A, B and C category items, respectively, amounting for69.87% (Rp. 146,276,108.82), 20.42% (Rp. 42,739,690.16) and9.71% (Rp. 20,327,061.60) of ADE of the pharmacy store(Table 1). The cut-offs were not exactly at 70, 20, 10% anddiffered marginally, which is permissible9,11,17.VED analysis: About 14.14% (27), 69.63% (133) and 16.23%(31) drug items were found to be V, E and D categoryitems, respectively, accounting for 26.10% (Rp. 54,641,652.28),57.65% (Rp.120,676,150.89) and 16.25% (Rp. 34,025,057.41) ofADE of the pharmacy store. The VED analysis of the presentstudy are shown in Table 1 and Fig. 1.ABC-VED matrix analysis: A matrix was formulated bycross-tabulating the ABC and VED analysis to evolve amanagement system, which can be used for prioritization.From the resultant combination, 3 categories were classified.Category I was constituted by drug items belonging to AV, AE,AD, BV and CV subcategories. Category II was constituted bydrug items belonging to BE, CE and BD subcategories. Theremaining drug items in the CD subcategory constitutedABC-VED matrix analysis: The ABC-VED matrix analysis canbe seen in Fig. 2. Nine different subcategories (AV, AE, AD, BV,BE, BD, CV, CE and CD) were observed by using this analysis.These nine subcategories were further grouped intothree main categories, categories I, II and III (Table 2). CategoryI AV BV CV AE AD 48 drug items. Category II 128 drugitems and category III 15 drug items. There were 48 (25.13%)Table 1: ABC analysis, VED analysis, and ABC-VED matrix analysis of the pharmacy store, Veterinary Hospital Prof. Soeparwi FVM UGMCategoryNumber of DrugsDrugs of (%)ADE (Rp)ADE of 1,425,727.6824.57III157.852,637,647.801.2687
Asian J. Anim. Vet. Adv., 13 (1): 85-90, 2018Table 2: ABC-VED matrix analysis of the pharmacy store, Veterinary Hospital Prof. Soeparwi FVM UGMDrug categoryNumber(%)Annual expenditure (Rp.)(%)Always (A)63.1445,638,276.0021.80Better (B)73.666,516,915.983.11Control 26.10Vital (V) CategoryEssential (E) CategoryAlways (A)157.8579,629,929.1038.04Better (B)2211.5225,843,268.2912.34Control 7.65Always (A)63.1421,007,903.7210.04Better (B)105.2410,379,505.894.96Control 16.25TotalDesirable (D) Category% indicates percentage of total drug items in drugs list or percentage of total annual drugs expenditure of the pharmacy storeCumulative (%) of annual drugexpenditure120VHS as a limited resources, it is essential that the existingresources be appropriately utilized. Provision of care issensitive to the timely availability of facilities, including drugs.In case of drugs, besides the cost factor, the criticality factormust also be taken into consideration, as it can be seen fromour study, where about 15% of the drugs consumed about70% of ADE of the pharmacy store. This is the group, requiringgreater monitoring as it has fewer drug items consuming mostof the money. It is also noted that not all the drugs in thisgroup were vital or essential. It also had drugs from thedesirable category. Categorization of drugs by the ABC-VEDmatrix analysis helps to narrow down on fewer drugs requiringstringent control.100, 10010083,77, 83,758060D4014,14, 26,120Ev0, 00020406080Cumulative of drugs (%)100120Fig. 1: Vital, essential and desirable (VED) analysis cumulativecurveCumulative (%) of annual drugexpenditure120ABC analysis: The results showed that if ABC analysis is carried100, 100100out alone for drug inventory, it would help effectively control92,15, 98.7480the recommended 27 (14.14%) drug items in the always (A)25,13, 74.17category, with almost 70% of ADE of the pharmacy store but60IIit would compromise on the availability of drug items of vitalIII40categories from B and C categories (21 drug items, 10.99%).I20The results of the study are comparable with previousresearch9,11,17,18 (Table 3).0, 00020406080Cumulative of drugs (%)100120VED analysis: The VED analysis was a need considered forideal control which can be exercised on the identified vitaland/or essential items, accounting for 83.75% of ADE of thepharmacy store. However, it is not possible to ignore thedesirable group completely because category A contained sixdrug items were desirable with 10.04% of ADE of thepharmacy. The comparison of this current study with theprevious study shown in Table 3. It showed high variation inthe percentage of vital, essential and desirable drugitems9,11,17,18. This could be because different institutes haveFig. 2: ABC-VED analysis cumulative curvedrug items in category I, 128 (67.02%) drug items in categoryII and 15 (7.85%) drug items in category III, amounting for74.17% (Rp. 155,279,485.10), 24.57% (Rp. 51,425,727.68) and1.26% (Rp. 2,637,647.80) of ADE of the pharmacy storeTable 2 and Fig. 2.Medicine inventory control in Veterinary Hospitalpharmacy is very essential8. Particularly in the pharmacy store88
Asian J. Anim. Vet. Adv., 13 (1): 85-90, 2018Table 3: Comparison of ABC analysis, VED analysis, and ABC-VED matrix analysis of previous studyDrug categoryABCVEDIIIIIIPresent study (%)DCM study, 20136 (%)PGIMER study, 20105 (%)GMCH study, 20087 (%)GMCH study, 20049 8.1229.1541.2629.59ABC: Always, better, control, VED: Vital, essential, desirable, DCM: Department of Community Medicine, PGIMER: Postgraduate Institute of Medical Education andResearch, GMCH: Government Medical College and Hospitaldifferent service profiles, depending on the specialty servicesavailable. The present analysis of medicine inventory controlwas carried out in the pharmacy store which is providinganimal health care services, particularly small animal. Whereas,the other studies have been carried out in human hospitalwith difference in level of care.The drug items of BE, BD, EC in subcategory II consist of128 (67.02%) consuming 24.57% of the ADE of pharmacystore. These drug items can be ordered once or twice a year,thereby saving on ordering cost and reducing managementhassles at a moderate carrying cost and without blockingsubstantial capital. The drug items of CD in subcategoryIII consist of 15 drug items (7.85%) consuming 1.26% of theADE. These drug items can also be ordered once or twice ayear, thereby saving on ordering cost at a moderate carryingcost and without blocking substantial capital.ABC-VED matrix analysis: The result of matrix fromcombination of the ABC and VED analysis make it possibleto focus on category I consisting 48 (25.13%) drug itemsbelonging to for strict managerial control as these drug itemsare either expensive or vital. The annual expenditure of thesedrug items was 74.17% of ADE of the pharmacy store. Thedrug items of AV, AE and BV in subcategory I consist of28 (14.65%) drug items that are expensive because they takeup 62.95% of ADE of the pharmacy store and their being outof stock is unacceptable as they are either vital or essential. Toprevent locking up of capital due to these drug items, lowbuffer stock needs to be maintained while keeping a strict vigilon the consumption level and the stock in hand. Appropriateordering method needs to be followed for these as this willeliminate the risk of drug items shortage.The drug items of CV in subcategory I consist of14 (7.33%) drug items that are drugs of low cost but highcriticality or vital and take up 1.19% of ADE of the pharmacystore. This amount is negligible. These items can be procuredonce a year and stocked as their carrying cost is low. The drugitems of AD subcategory I consist of only six drug items(3.14%) consuming 10.04% of the ADE. These drug itemsshould be monitored for economic order quality (EOQ) andtheir order placement must be made after careful study of theneed. Rational use of drug items in this subgroup, includingtheir removal from the list if possible, can bring aboutsubstantial savings without affecting patient care. Thus,standards of drug and therapeutic are urgently needed inveterinary hospitals because they are important aspects ofdrug planning and become veterinary reference in providingtherapy.CONCLUSIONThe result of this study showed that during the year 2016,Rp. 209,342,860.58 were issued by the pharmacy store ofVHS. This necessitates application of scientific inventorymanagement tools for effective and efficient management ofthe pharmacy stores, efficient priority setting, decision makingin purchase and distribution of specific drug
OPEN ACCESS Asian Journal of Animal and Veterinary Advances ISSN 1683-9919 DOI: 10.3923/ajava.2018.85.90 Research Article Medicine Inventory Management by ABC-VED Analysis in the Pha