Transcription
Case StudyGalore International Journal of Health Sciences and ResearchVol.2; Issue: 1; March 2017Website: www.gijhsr.comP-ISSN: 2456-9321An Excel-Based Inventory Control System Based on ABC and VEDAnalyses for Pharmacy: A Case StudyHacer GünerGören1, Özge Dağdeviren11Asst. Prof. Department of Industrial Engineering, Pamukkale University, Kinikli Campus, 20070, Denizli,TurkeyCorresponding author: Hacer GünerGörenABSTRACTIn today's competitive environment, businessesthat can offer products or services to users at anytime, in any quantity and quality, have greatadvantages. Especially when these businessesare vital for human health, they need to keepstaples of medicines, medical supplies and othersupport materials in sufficient quantity so thatthe service can continue without anyinterruption. Hospitals must keep drugsaccording to their cost and importance in orderto minimize inventory and holding costs. Forthis purpose, inventory control techniques areneeded in order to cut total expenses. The aim ofthis study was to determine the importance ofdrugs in a hospital’s pharmacy via ABC, VEDand ABC-VED Matrix Analyses. Based on theresults, order quantities were determined usingEconomic Order Quantity model. In order tocope with numerous drugs, an Excel-basedinventory system was built to do the analysesquickly and efficiently.Key words: Inventory management, ABCanalysis, VED analysis, ABC-VED matrix,economic order quantity, pharmacy.INTRODUCTIONOne of the most importantinstitutions that provide communityhealthcare is hospitals. Hospitals shouldkeep their services at the highest level inorder to meet expectations of patients. Likeevery sector, there is a competitiveenvironment in health sector and thiscompetition is further enhanced by legalregulations allowing the private sectorsoperate. Therefore, inputs, processes andoutputs should be checked regularly andresources should be used efficiently athospitals.Inventory at hospitals have asignificant share in total cost. As stated inKant et al. [1], about one-third of the annualhospital budget is spent on buying materialsandsupplies,includingmedicines.Therefore, hospitals need to adapt efficienttechniques for inventory control in order tocut their expenses. A savings of 1% or 2%from these costs can lead to a ility, financial performance andincrease competitive advantage. Yiğit [2]stated that inventory control analyzes andprecautions were taken in a study conductedin a 1500-bed hospital, resulted in saving20% of the cost of expensive drugs. Theability to provide the financial sustainabilityof hospital enterprises with today's highlycomplex, technological and competitivestructure can only be possible by theavailability of medical supplies andmedicines at the right location, time,quantity, quality and price. [3] In order toachieve this, an efficient materialmanagement and inventory control systemmust be adapted at hospitals.In case ofineffective inventory control, lack ofnecessary medicines and medical suppliesmay not be detected.This can lead toconsequences such as death, disability andinability to compensate and avoid damagewhich might have a negative effect onhospital’s image and lead to loss of incomein the long term. Therefore, inventorycontrol techniques should be applied.Galore International Journal of Health Sciences and Research (www.gijhsr.com)Vol.2; Issue: 1; March 201711
Hacer GünerGören et al. An Excel-Based Inventory Control System Based on ABC and VED Analyses forPharmacy: A Case StudyABC analysis is one of the mostwidely used inventory control technique. Inorder to classify drugs, researches inhealthcare systems have mostly preferredthis analysis. ABC analysis focuses on theannual consumption amount and cost inclassifying drugs. This analysis puts strictcontrol on the drugs in class A which are themost expensive among all. But importanceof class B and C however should not beoverlooked. In some cases, there might bemedicines from A, B and C in oneprescription. Short of class C drug can leadto a failure in medical treatment if it is vitalfor the illness. [4] In order to overcome thisdisadvantage, VED analyses depending onthe criticality of drugs have also beenutilized in classification at hospitals.Combining these two techniques, ABCVED Matrix has been emerged and thismatrix is the most suitable method forhospital medical materials. [5] Antonoglou etal. [6] analyzed the annual consumption andexpenditure incurred on each product at ageneral military hospital of Athens for theyear2012 via ABC and VED analyses.Another study of ABC and VED analyseswas presented by Yiğit. [7] The authoranalyzed the annual medical materialsexpenditure and consumption usinginventory control techniques. Differentclassifications were presented by variousauthors using ABC and VED analyses. [8, 9,10, 11]All these aforementioned studiesfocused only on classifying drugs via ABCand VED analyses. In this study, an Excelbased program was built to classify drugsusing ABC, VED, ABC-VED analyses anddetermine the order sizes. By using thisprogram, hospital staff can easily classifydrugs and determine order sizes quickly andcorrectly. This would help in reducingstock-out problems and total costs.The rest of the study is organized asfollows. Section two presents the materialand methods used in this study where thecase study is explained in the third section.The last section summarizes the findings ofthis study.MATERIALS AND METHODSThis case study was conducted at ahospital’s pharmacy. Using the data of year2015, drugs were classified. For ease of use,an Excel-based inventory control systemwas built. This section gives somebackground information regarding ABC andVED analyses.ABC AnalysisABC analysis is one of the mostwidely used tools in inventory control. It isbased on Pareto’s Law or “80-20 Rule”. [12]This rule, developed by Vilfredo Pareto,states that 80 % of total value is accountedby 20 % of items. Motivated by this rule,ABC analysis classifies the items ininventory in three groups as in thefollowing. Class A represents 20% of inventoryitems and 80% of inventory value. Class B represents 30% of inventoryitems and 15 % of inventory value. Class C represents 50% of inventoryitems and 5% of inventory value.According to ABC analysis, inventoryitems in Class A will be handled extensivelysince the most of the inventory valuebelongs to this group. Shortage of theseitems will result in high costs therefore; theinventory control of these items should bedone carefully. Continuous review inventorycontrol policies might be more appropriatefor this group and safety stocks should bedetermined strictly. On the other hand, nostrict rules should be applied for class B andC items. Low safety stock policy might beappropriate for class B items whereas classC items do not need to be controlledcarefully. However, these items should notbe overlooked. Especially in hospitalpharmacy, shortage of these items may leadto a failure in medical treatment which isvery important for the illness. [10]VED AnalysisVED analysis is a method that isused in control of drugs and medicalmaterials. As ABC analysis classifies itemsbased on purchasing costs, VED analysisclassifies them based on the critically ofstock items. There are three groups in VEDGalore International Journal of Health Sciences and Research (www.gijhsr.com)Vol.2; Issue: 1; March 201712
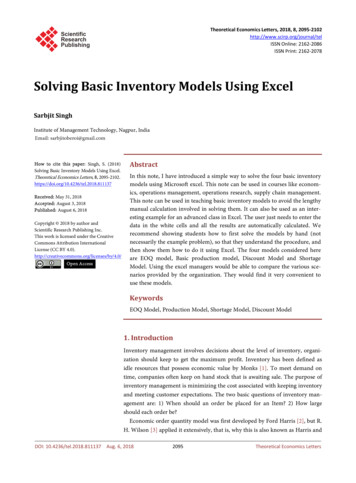
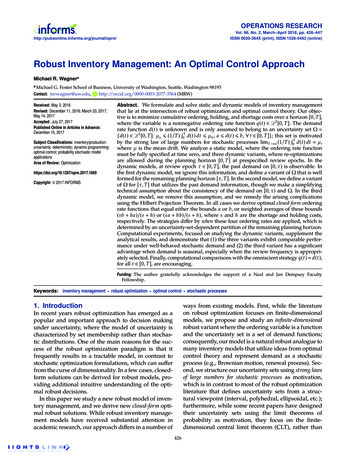
Hacer GünerGören et al. An Excel-Based Inventory Control System Based on ABC and VED Analyses forPharmacy: A Case Studyanalysis based on the basis of priority andimportance to patients’ health. [4] V (Vital): These are drugs thatpotentially involve lifesaving whichshould be available all times. E (Essential): They are significant forillnesses but less severe compared tovital drugs which may be available in thehospital. D (Desirable): These items are lowestcritically and shortages of these itemsare not detrimental to the health ofpatients. [10]The critically of each item is identifiedby a group of doctors with differentspecializations and pharmacists.ABC-VED matrix analysisThe ABC-VED matrix is formed bycross-tabulating the ABC and VED analysis.[10]Three combinations are formed from theresultant combination. It should be notedthat the first letter in this category denotesthe place of the item in ABC analysis wherethe second letter shows the place of the itemin VED analysis. 1st Category: These items are bothexpensive and critically vital forpatient’s life. They need to be monitored and controlled continuously. These itemsmight be in sub-categories namely, AV,AE, AD, BV and CV.2nd Category: The items in this group arenot as expensive as the first group or notas critically vital for patient’s life. Theseneed to be controlled periodically. Theseitems might be in sub-categories namely,BE, CE, BD.3rd Category: These items in this groupare the least expensive and vital. Theydo not need to be controlled periodically.These items might be in sub-categorynamely, CD.RESULT AND DISCUSSIONForABCanalysis,annualconsumption amount and expenditures of157 items used in 2015 were analyzed. ForVED analysis, these items were grouped byan expert in terms of their importance to apatient’s life. These data then were used informing the Excel-based inventory controlsystem. The unit purchasing cost, annualconsumption amount and groups of V, E andD were transferred to the program. Thescreenshots of the program are given in thefollowing.Figure 1.Excel-based inventory control program.Galore International Journal of Health Sciences and Research (www.gijhsr.com)Vol.2; Issue: 1; March 201713
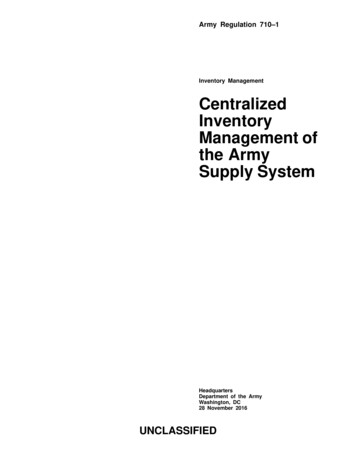
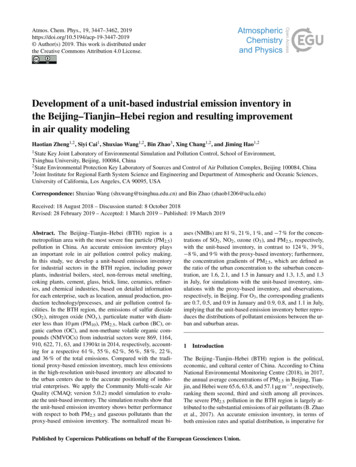
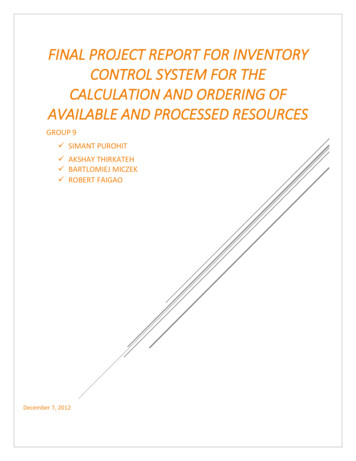
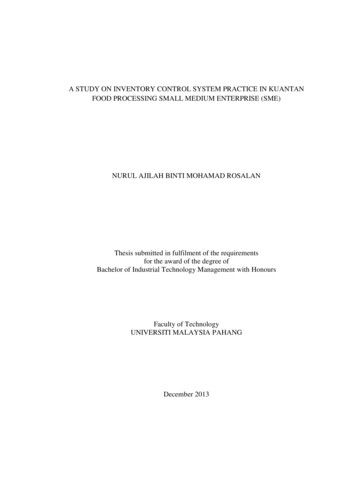
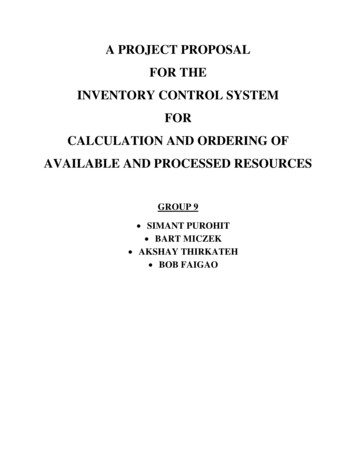
Hacer GünerGören et al. An Excel-Based Inventory Control System Based on ABC and VED Analyses forPharmacy: A Case StudyCategoryABCTotalTable1. Results of ABC AnalysisNo of Annual%ofItemsExpenditure(TL 760.167,38100%%Expenditure80%17%3%100%Table 1 presents the results of ABCanalysis regarding number and percentage ofitems, annual consumption amount andexpenditures. Figure 2 presents the resultsobtained by the Excel-based inventorycontrol program. In the program, thecumulative percentages were calculatedbased on the unit price and annualconsumption (referred as quantity in theprogram). Regarding the cumulativepercentages, drugs were classified as seenABC groups in the program.Figure2. Results of ABC AnalysisOn ABC analysis, 10 % (16), 23 %(36) and 67 % (105) items were found to beA, B and C category items, respectively,amounting for 80 % (48.167,48 TL), 17 %(10.203,04 TL) and 3 % (1.796,86 TL)(Please see Table 1 and Figure 2).The findings of VED Analysis of this studyare shown in Table 2 and Figure 4.Table 2.VED AnalysisCategoryNo ofItemsAnnualExpenditure 3.08%19.22%37.70%100%About 24.20 % (38), 14.01 % (22)and 61.78 % (97) items were found to be V,E and D category items, respectivelyamounting for 43.08% (25.921,29 TL),19.22% (11.563,71),37.70% (22.682,38) ofhospital pharmacy.Figure3. ABC Analysis cumulative curve (2015)Galore International Journal of Health Sciences and Research (www.gijhsr.com)Vol.2; Issue: 1; March 201714
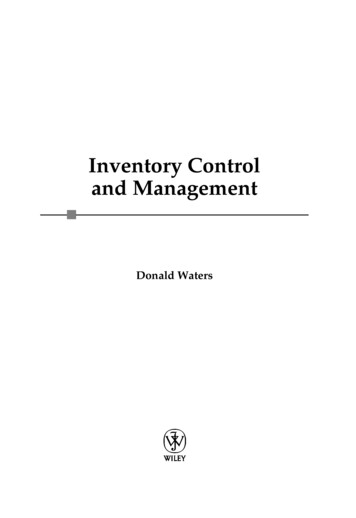
Hacer GünerGören et al. An Excel-Based Inventory Control System Based on ABC and VED Analyses forPharmacy: A Case StudyFigure 4. Results of VED AnalysisThere were 47 (29.94%) items incategory I, 39 (24.84%) items in category IIand 71 (45.22%) items in category III,amounting for84.81% (51.028,38TL),13.39% (8.054,69 TL) and 1.80%(1.084,31 TL)of the annual expenditure ofthe pharmacy, respectively (Table 3 andFigure 6).Figure5. VED Analysis cumulative curve (2015)Table 3 shows the results obtainedby ABC-VED matrix analysis. ABC-VEDmatrix reclassifies the items based on theresults of ABC and VED analyses. There arenine different subcategories (AV, BV, CV,AE, AD, BE, CE, BD and CD) in the ABCVED matrix analysis which are furthergrouped into three main categories,categories I, II and III.Table 3.ABC-VED Matrix AnalysisNo ofItems1stCategory(AV BV CV AE AD)2ndCategory(BE CE BD)3rdCategory(CD)Total% ofItems%Expenditure47AnnualExpenditure .084,3145.22%1.80%15760.167,38100%100%Figure6. ABC-VED matrix cumulative curve (2015)The items in the first category (47items) were found to be vital or expensive.Their inventory level had an important effecton the total cost therefore they needed to bemonitored continuously. The secondcategory (39 items) consists of essentialitems. These drugs were not as important asthe drugs in the first category but theyneeded to be control moderately. CategoryIII (71 items) consists of drugs which areGalore International Journal of Health Sciences and Research (www.gijhsr.com)Vol.2; Issue: 1; March 201715
Hacer GünerGören et al. An Excel-Based Inventory Control System Based on ABC and VED Analyses forPharmacy: A Case Studycheap and desirable. These drugs should begiven the least priority and purchasedperiodically.Figure7. Results of ABC-VED matrixIn the last step, the Excel-based inventory program was used to determine the ordersizes of the drugs. The Economic Order Quantity (EOQ) model was used to determine theorder sizes since the annual demands were found to be constant. EOQ is the order quantitythat minimizes the total costs including inventory holding and ordering costs. It is the mostwidely used approach in determining the order sizes when the annual demand is constant. Forfurther information regarding the EOQ, the reader can refer to Harris. [13] The quantitiesdetermined using the Excel-based program were given in Figure 8.Figure 8. Order quantities determined.Galore International Journal of Health Sciences and Research (www.gijhsr.com)Vol.2; Issue: 1; March 201716
Hacer GünerGören et al. An Excel-Based Inventory Control System Based on ABC and VED Analyses forPharmacy: A Case Study2.In Figure 8, the results of ABC,VED and ABC-VED Matri
ABC Analysis ABC analysis is one of the most widely used tools in inventory control. It is based on Pareto’s Law or “80-20 Rule”. [12] This rule, developed by Vilfredo Pareto, states that 80 % of total value is accounted by 20 % of items. Motivated by this rule, ABC analysis classifies the items in