Transcription
(2021) 21:137Wang et al. BMC Oral SEARCH ARTICLEOpen AccessDental caries thresholds among adolescentsin England, Wales, and Northern Ireland,2013 at 12, and 15 years: implicationsfor epidemiology and clinical careXiaozhe Wang1* , Eduardo Bernabe2, Nigel Pitts3, Shuguo Zheng1and Jennifer E. Gallagher4*AbstractBackground: Dental caries is the most prevalent condition globally. Despite improvements over the past few decades, there remains a significant disease burden in childhood. Epidemiological surveys provide insight to disease patterns and trends, and have traditionally focused on obvious decay which are inconsistent with contemporary clinicalcriteria. This study examined the distribution of dental caries in 12- and 15-year-olds in England, Wales and NorthernIreland, by severity threshold, at surface, tooth and child level and explored its association with socioeconomic, psychological and behavioural factors.Methods: Data from 12- and 15-year-olds in the 2013 Children’s Dental Health Survey (CDHS 2013) were analysedat three levels, taking account of dental caries thresholds which involved recording both clinical decay [visual enamelcaries (AV) and above] and obvious decay [non-cavitated dentine lesions (2V) and above]. Negative binomial regression was used to identify factors associated with dental caries experience at both thresholds.Results: The prevalence and severity of dental caries experience was higher among 15-year-olds at all levels. Visualchange in enamel (AV) was by far the most common stage of caries recorded in both ages. The average number ofsurfaces with obvious decay experience, which has been the traditional epidemiological threshold, in 12- and 15-yearolds was 2.3 and 3.9 respectively. The corresponding values under the clinical decay threshold were higher, at 3.9 and5.9 respectively. Visualisation of the distribution of dental caries at surface/tooth-level exhibited horizontal symmetryand to a lesser extent vertical symetry. In the adjusted models for both ages, country/region, school type, area deprivation, high frequency sugar consumption and irregular dental attendance were associated with greater caries experience in both groups. Dental anxiety was inversely associated with caries experience among 15-year-olds.Conclusion: This research highlights the importance of recognising dental caries patterns by surface, tooth andchild-level amongst adolescents and the value of reporting dental caries distribution by threshold in epidemiological*Correspondence: neptunewxz@163.com; jenny.gallagher@kcl.ac.uk1Department of Preventive Dentistry, Peking University Schooland Hospital of Stomatology & National Clinical Research Center for OralDiseases & National Engineering Laboratory for Digital and MaterialTechnology of Stomatology & Beijing Key Laboratory of DigitalStomatology, 22 Zhongguancun South Avenue, Haidian District,Beijing 100081, PR China4Faculty of Dentistry, Oral and Craniofacial Sciences, King’s CollegeLondon, Bessemer Road, London SE5 9RS, UKFull list of author information is available at the end of the article The Author(s) 2021. Open Access This article is licensed under a Creative Commons Attribution 4.0 International License, whichpermits use, sharing, adaptation, distribution and reproduction in any medium or format, as long as you give appropriate credit to theoriginal author(s) and the source, provide a link to the Creative Commons licence, and indicate if changes were made. The images orother third party material in this article are included in the article’s Creative Commons licence, unless indicated otherwise in a credit lineto the material. If material is not included in the article’s Creative Commons licence and your intended use is not permitted by statutoryregulation or exceeds the permitted use, you will need to obtain permission directly from the copyright holder. To view a copy of thislicence, visit http:// creat iveco mmons. org/ licen ses/ by/4. 0/. The Creative Commons Public Domain Dedication waiver (http:// creat iveco mmons. org/ publi cdoma in/ zero/1. 0/) applies to the data made available in this article, unless otherwise stated in a credit line to the data.
Wang et al. BMC Oral Health(2021) 21:137Page 2 of 14surveys, including its relevance for clinical care. Inclusion of enamel caries reveals the extent of caries managementrequired at a point when non-invasive care is possible, emphasising the importance of prevention through contemporary primary care, which includes supporting self-care.Keywords: CDHS 2013, Dental caries, Distribution, Threshold, Risk factorsBackgroundDental caries is the most common disease in the oralcavity globally [1]. A decline in caries experience measured by the decayed, missing and filled (DMFT/S)index has occurred in high-income countries over thepast five decades [2–5]. Remarkably, neither the prevalence nor incidence of untreated caries in permanentteeth has changed between 1990 and 2015 in all agesglobally [1, 6, 7].Several studies have reported that enamel or noncavitated caries lesions contribute much of the totalcaries prevalence in different populations and may bean indicator to help assess the risk status of an individual [8–10]. Recognising the process of dental cariesdevelopment, and progression, clinical indices such asInternational Caries Detection and Assessment System(ICDAS) [11–14], helpfully map the profile of disease atindividual level, recognising the importance of shiftingfrom a restorative-approach towards early non-invasivemanagement of disease [15, 16]. However, the totalpicture of the caries distribution including all stagesof lesions among school-aged children in the UnitedKingdom (UK) has not been examined before.The 2013 Children’s Dental Health Survey (CDHS2013), commissioned by the Health and Social CareInformation Centre, is the fifth in a series of nationalsurveys of children’s oral health within the UK.Informed by ICDAS, enamel caries was recorded bothat visual (non-cavitated) and cavitated level for thefirst time in this series of national surveys in 2013. Thisrevealed that whilst just 34% of 12-year-olds and 46%15-year-olds had obvious decay experience (non-cavitated lesions into dentine and above), 57% and 63% ofthem respectively had clinical decay experience whenearly caries (non-cavitated enamel caries and above)was included [17, 18]. Understanding the pattern ofdisease is fundamental to good contemporary dentalcaries management which involves early identificationand managing the risk of further disease [1, 19].The aims of this study were to examine the distribution of dental caries across a range of lesion-severitythresholds in 12- and 15-year-old children in England,Wales and Northern Ireland, at surface, tooth and individual levels, and explore its association with socioeconomic, psychological and behavioural factors.MethodsStudy population and data collectionThis study involved secondary analysis of cross-sectionaldata from the CDHS 2013, collected in line with the published methodology [20, 21]. Three of the four nations ofthe UK, England, Wales, and Northern Ireland participated in this survey. A representative sample of eligible12- (n 2,532) and 15-year-olds (n 2,418) from secondary schools in England, Wales and Northern Ireland wasexamined [17]. Pupils in two countries (Wales, NorthernIreland) and in more deprived schools were oversampledto facilitate reporting by country and relative deprivation[20]. Pupils were invited to complete a questionnaire survey at the same appointment exploring a range of issuesincluding their self-rated health, oral symptoms andproblems, impact of dental health on the quality of life,behavioural habits and psychological status [20], and ahigh response of 99.6% was achieved [17].Dental examinations were undertaken in school settings by 75 trained and calibrated dentists. Trainingincluded pre-learning with a dedicated e-Learning programme and intensive lecture and in vivo sessions conducted in both classroom and school survey settings.Examiner calibration was conducted in 8 groups, andmeasured by calculating kappa scores, resulting in moderate to very good agreement on dental caries diagnosis[20]. Consent for the dental survey involved a decisionto ‘opt-in’ by children on the day, with the possibility forparental ‘opt-out’ in advance. Visual examination wascarried out using a plane mouth mirror and ball endedCPITN probe (WHO ball-ended probes) after drying with cotton wool/gauze; no radiographs were used[20]. Dental caries is a progressive and conceptuallystaged disease. In support of early detection of cariouslesions, visual change in enamel was recorded as cariesfor the first time in the 2013 CDHS survey. The criteriaused were consistent with the ICDAS [13, 14, 17]. Caries assessment was undertaken by surface and coded asfollows: sound (including any sub-clinical decay); visualchange in enamel (CDHS AV): ICDAS 1 and 2; visualenamel change with cavitation (CDHS AC): ICDAS 3;visual dentine caries (non-cavitated, CDHS 2V): ICDAS4; cavitated dentine caries (CDHS 2C); and decay withpulpal involvement (CDHS 3): ICDAS 5 and 6. In addition, filled with recurrent decay (with/without cavitation), filling needs replacement, sound fillings (F), and
Wang et al. BMC Oral Health(2021) 21:137extracted due to caries (M) were also recorded [17, 20].Dental caries activity was not assessed. Two visual detection thresholds were used to assess caries status in thisresearch, which were presented as clinical decay (CDHSAV and above), and obvious decay (CDHS 2V and above).Decay experience in terms of these criterion includescurrently and previously decayed teeth/surfaces, andwere reported as DAVMFT/S, D2VMFT/S respectively. Allmethods in the study were carried out in accordance withthe Helsinki guidelines and declaration.Data managementKey sociodemographic factors were included in thisanalysis as potential confounders [7, 22]. Sex (male/female) and ethnicity (white/non-white) were treated asdichotomous variables. Government Office Region was a11-category variable, constituted by nine regions in England, plus the two countries of Wales, and North Ireland.School type was grouped into three categories: independent, secondary and academy or free school. There weretwo indicators for family and contextual socioeconomicstatus used within the analysis. One was free school mealeligibility, a statutory benefit only provided to disadvantaged pupils in maintained schools, academies, and freeschools. The other was the IMD score (Index of MultipleDeprivation) based on indicators of distinct dimensionsof deprivation categories, by quintile, for each country onthe basis of the overall score [23–25].Toothbrushing frequency was reported as a binary categorical variable (twice a day or more versus once a dayor less). Consideration of frequency of sugar intake—involved aggregating reported daily consumption of several common sugary foods and drinks (sweets, biscuits,cakes, fruits, soft drinks that contain sugar, energy/sportsdrinks, and fruit juice or smoothies) into a total score,which was recategorised into a binary variable (less thanfour times a day or four or more times a day). Becauseonly 2.41% of participants reported having “never been tothe dentist”, the reason for usual dental attendance wasdichotomized into regular (for a check-up) versus all therest which is irregular (only when have trouble)/none.The Modified Dental Anxiety Scale (MDAS) was firstintroduced to CDHS in 2013. It consists of 5 questions,each with a 5-category rating scale, ranging from ‘notanxious’ to ‘extremely anxious’. The self-rated dental anxiety score was grouped into three categories for analysis(5–9 indicating low/no anxiety, 10–18 representing moderate anxiety, and 19–25 as extreme anxiety).Statistical analysisFirst, we calculated the distribution and composition ofdifferent stages or thresholds of dental caries (clinical andobvious decay) across the permanent dentition at surface,Page 3 of 14tooth, and child level for 12- and 15-years-olds. Second,the characteristics of participants according to relevantsocio-demographic factors, behavioural and psychological factors were examined. The distribution of excludedpupils was compared with research samples in relevantvariables by using Chi-square test to evaluate the impactof missing data. Complex survey design (stratificationand clustering) was taken into consideration by usingNegative binomial regression [20]. Third, to test the association between dental behavioural, psychological factorsand caries experience ( DMFSAV/2V index), an unadjustedmodel and an adjusted model were successively builtusing negative binomial regression. The association oftoothbrushing frequency, frequency of sugar intake,usual dental attendance, and dental anxiety with dentalcaries experience (DAV/2VMFS) were estimated. Potentialconfounders including demographic status were introduced into the model to make an adjusted estimation.Rate ratios (RRs), 95% confidence intervals (95% CI) andlevel of significance were reported and compared in allmodels. All analyses were conducted using Stata/SE 15(StataCorp LLC, College Station, TX). P 0.05 was considered as statistically significant.ResultsThe distribution of dental caries in the permanent dentition was presented at surface, tooth, and child-level,by caries stage/threshold, for both ages examined inthe national survey (Tables 1, 2). At all three levels, theprevalence and average number of surfaces or teeth withdental caries experience was higher in 15-year-olds compared with 12-year-old children.When considering obvious decay, the average number of decayed surfaces in 12- and 15-year-olds was only0.99 and 1.16, respectively. The volume of recorded disease was higher when using the clinical decay threshold (which incorporated enamel caries) up to 2.74times higher in 12- and 15-year-olds at 2.60 and 3.18,respectively.The findings revealed that 3.32% of surfaces and 9.62%teeth in 12-year-olds, and 4.94% surfaces and 13.56%teeth in 15-year-olds had clinical decay experience (DAVMFS/T). 41% of the surfaces and 50% of teeth withdecay-experience were enamel caries in 12-year-olds,while these proportions were lower in 15-year-olds at32% and 41% respectively. Past decay experience, managed through extractions and fillings (missing or filledteeth), occupied a larger portion of decay experience inboth age groups. It is important, therefore, to recognisethe dramatic finding that by far the most frequent “stage”of lesions encountered in 12- and 15-year-olds was visualenamel caries (AV).
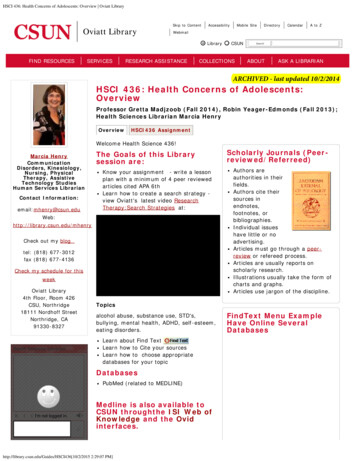
Wang et al. BMC Oral Health(2021) 21:137Page 4 of 14Table 1 Dental caries distribution at surface, tooth and child levels amongst 12-year-oldsa,bDistribution according to CDHS 2013 codeSumSound dTooth levelcSurface level%Mean/childS.DSumChild 611570.390.461.428191.250.320.901746.87Code 2C-cavitated dentin caries7430.250.291.145150.790.200.702218.73Code 3-decay with pulpal led with recurrent 20100.0065,592100.00Code AV-visual change in enamelCode AC-enamel change with cavitationCode 2V-visual dentine cariesFilling needs replacement, no decaySound fillingMissing due to decayTotala1295.092532100.00Counts and proportions are unweightedb2013 Children’s Dental Health Survey included England, Wales, and Northern IrelandcCodes at tooth and child level represent the worst code in each tooth and childdIncluding sub-clinical decay and lesions seen only on radiographsTable 2 Dental caries distribution at surface, tooth and child levels amongst 15-year-oldsa,bDistribution according to CDHS 2013 codeSumSounddCode AV-visual change in enamelCode AC-enamel change with cavitationCode 2V-visual dentine cariesTooth levelcSurface level%Mean/childS.DSumChild 13190.430.551.509591.430.401.032375.05Code 2C-cavitated dentin caries7640.250.321.205410.800.220.741927.94Code 3-decay with pulpal led with recurrent 030.24340.050.010.13100.58Filling needs replacement, no decaySound sing due to 1100.0067,221100.002418100.00TotalaCounts and proportions are unweightedb2013 Children’s Dental Health Survey included England, Wales, and Northern IrelandcCodes at tooth and child level represent the worst code in each tooth and childdIncluding sub-clinical decay and lesions seen only on radiographsDental decay prevalence by stage is presented visuallyby at tooth and surface in Fig. 1 and Additional file 1:Appendix 1 respectively. Occlusal surfaces of all molars,buccal surfaces of lower first molars, and then smoothsurfaces of upper first molars and buccal surfaces oflower second molars were most likely to be attacked bydental caries. The level of dental caries experience washigher in 15-year-olds, most notably in first and secondmolars. Caries prevalence amongst lower anterior andupper canine teeth remained low.Overall, there was generally horizontal (right/left) symmetry, and to a lesser extent, vertical (upper/lower) symmetry. First molar teeth, which had been longest in theoral cavity exhibited comparable clinical decay prevalence of 35–39% across the four quadrants in 12-yearolds, rising to between 42 and 46% in 15-year-olds. Therewas little difference observed between upper/lower orleft/right dentitions, merely more teeth extracted dueto decay in 15-year-olds. Second molars in same dentition on both sides of the dental arch shared similar decay
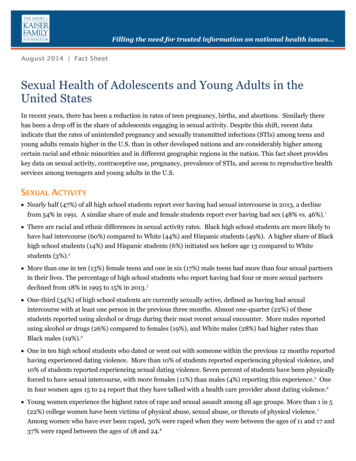
Wang et al. BMC Oral Health(2021) 21:137Page 5 of 14Fig. 1 Distribution of dental caries by tooth amongst 12- and 15-year-oldsa. aA representative sample of eligible 12- (n 2532) and 15-year-olds(n 2418) from 2013 Children’s Dental Health Survey in England, Wales and Northern Ireland was involvedstatus with the prevalence of clinical decay experiencewhilst maxillary decay was lower and milder than mandibular in both age groups. Amongst pupils aged 12 yearswho had decayed lower second molars, only 47% ofthem had decayed upper second molars, this proportionincreasing to 68% in 15-year-olds (Fig. 1).The distribution of clinical and obvious decay exhibited marked differences amongst the 12- and 15-yearold populations as shown in Fig. 2. The average numberof surfaces suffered from obvious decay experiencewas 2.3 in 12-year-olds and 3.9 in 15-year-olds, thenthis rose to 3.9 in 12-year-olds and 5.9 in 15-year-olds,Fig. 2 Frequency distribution of DMFS score by clinical and obvious decay threshold of 12- and 15-year-oldsa,b. aClinical decay threshold (DAVMFS)represents CDHS AV and above. Obvious decay threshold (D2VMFS) represents CDHS 2 V and above. bCounts, proportions and means areunweighted
Wang et al. BMC Oral Health(2021) 21:137when the clinical decay threshold including enamel caries was considered.The multivariate analysis involved 1964 12-year-oldand 1963 15-year-old pupils with complete data for allrelevant variables to further explore associated factorswith clinical and obvious decay experience. The characteristics of children at both ages are presented in Table 3.Behavioural and psychological factors involved in thisanalysis, including toothbrushing frequency, sugar intakefrequency, dental attendance and dental anxiety weresignificantly associated with clinical and obvious decayexperience in the unadju
land, plus the two countries of Wales, and North Ireland. School type was grouped into three categories: independ - ent, secondary and academy or free school. ere were two indicators for family and contextual socioeconomic status used within the analysis. One was free school meal