Transcription
(2020) 20:338Ravaghi et al. BMC Oral en AccessRESEARCH ARTICLEChildhood obesity and dental caries:an ecological investigation of the shapeand moderators of the associationVahid Ravaghi1* , Amir Rezaee2, Miranda Pallan3 and Alexander John Morris1AbstractBackground: Despite sharing a common risk factor in dietary sugars, the association between obesity and dentalcaries remains unclear. We investigated the association between obesity and dental caries in young children in England in an ecological study.Methods: We analysed data from 326 lower tier English local authorities. Data on obesity and dental caries wereretrieved from 2014/15 to 2016/17 National Child Measurement Programme and 2016/17 National Dental Epidemiology Programme. We used fractional polynomial models to explore the shape of the association between obesity anddental caries. We also examined the modifying effect of deprivation, lone parenthood, ethnicity, and fluoridation.Results: Best fitting second order fractional polynomial models did not provide better fit than the linear models forthe association between obesity and prevalence and severity of dental caries; therefore, the linear model was foundsuitable. Despite significant association, after adjusting for the effect of deprivation, obesity was neither associatedwith prevalence (coefficient 0.2, 95% CI 0.71, 0.75), nor with severity (coefficient 0.001, 95% CI 0.03, 0.03) ofdental caries. In fully adjusted models, the proportion of white ethnicity and being in fluoridated areas were associated with a decrease in dental caries. The association between obesity and dental caries was moderated by the effectof deprivation, white ethnicity, and lone parenthood.Conclusions: The association between obesity and dental caries was linear and moderated by some demographicfactors. Consequently, interventions that reduce obesity and dental caries may have a greater impact on specificgroups of the population.Keywords: Obesity, Decay, Children, TeethIntroductionChildhood obesity is one of the most serious global public health challenges, with mean Body Mass Index (BMI)increasing globally in past decades in most regions [1].Children with overweight and obesity are at greater riskof obesity in adulthood and developing related conditionssuch as diabetes and cardiovascular diseases at a younger*Correspondence: V.Ravaghi@bham.ac.uk1School of Dentistry, University of Birmingham, 5 Mill Pool,Birmingham B5 7EG, UKFull list of author information is available at the end of the articleage [2]. Despite a declining prevalence seen in westernised high income countries, dental caries also continuesbe an important global public health problem [3]. In England, around a quarter of children aged 4 to 5 years ofage are living with overweight or obesity [4] and a similarproportion (23%) of children aged 5 years have experienced dental caries [5]. Like obesity, dental caries has ahigh impact on individuals and health services, for example the majority of admissions to hospital for children inEngland in the period 1997–2006 were primarily due todental caries [6]. In England, both obesity and dental caries share a pro-poor association with social deprivation, The Author(s) 2020. Open Access This article is licensed under a Creative Commons Attribution 4.0 International License, whichpermits use, sharing, adaptation, distribution and reproduction in any medium or format, as long as you give appropriate credit to theoriginal author(s) and the source, provide a link to the Creative Commons licence, and indicate if changes were made. The images orother third party material in this article are included in the article’s Creative Commons licence, unless indicated otherwise in a credit lineto the material. If material is not included in the article’s Creative Commons licence and your intended use is not permitted by statutoryregulation or exceeds the permitted use, you will need to obtain permission directly from the copyright holder. To view a copy of thislicence, visit http://creat iveco mmons .org/licen ses/by/4.0/. The Creative Commons Public Domain Dedication waiver (http://creat iveco mmons .org/publi cdoma in/zero/1.0/) applies to the data made available in this article, unless otherwise stated in a credit line to the data.
Ravaghi et al. BMC Oral Health(2020) 20:338with children from more deprived backgrounds being atgreater risk [4, 5].Dietary intake is a risk factor for both dental caries andobesity; as a result, it is believed that modifying dietarypractices may be an effective intervention to reduce bothdental caries and obesity [7]. This approach has been oneof the pillars of dental health policy in England [8] andassumes that dental caries and obesity in children areassociated and share common risk factors. While somesystematic reviews found no association [9, 10], twosystematic reviews found some evidence in favour of anassociation under specific conditions [11, 12]. For example, Hayden and colleagues reported a significant association between children obesity and dental caries only inindustrialised countries [12]. Others reported an association at around the age of 5 to 9 years but not in youngerchildren [11].Reducing sugar consumption among children is now amajor health policy in England, seeking to achieve 20%reduction in children consumption of sugar by 2020; themain driver of this policy is childhood obesity prevention [13]. With sugar being labelled as the ‘single cause’of dental caries [14], these policies are likely also to influence dental health. A policy document titled “Sugarreduction: the evidence for action”, which outlines sugarreduction policies in England, has estimated that nearlya quarter a million cases of dental caries will be avoidedfollowing a 5% reduction in energy intake from sugar[15].A better understanding of the nature of the associationbetween childhood obesity and dental caries will help topredict the impact of current policies on the prevalenceof dental caries and childhood obesity. Therefore, thisstudy aims to investigate, from a new perspective, theassociation between dental caries and obesity amongyoung children. We set out to examine the shape of theassociation between obesity and dental caries; whetherit is linear or non-linear. Secondly, we aimed to explorewhether this association varies by other characteristics ofthe population: deprivation, ethnicity, proportion of loneparents and living in a fluoridated area.MethodsData for this study were retrieved from both survey andadministrative data sources. Data on dental caries forEnglish lower tier local authorities (LA) were retrievedfrom the 2016/17 oral health survey of 5-year-old children. The detailed findings of this survey has been previously reported [5]. Dental caries in each LA was indicatedby its prevalence and severity. The proportion of childrenwho had experienced dental caries in each LA indicatedprevalence and the mean number of decayed, missingand filled teeth (dmft) indicated severity.Page 2 of 7Average prevalence of obesity among children inreception class (age 4–5 years) in each local authorityfor the years 2014/15 to 2016/17 was retrieved fromthe National Child Measurement Programme (NCMP)[16]; in which the obesity was defined as children witha body mass index (BMI) greater than or equal to the95th centile of the British 1990 growth reference BMIdistribution have been classified as obese. Deprivation status of LAs was determined using by the average scores for deprivation as reported in the 2015 Indexof Multiple Deprivation [17]. Percentages of lone parents with dependent children and white ethnicity (English/Welsh/Scottish/Northern Irish/British) in eachLA were retrieved from the latest UK census whichwas carried out in 2011 [18]. The number of childrenattending NHS dentists in each LA were obtained fromNHS Digital Statistics through a Freedom of Information request. Dental attendance of children aged 0–5was calculated using the number of 0–5 year old children seen by the end of June 2017 and the 2016 midyear population and was obtained through freedom ofinformation request [19]. Local authorities where someof the population receive a water supply with adjustedfluoride levels were identified from the 2018 Public Health England (PHE) report ‘Water fluoridation;Health monitoring report for England’ [20].To explore the shape of the association between dentalcaries and obesity, we tested the null hypothesis of linearity against alternative regression functions and selectedthe best fitting model. In doing so, we used fractional polynomial regression models. This technique, proposed byRoyston and Sauerbrei [21], evaluates whether the effectof a continuous variable (i.e. obesity rate) on the outcome(i.e. prevalence of dental caries) is better modelled by anonlinear fractional polynomial (FP) function. FPs are ofthe form:Y B0 B1 · Xp1 B2 · Xp2 · · ·where p1, p2, are selected from default set of powers { 2, 1, 0.5, 0, 0.5, 1, 2, and 3} with 0 signifyinglogarithm of variable. In this formula, Y represents thedental caries outcome (e.g. Mean dmft score), B0 is theintercept, and X represents prevalence of obesity. The B1and B2 coefficients capture the effect of first and secondorders for deprivation ranking, respectively. Conventionally, fractional polynomial models that involve two terms(i.e. first and second orders) are assumed to be adequatefor identifying the best fit [22]. Therefore, we fitted 44models for each dental caries outcome with the combinations of powers fitted; out of those we reported thestatistical estimates for the linear model and first order(m 1) and best fitting second order models (m 2) forthe abovementioned default set of powers:
Ravaghi et al. BMC Oral Health(2020) 20:338Page 3 of 7Dental caries B0 B1 Obesityp1 B2 Obesityp2We selected the best fit model between selected models based on the algorithm suggested by Royston and Altman [22] which estimates the deviance where deviance isdefined as twice the negative log likelihood. In addition todeviance, we reported the estimates of the residual standard errors and the p values for the partial F test comparing models’ deviance. As such, we initially comparedthe best fitting second order model (m2) with the linearmodel; if this did not provide a statistically better fit, thelinear model was selected. Otherwise, the best fitting second order model (m2) was compared with the best fitting first-order model (m1). The best fitting second ordermodel (m2) was preferred to first order model (m1) onlyif it provided a statistically better fit; otherwise, the firstorder model (m1) was selected. This approach allowed usto choose the simplest as well as best fitting model [23].We used the STATA ‘fracpoly’ command to produce andcompare fractional polynomial models.To address the second objective of this study, we addedinteraction terms to final regression models in order toestablish whether the association between obesity anddental caries varies according to other characteristicssuch as: deprivation, ethnicity, and lone parenthood, andliving in fluoridated area. We estimated average marginaleffects after adjusting for other covariates.ResultsWe analysed data for 303 out of 326 lower-tier LAs asthese had data on dental caries. Descriptive statisticshave been reported in Table 1. When we fitted the linearmodel for both prevalence and severity of dental caries,obesity explained 26% of the variation for prevalence ofdental caries and mean dfmt. We then fitted additionalmodels with quadratic and cubic terms to permit one andtwo bends in the association between both dental cariesoutcomes and obesity. The R-squared showed a marginalincrease (less than 1%) for either of quadratic and cubicmodels; therefore, these models did not provide an evidence for departure from linearity (data not shown).Table 2 demonstrates the estimates from fitting firstand second order polynomials. Values of ‘deviance difference’ for linear and first order model (m 1) representthe extent to which second order model (m 2) is, comparatively, a better fit. Examining the shape of the association between prevalence of dental caries and obesity,the best-fitting first-order (m 1) polynomial model hadTable 1 Descriptive statisticsVariableMeanaNMean dmft score (decayed, missing, filled teeth)302Prevalence of dental caries (% d3mft 0)302bStd. DevRange0.70.4(0.1, 2.3)21.78.7(4.4, 49.4)Index of multiple deprivation (average score)32419.58.0(5.0, 42.0)Obesity (%)3248.91.7(4.2, 13.7)Lone parenthood in population (%)3246.61.7(4.0, 14.4)White population (%) (English/Welsh/Scottish/Northern Irish/British)32484.316.4(16.7, 97.6)Dental attendance rate32445.98.5(19.5, 68.7)Fluoride (0 not fluoridated; 1 fluoridated)324N/AN/A(0, 1)aThese estimates do not take into account population weight. Therefore, they do not represent national estimates in other official reportsbIn total, 303 LAs participated in the survey but data from one LA (city of London) were merged with another LA (Hackney)Table 2 Comparison of linear and non-linear fractional polynomial regression models for dental cariesDegree of freedomDevianceRes. SDDeviance differencep valuesPowersPrevalence of dental caries (% d3mft 0)Linear12066.517.431.750.6271m 122066.337.431.570.460.5m 242064.767.42––Linear1192.230.331.570.6691m 12192.230.331.570.46114190.660.33–Mean dmft score (Decayed, missing, filled teeth)m 2– 2, 1 2, 1
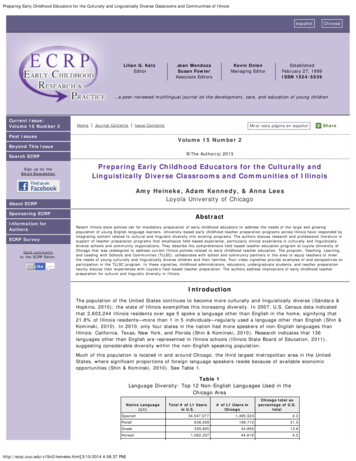
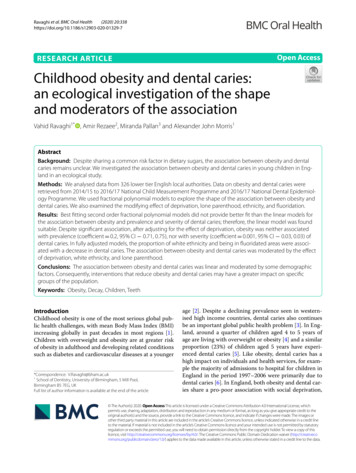
Ravaghi et al. BMC Oral Health(2020) 20:338a power 0.5 for obesity, whereas the best-fitting secondorder polynomial (m 2) had powers ( 2 1). However, the second order model was not significantly betterin terms of model fit to data than the linear model (deviance difference 1.75, p 0.627) or the first order model(m 1) (deviance difference 1.57, p 0.46). For meandmft scores, the best fitting first and second order polynomials had powers 1 and ( 2 1), respectively. Again,there was no statistically significant difference to justifyusing fractional polynomial models, as they did not haveany better fit than a simple linear model. As fractionalpolynomial models had no better fit than a simple linearmodel, we therefore selected linear models for final analyses. The scatterplot and the best fitting linear regressionline are displayed in Fig. 1.Table 3 shows the results of the linear regressionmodels adjusted for covariates. While obesity wasdirectly related to indicators of dental caries in theunadjusted linear regression model (model 1), it wasneither associated with prevalence (coefficient 0.2,95% CI 0.71, 0.75), nor with severity (coefficient 0.001, 95% CI 0.03, 0.03) of dental caries inmodel 2 which was adjusted for the effect of deprivation. When we adjusted the model for the effect of allcovariates (model 3), the coefficient of obesity remainednon-significant; while greater deprivation and dentalattendance were associated with higher prevalence ofFig. 1 Dental caries and prevalence of obesity in English local authoritiesPage 4 of 7dental caries and mean dmft. In addition, the dentalcaries outcomes were inversely related to proportion ofwhite ethnicity and being in fluoridated area.To assess the effect of modifying variables, we addedthe interaction terms to final models. For the prevalence of dental caries, there was significant interaction between obesity and three covariates: deprivation(p 0.023), white ethnicity (p 0.001), and lone parenthood (p 0.001). For mean dmft score, interactioneffect was significant for two covariates: white ethnicity(p 0.001) and lone parenthood (p 0.008). The interaction effect between obesity and fluoridated area was notsignificant for either indicator of dental caries. Table 4shows the marginal effects of dental caries outcomes fordifferent values of moderators (i.e. 1st Percentile, 25thPercentile, 50th Percentile and 75th Percentile). Marginaleffects estimated the amount of change in the predictedvalues of outcome variable for one unit change in obesity adjusted for other covariates. Table 4 shows that thechange in dental caries increases with an increase in obesity rate across different levels of modifiers. The association between obesity and dental caries was steeper in lessdeprived areas and those areas with a smaller proportionof lone parents. There was an inverse association betweendental caries and obesity in local authorities with a lowerproportion of white ethnicity, unlike areas with a higherproportion of white population.
Ravaghi et al. BMC Oral Health(2020) 20:338Page 5 of 7Table 3 Linear regression coefficients and their confidence intervals for two indicators of dental cariesObesityPrevalence of dental caries (% d3mft 0)Mean dmft score (Decayed, missing, filled teeth)Model 1Coefficient (95%CI)Model 3Coefficient (95%CI)Model 1Coefficient (95%CI)0.02 ( 0.71, 0.75)0.3 ( 0.38, 0.97)0.12*** (0.10, 0.14)0.69*** (0.54, 0.85)0.70*** (0.53, 0.87)2.62*** (2.12, 3.12)DeprivationModel 2Coefficient (95%CI)Model 2Coefficient (95%CI)Model 3Coefficient (95% CI)0.001 ( 0.03, 0.03)0.02 ( 0.01, 0.05)0.03*** (0.02, 0.04)0.03*** (0.03, 0.04)Dental attendance0.39*** (0.29, 0.49)0.02*** (0.01, 0.02)Lone Parenthood 0.51 ( 1.24,0.22)White ethnicity 0.20*** ( 0.26, 0.14) 0.04** ( 0.08, 0.01)Fluoridation(0 not fluoridated; 1 fluoridated) 0.01*** ( 0.01, 0.01) 2.30* ( 4.56, 0.04)(Constant) 1.82 ( 6.36,2.71) 8.01*** (3.42,12.60)7.66* (0.63, 14.70)N302302302 0.18*** ( 0.28, 0.08) 0.35*** ( 0.55, 0.14)3020.1 ( 0.10, 0.31)0.3 ( 0.00, 0.61)30230295% confidence intervals in brackets (*p 0.05; **p 0.01; ***p 0.001)Model 1 was unadjustedModel 2 was adjusted for deprivationModel 3 was adjusted for all covariates (deprivation, dental attendance, lone parenthood, white ethnicity, fluoridation)Table 4 Marginal effects for different values of modifiersDeprivationPrevalence of dental caries (% d3mft 0)Mean dmft score (Decayed, missing, filledteeth)Marginal effects (95% CI)Marginal effects (95% CI)p valuesp valuesa1st percentile25th percentile50th percentile (Median)75th percentileWhite ethnicity1st percentile25th percentile50th percentile (Median)75th percentile0.83* (0.02, 1.65)0.52 ( 0.18, 1.21)0.046N/AN/A0.147N/AN/A0.23 ( 0.44, 0.91)0.502N/AN/A 0.16 ( 0.94, 0.62)0.686N/AN/A 2.79 *** ( 4.2, 1.37)0.3* ( 0.36, 0.95)0.87* (0.17, 1.56)1.14** (0.4, 1.88)p 0.0010.370 0.11 ** ( 0.17, 0.05)0.02 ( 0.01, 0.05)0.0010.2240.0140.04 ** (0.01, 0.07)0.0080.0030.05 ** (0.02, 0.09)0.001Lone parenthood1st percentile25th percentile50th percentile (Median)75th percentile0.81* ( 0.05, 1.67)0.0660.03 ( 0.01, 0.07)0.1200.45 ( 0.3, 1.2)0.2390.02 ( 0.01, 0.05)0.2610.06 ( 0.65, 0.78)0.8680.01 ( 0.03, 0.04)0.670 0.36 ( 1.15, 0.43)0.368 0.01 ( 0.04, 0.03)0.722N/A not applicable due to non-significant interaction terms95% confidence intervals in brackets (*p 0.05; **p 0.01; ***p 0.001)aThere was no interaction between deprivation and mean dmft scores, therefore corresponding marginal effects have not been reportedDiscussionWe found a linear association between obesity and dental caries in bivariate analyses; however, this associationdisappeared after accounting for the effect of deprivation.Furthermore, we showed that the association betweenobesity and dental caries was not uniform; rather, thestrength and direction of this association varies by modifying characteristics such as deprivation, ethnicity and
Ravaghi et al. BMC Oral Health(2020) 20:338lone parenthood. The findings of our study are relevantto oral health policies aiming to reduce dental caries andobesity through the common risk factor approach.We did not establish an independent associationbetween prevalence of childhood obesity and dentalcaries in English local authorities. Previously, an officialPHE report suggested a ‘weak to moderate’ associationbetween dental caries and obesity preva
Jun 19, 2020 · land in an ecological study. Methods: We analysed data from 326 lower tier English local authorities. Data on obesity and dental caries were retrieved from 2014/15 to 2016/17 National Child Measurement Progr