Transcription
WASHBURNDATA BOOKJanuary 2017
Kansas Board of RegentsElaine FrisbieVice President of Finance and AdministrationWASHBURN DATA BOOK, January 2017Enclosed is the recently-completed Washburn Data Book which includes information about WashburnUniversity and its affiliate, Washburn Institute of Technology. It is designed to provide a reference oftabular data concerning key facts about these institutions. Additionally, to further assist in definingfrequently used budgetary and demographic terms, a glossary of terms is provided at the end of thebook.Washburn University was founded in 1865 by members of the Congregational Church on the principlethat all people have the right to earn an education. In 1941, the City of Topeka voted to make it amunicipal university, to be governed by its own Board of Regents. Today, Washburn educates over7,000 students in more than 200 academic programs leading to certification, associate, bachelor’s,master’s, doctor of nursing practice, and juris doctorate degrees.Washburn Institute of Technology was founded in 1964 as a vocational and technical school. In 2008,the management of the school shifted from the Topeka Unified School District 501 Board of Educationto be operated as a unit administered by Washburn University and governed by its Board of Regents.Currently, Washburn Tech delivers innovative educational training opportunities, preparing individualsfor gainful employment in technical and professional careers supporting economic development andcivic responsibility.The Washburn Data Book contains meaningful information related to Finance, Tuition and Fees,Students, and Faculty and Staff. We hope Board members find this information useful, and we lookforward to responding to any questions you may have.Availability of DataAn electronic version of the Data Book along with copies of each table are made available online at:http://www.kansasregents.org/data/system data/higher education data books.
Kansas Higher Education Reporting System (KHERS)KHERS is a web-based reporting tool for providing access to data about Kansas public postsecondaryinstitutions. KHERS allows users to view trends, filter reports, and perform comparisons throughregularly-updated dashboards, graphs and charts.KHERS reports are generated from data collected by Kansas Board of Regents from the state's 32 publichigher education institutions (six state universities, one municipal university, nineteen communitycolleges, and six technical colleges) throughout the year in data collections such as the Kansas HigherEducation Enrollment Report (KHEER) and the Kansas Higher Education Data System (KHEDS). Thesedata collections support reporting about enrollments, completions, demographics and othercharacteristics. KHERS is located on http://www.kansasregents.org/, under the “Data” heading.If you have questions concerning the content of the materials, please contact our help desk atirhelp@ksbor.org.cc:Blake FlandersWashburn University LeadersWashburn Institute of Technology LeadersDivision of the BudgetLegislative Research DepartmentKBOR Staff12/28/2016Kansas Board of RegentsPage 2
KANSAS BOARD OF REGENTSWASHBURN DATA BOOKJanuary 2017Table No.TitlePageSECTION 1 - FINANCE1.11aTotal All Funds Audited Expenses, Fiscal Year 2011 - 2015 .21.11bTotal All Funds Audited Revenues, Fiscal Year 2011 - 2015 .3Section 1 Notes.4SECTION 2 - TUITION AND FEES2.1Washburn University Tuition and Required Fees per Semester, Academic Year 2012 – 2017 .62.10Washburn Institute of Technology Tuition and Required Fees per Credit Hour, Academic Year 2012 – 2017 .6Section 2 Notes.7SECTION 3 - STUDENTS3.1Enrollment Headcount & Full-Time Equivalent, Academic Year 2011 – 2016.103.3aEnrollment by Race/Ethnicity, Academic Year 2011 – 2016.123.3bEnrollment by Gender, Academic Year 2011 – 2016 .123.3cEnrollment by Age, Academic Year 2011 – 2016 .143.3dEnrollment by Student Status & Residency, Academic Year 2011 – 2016 .143.5Washburn University Average ACT Composite Scores Among Entering Freshmen Academic Year 2012 - 2016 .163.6Degrees/Certificates Awarded by Type, Academic Year 2011 – 2016 .183.7Graduation Rates of First-Time, Full-Time Freshmen, (100%, 150%, and 200% of Program Time) .203.8One Year Retention Rates of First-Time Students .203.10Student Success Index, Entrance Year 2005 – 2010 .203.10Student Success Index, Entrance Year 2008 – 2013 21Section 3 Notes.22Kansas Board of Regents2017 Washburn Data Book
SECTION 4 - FACULTY AND STAFF4.11All Faculty and Staff Headcount and Full-Time Equivalent, Fiscal Year 2017 . 284.12Faculty Headcount and Full-Time Equivalent, Fiscal Year 2017 . 284.13Staff Headcount and Full-Time Equivalent, Fiscal Year 2017 . 29Section 4 Notes . 30GLOSSARYDefinitions of Frequently Used Enrollment and Budgetary Terms. 31Kansas Board of Regents2017 Washburn Data Book
WASHBURNDATA BOOKSection I:FinanceJanuary 2017Kansas Board of Regents12017 Washburn Data Book
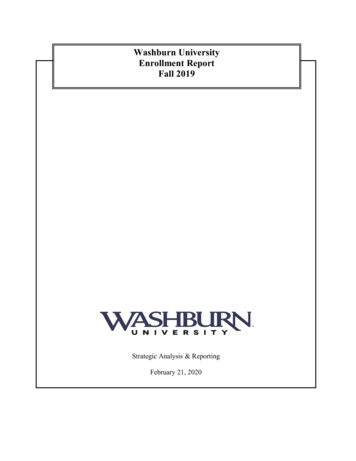
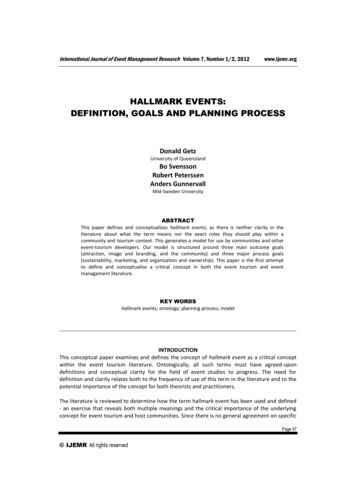
Section IWashburn UniversityTotal All Funds Audited ExpensesFiscal Year 2011 - 2015CategoryTable 1.11aFY 2011FY 2012FY 2013FY 2014FY 2015% ChangeFY 11 - 15 36,421,998 5,715 10,075,455 1,581 8,741,221 1,372 5,762,425 904 39,228,376 6,004 10,249,404 1,569 9,860,113 1,509 6,409,562 981 45,261,071 6,991 10,933,042 1,689 9,970,977 1,540 6,392,874 987 44,733,173 6,997 11,436,825 1,789 10,123,638 1,584 6,091,947 953 43,251,141 6,765 10,906,750 1,706 10,105,993 1,581 6,265,482 98018.8%18.4%8.3%7.9%15.6%15.3%8.7%8.4% 1,983,695 2,590,437 2,945,121 2,155,978 2,127,3737.2% 7,013,583 7,354,281 7,772,404 7,608,425 7,405,2005.6% 7,429,018 3,608,311 216,401 1,059,928 0 0 5,134,441 87,446,476 7,321,553 3,419,661 195,326 1,040,592 0 0 6,437,830 94,107,135 7,427,816 3,410,797 159,430 916,867 0 0 5,277,130 100,467,529 7,811,884 3,548,484 132,649 909,227 0 0 6,603,457 101,155,687 8,377,826 3,461,034 371,981 294,108 0 0 7,699,907 100,266,79512.8%-4.1%71.9%-72.3%NANA50.0%14.7% 4,863,091 4,737,909 5,233,739 4,832,155 4,707,788-3.2% 92,309,567 98,845,044 105,701,268 105,987,842 104,974,58313.7%Total Headcount9,80610,0189,9579,9669,732-0.8%Total FTE6,3736,5346,4746,3936,231-2.2%Instructionper FTE StudentAcademic Supportper FTE StudentStudent Services/Activitiesper FTE StudentInstitutional Supportper FTE StudentScholarships and FinancialAidOperation and Maintenance ofPlantDepreciationPublic ServiceResearchInterest ExpenseRealized LossesUnrealized LossesOther ExpensesSubtotal All Funds - ExpensesAuxiliary EnterprisesTotal All Funds - ExpensesTotal All Funds Audited ExpensesFiscal Year 2011 - 2015Auxiliary EnterprisesOther ExpensesInterest ExpenseResearch 110.00MPublic Service 88.00MDepreciation 66.00MOperation and Maintenance of Plant 44.00MScholarships and FinancialAidInstitutional Support 22.00MStudent Services/ActivitiesAcademic Support 0.00MFY 2011FY 2012FY 2013FY 2014FY 2015InstructionNotes for this section begin on page 4.Source: Independent Auditors' Report and Financial Statements; KHEDS AY CollectionKansas Board of Regents22017 Washburn Data Book
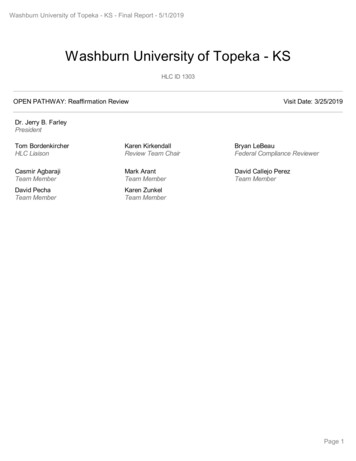
Section IWashburn UniversityTotal All Funds Audited RevenuesFiscal Year 2011 - 2015CategoryFY 2011Table 1.11bFY 2012FY 2013FY 2014FY 2015% ChangeFY 11 - 15 31,297,090 13,665,608 32,370,120 15,044,710 30,441,778 23,310,516 30,581,487 17,524,250 31,281,717 16,494,6670.0%20.7% 2,261,664 2,509,403 1,938,039 1,152,735 2,179,690-3.6% 13,652 13,997,852 22,869,273 2,150,103 10,165,286 0 149,598 13,747,871 24,006,062 2,766,113 3,279,716 0 135,621 16,190,244 23,504,969 4,553,930 9,456,117 0 165,893 16,772,838 24,254,890 8,724,091 8,223,334 0 60,442 17,351,051 24,518,023 7,438,889 3,351,869 0342.7%24.0%7.2%246.0%-67.0%NA 1,192,408 1,304,023 1,416,448 1,320,174 1,288,6308.1% 0 0 602,111 98,215,047 0 0 719,621 95,897,237 0 0 976,875 111,924,537 0 0 1,322,860 110,042,552 0 0 1,069,051 105,034,029NANA77.6%6.9% 5,921,737 5,898,337 6,343,233 6,428,097 6,324,6466.8% 104,136,784 101,795,574 118,267,770 116,470,649 111,358,6756.9%Total Headcount9,80610,0189,9579,9669,732-0.8%Total FTE6,3736,5346,4746,3936,231-2.2%Tuition and Fees*Federal Grants and ContractsState and Local Grants andContractsPrivate Grants and ContractsState AppropriationsCounty and Local AppropriationsGifts and ContributionsInvestment IncomeInterest IncomeSales and Services ofEducational DepartmentsRealized GainsUnrealized GainsOther RevenuesSubtotal All Funds - RevenuesAuxiliary EnterprisesTotal All Funds - RevenuesTotal All Funds Audited RevenuesFiscal Year 2011 - 2015Auxiliary EnterprisesOther RevenuesSales and Services ofEducational DepartmentsInvestment Income 120.00M 96.00MGifts and ContributionsCounty and Local Appropriations 72.00MState Appropriations 48.00MPrivate Grants and ContractsState and Local Grants and Contracts 24.00M 0.00MFederal Grants and ContractsFY 2011FY 2012FY 2013FY 2014FY 2015Tuition and Fees**Tuition and Fees are reported net of scholarship discounts and allowances.Notes for this section begin on page 4.Source: Independent Auditors' Report and Financial Statements; KHEDS AY CollectionKansas Board of Regents32017 Washburn Data Book
Section ISection I NotesGeneral Notes:1.2.Washburn Institution of Technology (Washburn Tech) is affiliated with Washburn University. The University’s Board ofRegents is also the governing body of Washburn Institute of Technology, and the University’s management has operationalresponsibility for Washburn Tech. Under governmental accounting standards, the University’s audited financial statementsinclude Washburn Tech as a “blended component unit”. Condensed combining financial statements, which include columnsfor both the University and Washburn Tech, are presented in the notes to the University’s audited financial statements,which are available in the KBOR office. These audited financial statements are used as the primary source for the tables inthis section.The headcount for Washburn University includes Washburn Institute of Technology, as a combined total. The breakout ofeach is as follows:CategoryFY 2011FY 2012FY 2013FY 2014FY 2015Total Headcount - Washburn8,5938,6718,4068,0847,848Total Headcount - Washburn Tech1,2131,3481,5511,8821,884Total Headcount9,80610,0199,9579,9669,732Total FTE - 066,3736,5346,4746,3936,231Total FTE - Washburn TechTotal FTE3.Because the Washburn University Data Book is only a profile section, the facilities information which is usually included inSection 1 for KBOR’s other Data Book publications will be located in the notes section for the purposes of this publication.Physical Facilities - Washburn UniversityTotal Acreage160Total Number of Buildings33Total Gross Area of Buildings (sq. ft)1,479,322Table P.20: Total All Funds Audited Expenses1.The total audited expense categories included in Table 1.11a were created based on existing classification of expenses inthe Independent Auditors' Report and Financial Statements for each institution for uniformity purposes. "Interest Expense"includes the audit category "Interest on indebtedness"; “Auxiliary Enterprises” includes the audit categories “Residentialliving” and “Memorial union”; "Other Expenses" includes the audit categories "Self-insurance claims, net of premiums" and"Other non-operating expenses".Table P.30: Total All Funds Audited Revenues1.The revenue categories included in Table 1.11b were created based on existing classification of revenues in the IndependentAuditors' Report and Financial Statements for each institution for uniformity purposes. “Federal Grants and Contracts”includes the audit category “Capital Grants – Federal”; “State and Local Grants and Contacts” includes the audit category“Capital Grants and Gifts – Non-Federal”; "Private Grants and Contracts" includes the audit category "Nongovernmentalgrants and contracts"; "Auxiliary enterprises" includes the audit categories "Residential living" and "Memorial union";"Other Revenues" includes the audit categories "Other operating revenues" and "Additions to Permanent Endowments".Kansas Board of Regents42017 Washburn Data Book
WASHBURNDATA BOOKSection II:Tuition and FeesJanuary 2017Kansas Board of Regents52017 Washburn Data Book
Section IIWashburn UniversityTuition and Required Fees per Semester*Academic Year 2012 - 2017AY 2012ResidentUndergraduate Tuition 3,240 43Required FeesTotal per Semester 3,283 3,564Graduate Tuition 43Required FeesTotal per Semester 3,607Table 2.1% ChangeAY 12 - 17AY 2013AY 2014AY 2015AY 2016AY 2017 3,375 43 3,418 3,555 43 3,598 3,720 43 3,763 3,900 55 3,955 4,095 55 4,15026.4%27.9%26.4% 3,708 3,900 4,080 4,284 4,500 43 3,751 43 3,943 43 4,123 55 4,339 55 4,55526.3%27.9%26.3%Non-Resident 7,335Undergraduate Tuition 43Required FeesTotal per Semester 7,378 7,635 8,025 8,400 8,820 9,255 43 7,678 43 8,068 43 8,443 55 8,875 55 9,31026.2%27.9%26.2%Graduate Tuition 7,272 43Required FeesTotal per Semester 7,315 7,560 43 7,603 7,944 43 7,987 8,304 43 8,347 8,724 55 8,779 9,156 55 9,21125.9%27.9%25.9%Washburn Institute of TechnologyTuition and Required Fees per Credit Hour**Academic Year 2012 - 2017AY 2013AY 2014AY 2015AY 2016AY 2017% ChangeAY 12- 17 79 0 82 5 89 7 94 9 104 12 114 1544.3%NA 79 87 96 103 116 12963.3%AY 2012ResidentTuitionRequired FeesTotal per Credit HourAY 2013AY 2014AY 2015AY 2016AY 2017% ChangeAY 14- 17NANANANA 89 7 94 9 104 12 114 1528.1%114.3%NANA 96 103 116 12934.4%AY 2012OnlineTuitionRequired FeesTotal per Credit HourTable 2.10*Rates listed are for full-time status.**Per-credit-hour rates are estimated. Institution imposed a flat/per year tuition and required fee structure, ratherthan a per credit hour structure, beginning in Academic Year 2015.Notes for this section begin on page 7.Source: KBOR Washburn Tuition and Fees SurveyKansas Board of Regents62017 Washburn Data Book
Section IISection II NotesGeneral Notes:1.2.For tuition and fees only, “Academic Year” refers to a sequence of Fall, Spring, and Summer, the given year being the yearin which the spring and summer semesters occur (i.e. the 2017 Academic Year for tuition, covers Fall 2016 Spring 2017 Summer 2017). However, for data collection, “Academic Year” refers to a sequence of Summer, Fall, Spring, the given yearbeing the year in which the spring semester occurs (i.e. the 2017 Academic Year for data collection, covers Summer 2016 Fall 2016 Spring 2017). Please note that the difference in academic year is for tuition and fees only, and all other tables ornotes referencing AY in this publication are referring to data collection academic year.“Required Fees” include mandatory fees generally paid by all students. They do not include other fees institutions maycharge on a conditional basis (such as housing, certain lab fees, etc.)Table 2.1: Washburn University Tuition and Required Fees per Semester1.2.3.4.5.Full-time denotes 15 credit hours for undergraduate students.Full-time denotes 12 credit hours for graduate students.Tuition was reported at a per credit hour rate, and was calculated per the above definitions.Washburn University charges several different online tuition rates based on program, level, and residency status. The percredit-hour rate for undergraduate online courses for AY 2017 was 352.Washburn University does not charge required fees for the Summer semester.Table 2.10: Washburn Institute of Technology Tuition and Required Fees per Credit Hour1.2.Washburn Institute of Technology charges one tuition rate for all students, which is shown as the resident rate.KBOR began collecting information on online tuition rates as of AY 2014.Kansas Board of Regents72017 Washburn Data Book
Section II(Intentionally left blank)Kansas Board of Regents82017 Washburn Data Book
WASHBURNDATA BOOKSection III:StudentsJanuary 2017Kansas Board of Regents92017 Washburn Data Book
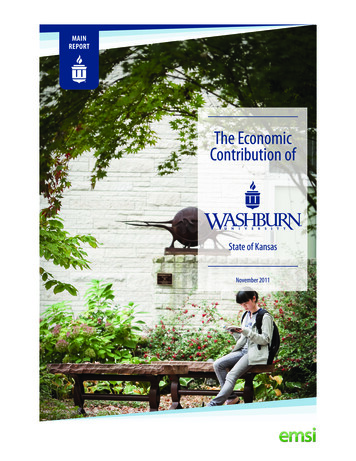
Section IIIWashburn UniversityWashburn University offers more than 200 programs leading to certification, associate, bachelor,master's, doctor of nursing practice and juris doctor degrees through the College of Arts andSciences and the schools of Applied Studies, Business, Law and Nursing. Located on a 160-acrecampus in the center of Topeka, the capital of Kansas, Washburn provides broadly-based liberalarts and professional instruction and makes available to students diverse educationalopportunities through an interactive campus and community relationships. An affiliate of theuniversity is Washburn Institute of Technology, which provides high school and adult studentssignificant opportunities to develop skills and knowledge relevant to contemporary career fields.Since 1941, Washburn University has been continuously accredited or approved by the HigherLearning Commission: A Commission of the North Central Association of Colleges and Schools.Enrollment Headcount & Full-Time EquivalentAcademic Year 2011 - 2016AY 20118,5935,641Enrollment HeadcountFull-Time Equivalent EnrollmentAY 20128,6715,699Table 3.1AY 20138,4065,589AY 20148,0845,321AY 20157,8485,125AY 20167,8035,010% ChangeAY 11 - 16-9.2%-11.2%Headcount and FTEAcademic Year 2011 - ,010AY 2015AY 20167,5006,5005,6415,6995,5895,3215,5004,500AY 2011AY 2012AY 2013HeadcountAY 2014Full-Time EquivalentNotes for this section are located on page 22.Source: KHEDS AY CollectionKansas Board of Regents102017 Washburn Data Book
Section IIIWashburn Institute of TechnologyWashburn Tech, in Topeka, Kansas has a unique relationship with Washburn University, allowingstudents to seamlessly transition between campuses. Washburn Tech offers 30 technical programsin areas of Advanced Manufacturing, Business, Computer and Electronic Technology, Construction,Drafting and Design, Health Care, Hospitality and Human Services, and Transportation. WashburnTech serves post-secondary and high school students, as well as providing continuing educationand customized training for business and industry. Washburn Tech has one of the highestgraduation rates and one of the highest placement rates of any two year public insti
Kansas Board of Regents Elaine Frisbie Vice President of Finance and Administration WASHBURN DATA BOOK, January 2017 Enclosed is the recent