Transcription
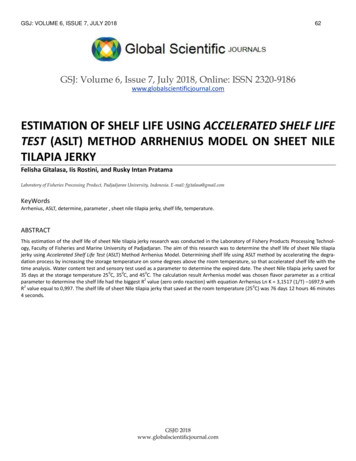
GSJ: VOLUME 6, ISSUE 7, JULY 201862GSJ: Volume 6, Issue 7, July 2018, Online: ISSN 2320-9186www.globalscientificjournal.comESTIMATION OF SHELF LIFE USING ACCELERATED SHELF LIFETEST (ASLT) METHOD ARRHENIUS MODEL ON SHEET NILETILAPIA JERKYFelisha Gitalasa, Iis Rostini, and Rusky Intan PratamaLaboratory of Fisheries Processing Product, Padjadjaran University, Indonesia. E-mail: fgitalasa@gmail.comKeyWordsArrhenius, ASLT, determine, parameter , sheet nile tilapia jerky, shelf life, temperature.ABSTRACTThis estimation of the shelf life of sheet Nile tilapia jerky research was conducted in the Laboratory of Fishery Products Processing Technology, Faculty of Fisheries and Marine University of Padjadjaran. The aim of this research was to determine the shelf life of sheet Nile tilapiajerky using Accelerated Shelf Life Test (ASLT) Method Arrhenius Model. Determining shelf life using ASLT method by accelerating the degradation process by increasing the storage temperature on some degrees above the room temperature, so that accelerated shelf life with thetime analysis. Water content test and sensory test used as a parameter to determine the expired date. The sheet Nile tilapia jerky saved for35 days at the storage temperature 250C, 350C, and 450C. The calculation result Arrhenius model was chosen flavor parameter as a criticalparameter to determine the shelf life had the biggest R2 value (zero ordo reaction) with equation Arrhenius Ln K 3,1517 (1/T) –1697,9 withR2 value equal to 0,997. The shelf life of sheet Nile tilapia jerky that saved at the room temperature (250C) was 76 days 12 hours 46 minutes4 seconds.GSJ 2018www.globalscientificjournal.com
GSJ: VOLUME 6, ISSUE 7, JULY 201863INTRODUCTIONAccording to Fachruddin (1997), jerky is a traditional processed product that is very popular in Indonesia which is using herbs andspices and has an added value if done process modification that improves the quality and benefit and also has a good prospect. Incooking of jerky, usually the materials are dried by adding a mixture of salt, sugar, and seasonings including sugar, tamarind, salt andherbs and spices aim to produce flavor, distinctive taste, and giving durability on jerky and can postpone microbes growth due tocontent of tannin compound and antioxidant (Sumbaga 2006).According to Ashriyyah (2015), a kind of jerky reviewed from the way of making was divided into three groups, they are beefjerky, sliced jerky, and yeast jerky. A jerky that would make in this research was beef jerky with the final product result of a sheetjerky. This kind of jerky considered more superior because the grinding process could improve the texture and the taste of the produced jerky. This is because the seasonings that added to would absorb more evenly to all of jerky surfaces (Ainurrohmah 2012).According to Purnomo (1995), jerky as a half-wet food that has 15-40% of water content is generally durable enough andstable in storage at the room temperature. A semi-wet product like fish jerky has generally a short shelf life, because easy to havingdamaged due to microorganism work and being obstacles in expansion effort of fishery products marketing.To guarantee that the fish jerky is still worth consuming and doesn’t having damaged yet it’s required an information aboutthat product shelf life so it needed to do a research about determining shelf life of sheet jerky using Accelerated Shelf Life Test (ASLT)method Arrhenius model using an acceleration temperature so can accelerate the reaction that causes a damage on the products.The excess of this method is the time that needed to determine shelf life is relatively short, but still has a high accuracy.METHOD OF RESEARCHPlace and Time of ResearchThe research of shelf life estimation of Nile tilapia sheet jerky was conducted in Laboratory of Fisheries Products ProcessingTechnology, Faculty of Fishery and Marine University of Padjadjaran and the test of the water content of fish jerky was done in Laboratory of Test Service Faculty of Agricultural Industrial Technology University of Padjadjaran. The research was conducted in February-March 2018.Tools and MaterialsThe tools used in this research were a knife, a cutting board, a food processor, a meat grinder, basins, oven, and pan. Thematerials used were Nile tilapia, salt, onion, tamarind, coriander, brown sugar, galangal, ginger, and carrageenan.This research used ASLT method Arrhenius model, the test was conducted by saving the products in the incubator at thetemperature of 250C, 350C, and 450C for 35 days. The observation was conducted on the days 1, 7, 14, 21, 28, and 35 for every storage temperature. The parameter that tested to estimate the shelf life ASLT method Arrhenius model was using sensory testing data(texture, flavor, appearance, and taste) and test of water content.The calculation of shelf life of the sheet Nile tilapia jerky used Accelerated Shelf Life Test (ASLT) method with Arrheniusmodel approach was done with stages as follows:a.The determination of the right reaction ordo described the fish jerky damage through R2 value comparison (linear regression) at ordo 0 or ordo 1. Ordo used was the ordo that had the biggest R2 value or the closest to one. R2 value aimed to find out thepercentage of appearance changing affected by the storage time, if R2 value was the biggest value or the closest to one then wouldprovide the most right of the calculation result of expired time.Simple Linear RegressionA simple linear regression analysis used to know the effect between one independent variable to one dependent variable.The general equation is: Y b X a . With Y is a dependent variable and X is the independent variable. Coefficient a is a constant (intercept) that is an intersection between regression line with Y axis on the Cartesians coordinate while coefficient b is a slope data. Inthis Arrhenius method, a linear regression is the first phase to obtain Arrhenius equation. The variables can be observed in this research were as follows:a)Independent Variable : Days of Storage (X)Days of storage was a time that used on the certain interval to know the damage signs of the sheet Nile tilapia jerky so dueto the days of storage would obtain an analysis result then computed the rate of quality degradation using Arrhenius method.b)Dependent Variable :Average organoleptic value and moisture content. The values from a and b on the regression equation could be countedwith this formula below :GSJ 2018www.globalscientificjournal.com
GSJ: VOLUME 6, ISSUE 7, JULY 201864 ( y)( x ) ( x)( xy)n ( x ) ( x)b ( xy) ( x)( y)n ( x ) ( x)b.Making Arrhenius PlotR2 value at the three temperatures and determined the reaction ordo, slope value from that equation was K value at thestorage temperature respectively. Chosen between ordo 1 and ordo 0 that had the biggest constant b value. After obtaining K valueat the storage temperature respectively, made Arrhenius plot with Ln K value as an ordinate and 1/T value as an abscissa.1.Counting Ln k (this process was done per temperature respectively)Through taking variable b coefficient from linear regression equation above then counted Ln from every variable, and madeinto LnK.2.Counting 1/T 273This counting took the temperature of user inputted then counted by that formula above, where T user inputted temperature. I.e. : temperature 25 C, then : 1/25 273 0,0034. In this process was done at the each of user inputted temperature.3.Linear Regression (2nd Regression Process)Made the Arrhenius plot by counting linear regression again between Ln K (from point 2 above) and 1/T (from point 3above) where X Ln K and Y 1/T processed by the same linear regression formula then projected with a graphic. Obtained an equation y a b 1/T ( a Ln K and b 1/T ).4.Activation Energy ( Ea )The next process was searching (Ea) value of each parameter (appearance, flavor, texture, taste, and water content). Activation Energy (Ea) was an energy that required to start a change/degradation of quality.Ea - (b R)Information :Ea: Activation energy (kJ/mol)b: Slope dataR: Gas constant (8,315 J/K)c.Calculation K value at the various storage temperatures. K and Ko with Arrhenius equation that could describe the relationship between the damage rate and the high temperature. Arrhenius equation used was:K K e ea RTInformation:K: quality degradation constantKo: Constant (not depend on the temperature)Ea: Activation energyT: Absolute temperature (C 273)R: Gas constant 8,315 (J/K mol)d.Finding shelf life based on kinetic rate model ordo zero or ordo one. The reaction of C concentration degradation to reactionrate function on the temperature (T), if following kinetic rate model of ordo zero the formula is as follows:C C KInformation:K:K value at various storage temperatures,C:Total of Quality unitC0:Total of Quality unit until expired tRESULT AND DISCUSSIONAppearanceAccording to Elfirah et al (2015), the brown color that occurred on the jerky is caused by the reaction of non-enzymatic browning,that is maillard reaction which can occur on the foodstuff that contains the reducer sugars (glucose, fructose) reacting with tywillappearbrownishcolor.GSJ 2018www.globalscientificjournal.com
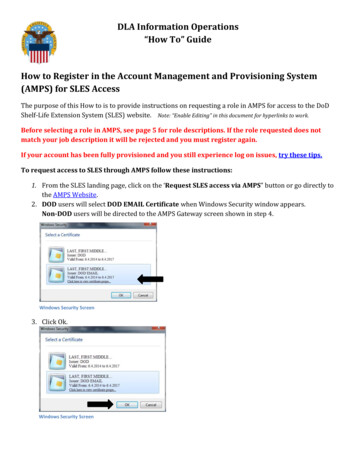
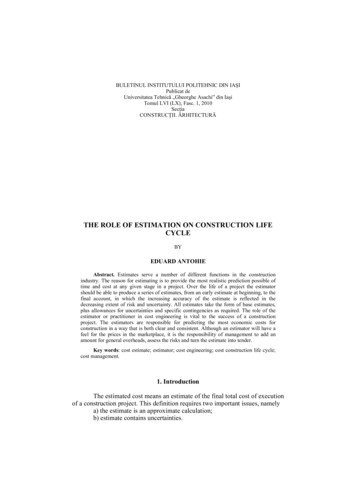
GSJ: VOLUME 6, ISSUE 7, JULY 2018655y -0.1232x 8.9772R² 0.9189007142128Time of Storage (Days-)35Ordo 1Ln Value of AppearanceValue of AppearanceOrdo 0y -0.0893x 8.888510R² 0.9154y -0.101x 8.9399R² 0.89672.5y -0.0129x 2.2047R² 0.8882y -0.02x 2.2406R² 0.8645y -0.0152x 2.219R² 0.85732.01.51.00.50.007142128Time of Storage (Days-)(a)35(b)Figure 1. Graphic of Relationship of Appearance Score Degradation to TimeR2 value (Figure 1) R2 value comparison on three temperatures, ordo 0 is bigger than ordo 1 on the graphic of Relationship ofappearance score degradation to time so in determining Arrhenius equation then chosen ordo 0.Arrhenius Plot1/T-2.000.0031 0.00315 0.0032 0.00325 0.0033 0.00335 0.0034-2.10Ln K-2.20-2.30 y -1520,4x 2,6723R² 0,9766-2.40-2.50Figure 2. Graphic of Appearance Arrhenius PlotFlavorThe longer product storage and the higher storage temperature then the flavor hedonic score of sheet Nile tilapia jerkywould decrease on average, then the panelist's pleasure to the flavor of the product will be more decreased. Degradation of thepanelist's calculation to the flavor of sheet Nile tilapia jerky could occur due to volatile compounds evaporated on the sheet Nile tilapia jerky (Wijaya 2007).Ordo 0y -0.0933x 8.76R² 0.864286y -0.1128x 8.8154R² 0.88074y -0.0788x 8.6812R² 0.8542007142128Time of Storage (Days-)35Ordo 1y -0.0141x 2.1954R² 0.83592.5Ln Value of FlavorValue of Flavor102.0y -0.0181x 2.2156R² 0.8444y -0.0114x 2.1781R² 0.83511.51.00.50.007142128Time of Storage (Days-)(a)35(b)Figure 3. Graphic of Relationship of Flavor Score Degradation to TimeThree temperatures of R2 value (Figure 3) between ordo 0 and ordo 1 then could be seen that ordo 0 had bigger R 2 valuethan R2 value from ordo 1 on the graphic of the relationship of flavor score degradation to time so it’s chosen ordo 0 to be deterGSJ 2018www.globalscientificjournal.com
GSJ: VOLUME 6, ISSUE 7, JULY 201866mined the Arrhenius equation.Arrhenius Plot1/TLn K-2.100.0031 0.00315 0.0032 0.00325 0.0033 0.00335 0.0034-2.20y -1697.9x 3.1517R² 0.9973-2.30-2.40-2.50-2.60Figure 4. Graphic of Flavor Arrhenius PlotTextureThe longer product storage and the higher storage temperature then the texture hedonic score of sheet Nile tilapia jerkywould be decreased on average, then the panelist's pleasure to the texture of the product would be more decreased. The texturehad a relationship with the water content, the storage process in a certain time could change the texture from each treatment occurred a degradation of quality due to the water content in sheet Nile tilapia jerky was reduced. It strengthened with the statement,According to Rahmanto et al (2014), the rates of food product acceptance from texture parameter is strongly affected by the watercontent, the lower water content value of a jerky then the texture isn’t elastic and easily broken unlike the initial quality from theelastic and isn’t easily broken jerky.Ordo 0y -0.1161x 8.918R² 0.889586y -0.0749x 8.7672R² 0.8559y -0.1006x 8.91R² 0.824642007142128Time of Storage (Days-)Ordo 1y -0.0187x 2.2304R² 0.8392.5Ln Value of TextureValue of Texture10352.0y -0.0156x 2.2203R² 0.7778y -0.0106x 2.1864R² 0.82881.51.00.50.007142128Time of Storage (Days-)(a)35(b)Figure 5. Graphic of Relationship of Texture Score Degradation to TimeThree temperatures of R2 value (Figure 5) seen that R2 value at ordo 0 was bigger than R2 value ordo 1 on the graphic of therelationship of appearance score degradation to time so it’s chosen ordo 0 to be determined the Arrhenius equation.Arrhenius Plot1/TLn K0.000.0031 0.00315 0.0032 0.00325 0.0033 0.00335 0.0034-0.50-1.00-1.50-2.00y -2083,8x 4,4231R² 0,9685-2.50-3.00Figure 6. Graphic of Texture Arrhenius PlotGSJ 2018www.globalscientificjournal.com
GSJ: VOLUME 6, ISSUE 7, JULY 201867TasteThe longer product storage and the higher storage temperature then the taste hedonic score of sheet Nile tilapia jerky willbe decreased on average, then the panelist's pleasure to the products taste will be more decreased. It strengthened by a statementof Frans (2016) that the food products in the storage till will occur the change of taste.Ordo 0y -0.0816x 9.0632R² 0.8974Value of Taste8y -0.1028x 9.1713R² 0.900464y -0.1217x 9.194R² 0.91742Ordo 12.50Ln Value of Taste10y -0.0189x 2.2604R² 0.86542.0y -0.0149x 2.2429R² 0.87021.5y -0.0112x 2.2193R² 0.88071.00.50.00714212835Time of Storage (Days-)07142128Time of Storage (Days-)(a)35(b)Figure 7. Graphic of Relationship of Taste Score Degradation to TimeThree temperatures of R2 value (Fi
jerky using Accelerated Shelf Life Test (ASLT) Method Arrhenius Model. Determining shelf life using ASLT method by accelerating the degra- dation process by increasing the storage temperature on some degrees above the room temperature, so that accelerated shelf life with the time analysis. Water content test and sensory test used as a parameter to determine the expired date. The sheet Nile .