Transcription
April 2018, Volume 3, Number 3Research Paper: Investigation of the Accidents Recordedat an Emergency Management Center Using the ParetoChart: A Cross-Sectional Study in Gonabad, Iran, During2014-2016CrossMarkMohammad Hosein Beheshti1, Roohalah Hajizadeh2, Somayeh Farhang Dehghan3, Reza Aghababaei4, Sayed Mohammad Jafari5,Alireza Koohpaei6,7*1. Department of Occupational Health, School of Health, Gonabad University of Medical Sciences, Gonabad, Iran.2. Work Health Research Center, Qom University of Medical Sciences, Qom, Iran.3. Department of Occupational Health Engineering, School of Public Health, Shahid Beheshti University of Medical Sciences, Tehran, Iran.4. Department of Occupational Health Engineering, School of Health, Hamadan University of Medical Sciences, Hamadan, Iran.5. Department of Occupational Health Engineering, School of Medicine, Khatam Al-Nabieen University, Kabul, Afghanistan.6. Department of Occupational Health Engineering, School of Health, Qom University of Medical Sciences, Qom, Iran.7. Occupational Health Research Center, Qom University of Medical Sciences, Qom, Iran.Use your device to scanand read the article onlineCitation: Beheshti MH, Hajizadeh R, Farhang Dehghan S, Aghababaei R, Jafari SM, Koohpaei A. Investigation of the Acci-dents Recorded at an Emergency Management Center Using the Pareto Chart: A Cross-Sectional Study in Gonabad, Iran, During2014-2016. Health in Emergencies and Disasters Quarterly. 2018; 3(3):143-150. https://doi.org/10.29252/NRIP.HDQ.3.3.143:: https://doi.org/10.29252/NRIP.HDQ.3.3.143Article info:Received: 02 Nov. 2017Accepted: 28 Feb. 2018ABSTRACTBackground: This study investigated the accidents recorded at the Gonabad HospitalManagement Center for Hospital Management from 2014 to 2016, and identified importantcauses or parameters that influenced the incidence of accidents using the Pareto chart.Materials and Methods: This descriptive and analytic study examined 25,414 incidentsrecorded at the Gonabad Hospital Management Center. The key variables such as the typesof accident, age, time, types of lesion, and treatment, were collected for transport and nontransport accident. Data analysis was performed using Pareto chart as well as Minitabver v.16and SPSS v.21 software.Keywords:Results: Based on the results, the highest rate of the accidents (39.79%) were among peopleaged between 0-10 years. Transport accidents (17.61%) and heart attacks (10.92%) were themost common that occurred during the study. The spring had the highest rate of accidents,while the winter had the lowest.Pareto charts, Accidentanalysis, Emergency centersConclusion: Transportation accidents had the highest rate of incidents and injuries; therefore,the safety of transportation and vehicles should be taken more seriously.* Corresponding Author:Alireza Koohpaei, PhDAddress: Department of Occupational Health Engineering, School of Health, Qom University of Medical Sciences, Qom, Iran.E-mail: koohpaei19@yahoo.com143
April 2018, Volume 3, Number 31. Introductionoday, government allocates large portionsof resources to accidents and disaster management. Every day media reports various incidents that occur around the world.Climate changes, human handicaps in nature, and rapid technological growth haveincreased the level of human vulnerabilityand the occurrence of accidents [1].TThe statistics show the growth rate of around the worldis causing financial losses and casualties to nations everyyear. In the last decade, nearly one billion people in theworld, about one-sixth of the world’s population, havebeen directly or indirectly affected by the disaster. Iranis one of the countries with the highest casualties. According to the World Health Organization (WHO) annual report, more than 60 million people were injuredin road traffic crashes [2], and most road traffic crashesinvolved youngsters [3]. Road traffic crashes, in addition to physical and mental injuries, cause capital andeconomic losses [4].Millions of people suffer from various types of disabilities due to road traffic crashes every year, which leads tothe loss of active human resources and millions of hoursof useful work [5]. The damage caused by road trafficcrashes in human societies is far greater than the damage caused by diseases such as cancer, cardiovascular disease, Alzheimer’s and AIDS [6]. According to the WHO,worldwide 3.5 million people die every year in an accident. In addition, a huge amount of resources allocatedto the health sector is used to compensate for damagescaused by accidents [7]. In addition to economic loss, thepsychological and emotional impact of accidents on victims and their families is also unforgivable [8]. However,the studies show that 98% accidents can be prevented [9].To examine the conditions in any particular context isthe first step to identifying problems and implementingappropriate and proper planning. Findings from Knightet al. study revealed most of the road traffic deaths involved illiterate men in the age group of group 21-40years [10]. Fam et al. in a research conducted in Tehran, reported that 12.7% victims of traffic accidents weremotorcyclists [11]. Shibata and Fukuda, in its study toinvestigate the risk factors in motor vehicle accidents,reported that driving without license, driving under theinfluence, speeding, riding without helmets and seatbelts are leading causes of death in road traffic crashes[12]. Shankar and Mannering have proposed five levelsfor determining the severity of injuries in a five-year144study of motor vehicle accidents, which include financial losses, probable damage, obvious damage, damageleading to disability and death. They have also stated thatthe severity of injuries depends on factors such as environment, status of the rider, features of the vehicle, andcharacteristics of the driver [13].One of the major problems in the application and implementation of management and engineering measuresis the lack of knowledge about causes and its impact onaccidents. To provide a solution to eliminate or reduceincidents, it is important to identify and investigate thecauses behind them. Therefore, providing reality-basedcontrol strategies is only possible if critical points andfactors affecting the occurrence of accidents are identified. Hence, the allocation of cost-control in a useful andscientific way requires research into accident recordsat government departments and agencies. In the recentyears, relatively a huge amount of money has been spentto control and reduce injuries caused by accidents insideand outside the city. However, there is no significantreduction in the safety and reduction of injuries causedby accidents. The most important reason for this issue isspending costs without taking into account the prioritiesand key factors affecting the occurrence of accidents. Onthe other hand, few studies are being undertaken to identify the causes that contribute to the incidents.In this study, we have tried to investigate the recordsat the Gonabad Medical Accident and Emergency Management Center during the period 2014-2017 in an analytical and descriptive manner using the Pareto chart andidentify the reasons behind the accidents using the Pareto chart, and can propose and implement effective andtargeted control strategies.2. Materials and MethodsThis descriptive-analytic study analyzed records of accidents at the Gonabad Emergency Management Center from 2014 to 2016 using Pareto chart. Pareto chart,named after Italian scientist Wilfred Pareto who observedthat 80% of the wealth is received by 20% of the peoplein Italy. Pareto charts illustrate frequency distribution ofclassified descriptive data. The chart places the class onhorizontal axis and frequencies on the vertical axis. Todraw the Pareto chart, all steps are required to draw acolumn graph. The events are represented in descending order and the cumulative record is represented by theline. By using this method, the area with the maximumproblems (80%) is determined [14].Beheshti MH, et al. Accidents Recorded at an Emergency Management Center Using the Pareto Chart. HDQ. 2018; 3(3):143-150.
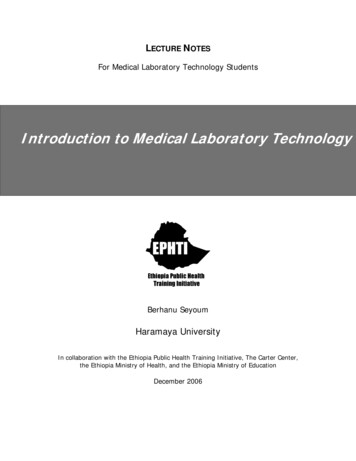
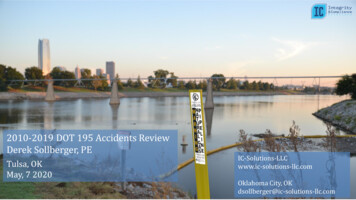
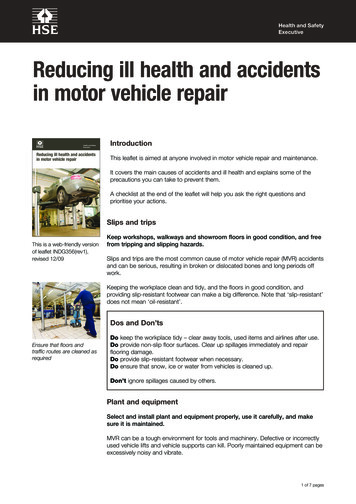
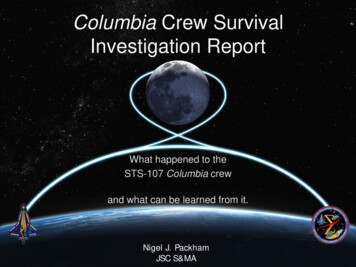
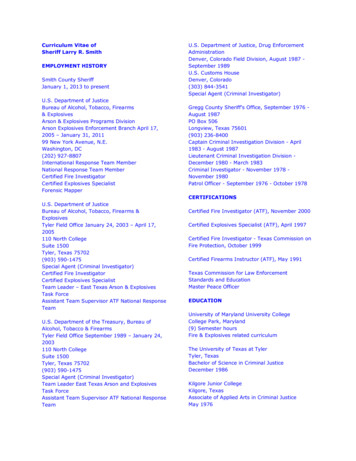
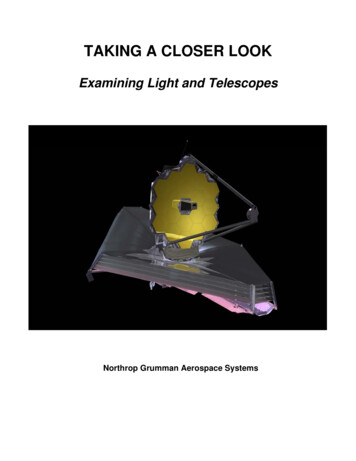
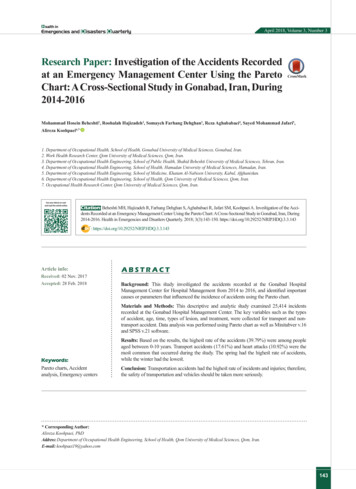
April 2018, Volume 3, Number 3After determining the frequency, the chart is drawnbased on frequency and percentage of inclusion. Toachieve frequency, it is necessary to prepare a registration form based on needs and analyze them. Althoughcalculations can be done manually but using the softwareincreases speed and accuracy [14].In this study, we investigated the data during the period of 2014-2016, and other variables such as number of crashes, causes, age and sex of crash victims,time, marital status, type of incident, drugged driving,which is separated for incidents related to transportationand unrelated to transportation. The research receivedethical approval by the Research Ethics Committee ofGonabad University of Medical Sciences (Code of Ethics: IR.GMU.REC.1394.58). Finally, data were analyzedusing the SPSS software version 21 and Excel 2010 withthe help of Minitab v.16 software (Figure 1). The datawere analyzed using the correlation coefficient and logistic regression test at a significant level of 5%.3. ResultsIn this study, 25414 incidents, recorded at the Emergency Management Center of Gonabad city, Iran, wereinvestigated. The type of accident and age group areshown in Figure 2. Based on the findings of this study,the highest rate of the accidents (39.79%) was observedfor individuals aged between 0-10 years. In addition,62.3% of the victims were in the age group of 40-55,55-75, and 0-10 years. It was observed that the cardiovascular events and blood pressure were the most common incidents. The transportation-related accidents andcardiovascular events were 16% and 10%, respectively.Figure 3 shows the Pareto chart of transport accidentsbased on the type of vehicle, and Pareto chart for transportation accidents on the basis of injured people. According to the Pareto charts, more than 90% accidentsare related to motorcycles and cars. The analysis of theinured people in transportation accidents indicates thatthe highest percentage of injuries was related to the driver, passengers and pedestrians.The treatment of the injured people and the outcome ofthe mission are shown in Figure 4. Among the adoptedtherapeutic measures, prescription of medications wasthe highest at the 39.4%. The outcome of the missions ofthe emergency center is often different. After categorizing these results and analyzing them, it was observed that46.6% of the mission results in the transfer of injured tothe health centers. Outpatients were ranked second with32.8% of the mission’s results. Other accidents recordedin the emergency management center were poisoningand burns. The causes of burns were divided into several categories; nearly 80% (76.4%) burns were causedby hot and flammable liquids. Food, medicine and drugcaused more than 80% of poisoning incidences. Paretochart about the type of poisoning and burn incidents areshown in Figure 5.Figure 1. Using the Minitab software to draw Pareto chartsBeheshti MH, et al. Accidents Recorded at an Emergency Management Center Using the Pareto Chart. HDQ. 2018; 3(3):143-150.145
April 2018, Volume 3, Number 3Chart AChart BPareto chart of age categoryPareto chart of type of disease4050002015000601000040500020000Age categoryFrequencyPercentCum%0-10 55-758742 311437.5 13.337.5 50.840-55 30-40 75-100 18-252684 2264 2250 170611.59.79.67.362.3 72.0 81.789.0025-30 10-181377 11985.95.194.9 g veestivReespiratoryType of diseaseFrequencyPercentCum%3695 2438 2345 2296 1733 1367 1088 955 864 811 740 7241610 10 10765443331626 36 46 53 59 64 68 72 75 78 oisoninDia gbetesAcut Hyse a tenbdiaominal20000Frequency25000100FW allomen25000646 595 559 484332284 87 89 91428 322 31221193 94 969844100Figure 2. Pareto chart of accidents in terms of age (chart A) and by type of accident (chart B)Figure 6 presents Pareto chart of accidents based onthe type of injury. Transportation and non-traffic accidents led to various injuries and damages. Most of thelesions were tenderness-related with 36.2% occurrence.Also, more than 80% of the injuries include tenderness,scratches, tears, fractures, and bleeding.The distribution of accidents, recorded by the emergency center, is classified according to the months of theyear and analyzed using the Pareto chart. March had thehighest percentage of accidents and December had thelowest. In almost identical results regarding the frequencies of accidents in different months, it was observed thatit was highest during the spring and lowest during thewinter. Further details are shown in Figure 7.4. DiscussionThe findings of this study indicate that from 2014 to2016, 25, 414 incidents were recorded in the emergency center of Gonabad city, and as per the results of thisChart Astudy, 39.79% of the accidents involved 0 to 10 yearsage group, the highest based on the age group. Theearlier studies conducted in Yazd, Iran, revealed thatmost of the incidents involved children under the ageof 6 [14]. According to Neghab and et al. study in Farsprovince, Iran, the frequent incidents involved childrenunder the age of 5 [15]. According to the studies, mostof the children-related incidents are caused by highrisk environment and lack of growth. By educating andsensitizing parents on the importance of providing carefor children and offering safety education program forkindergarten and school children, it can be preventedto a certain extent. Also, the results showed that 40to 55 and 55 to 75 age groups had the highest ratesof crashes. And after road traffic crashes, the secondmost common cause of accidents was heart diseases,including high blood pressure. It is obvious that olderadults are more prone to heart diseases and hypertension, and need better health care. The Masoumi et al.study conducted in Kermanshah Heart Hospital, Iran,Chart BPareto chart of injured condition40008020004010002000Mo Torcycle185149.849.8Car158942.792.5Heavy cy60PercentFrequency3000Vehicle ured 0.0Figure 3. Pareto charts of transport accidents based on the type of vehicle (chart A) and the injured person (chart B)146Beheshti MH, et al. Accidents Recorded at an Emergency Management Center Using the Pareto Chart. HDQ. 2018; 3(3):143-150.PercentPareto chart of vehicle type
April 2018, Volume 3, Number 3Chart BPareto chart of type of drugsPareto chart of The end result of the 04050002000The end result of the ckofcooperation0Type of atment100centers25000PercentChart A389516.395.710344.3100.0Figure 4. Pareto charts of accidents based on the type of treatment for the injured people (chart A) and the outcome of the mission (chart B)The results of this study showed that transportation accidents accounted for the highest percentage (17.61%)and it is consistent with previous studies. For example,Naghavi’s study reported that in Iran in 2002, 275,000were hospitalized and there were 19,100 road trafficdeaths [17]. Shojaee et al. reported that rate of death intransportation accidents in Chaharmahal Bakhtiari province, Iran, was 41 per 100,000 people [18] and this studyshowed that the largest number of accidents were relatedto driver and passengers. In the study of Taghipour .7Narcotic Carbon monoxide 001008010060300160120PercentFrequency400Pareto chart of type of burn14080500Type of poisoningFrequencyPercentCum%According to the findings of the study, the emergencycenter provided various therapeutic interventions forthe injured people. The 39.4% medications prescription and 0.08% inhalation therapy were the highest andlowest type of action among the therapeutic measures.Chart BPareto chart of type of poisoning700Loss due to accidents is 1.3 percent of GDP in developing countries. According to the media reports, and WorldHealth Organization, Iran has the highest number ofdeaths due to road traffic crashes [20]. The fact that thedriver and the passengers have the highest crash rates,it is important to review the safety majors such as seatbelts, airbags, brakes and the body of the vehicle, andthe vehicle manufacturers should take responsibility forensuring international safety standards.FrequencyChart AYazd, Iran vehicle-pedestrian accidents were the mostcommon type of accident at 39.8% [19].608060404020200Type of burnFrequencyPercentCum%Percentfound that majority of the patients with cardiovasculardisease were in the age group of 60 and 69 years and35.5% of them had hypertension [16]. Therefore, forprevention and control of such diseases, executive andeducational programs should be considered.0Hot liquids6745.345.3Fire Hot substance .5Other64.1100.0Figure 5. Pareto chart of type of poisoning incidents (chart A) and burn incidents (Chart B)Beheshti MH, et al. Accidents Recorded at an Emergency Management Center Using the Pareto Chart. HDQ. 2018; 3(3):143-150.147
April 2018, Volume 3, Number 3The analysis of poisoning accidents revealed that foodpoisoning, medicine poisoning and drug poisoning accounted for more than 80%of total poisoning cases. According to the Shakeri et al. study, the most commoncauses of poisoning are poisoning due to drug and narcotic substances (drug substance 64.6% and narcotics22.9%) [24], which is in agreement with the results ofthis study. Since the most important measure for preventing diseases and poisonings is changing people’slifestyles. It seems that empowering people through education and compliance with rules and regulations canprevent food, pharmaceutical and drug poisoning.Pareto chart of type of tureRuptureAbrasionType of lesionTendemess0221.596.1563.9100.0Both related and non-related transport accidents causevarious damages and injuries, and most of the injuriesare related to tenderness with the frequency of 36.2%and about 80% of the lesions include tenderness,scratches, tears, fractures, and bleeding. The distributionof events recorded by the emergency center is classifiedaccording to the months of the year and analyzed using the Pareto chart. It was found that March recordedthe highest percentage of accidents, and December hadthe lowest. In almost identical results with regards tofrequency distribution of events in different months, itwas observed that the spring had the highest percentageof accidents and the winter had the lowest. In a studyconducted in Kermanshah, Iran, the highest accidentsoccurred during spring [25]. It can be concluded that thereason for increased risk of accidents at the beginningof the year and during the spring may be due to the increase in the number of trips and because a large numberof people indulge in outdoor activities during Noroozholiday. It is possible to prevent accidents by improvingsafety culture and increasing safety awareness throughsocial media, television, radio, and internet.Figure 6. Pareto chart of accidents based on the type of injuryAlso, 46.6% of emergency missions included transfer tohealth centers and 32.8% was outpatient treatment. According to Nagha
Data analysis was performed using Pareto chart as well as Minitabver v.16 and SPSS v.21 software. Results: Based on the results, the highest rate of the accidents (39.79%) were among peopleCited by: 2Publish Year: 2018Author: Mohammad Hosein Beheshti, Roohalah Hajizadeh, Somayeh Farhang Dehghan,