Transcription
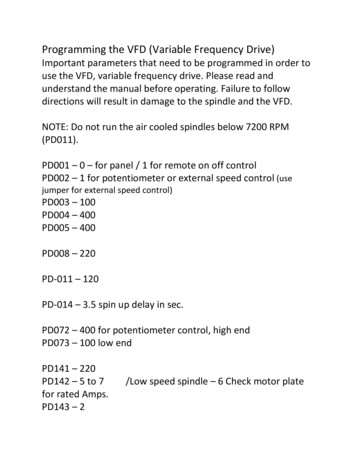
ANALYSIS OF LOAD FREQUENCY CONTROL DYNAMICS BASED ONMULTIPLE SYNCHRONIZED PHASOR MEASUREMENTSMasahide Hojo, Kazuya Ohnishi, Tokuo OhnishiThe University of TokushimaTokushima, Japanhojo@ee.tokushima-u.ac.jp, kazuya-o@ee.tokushima-u.ac.jp, ohnishi@ee.tokushima-u.ac.jpYasunori MitaniOsamu SaekiHiroyuki UkaiKyushu Institute of TechnologyFukuoka, Japanmitani@ele.kyutech.ac.jpOsaka UniversityOsaka, Japansaeki@pwr.eng.osaka-u.ac.jpNagoya Institute of TechnologyAichi, Japanukai.hiroyuki@nitech.ac.jpAbstract - In recent years time stamps of the Global Positioning System can be utilized for precise time synchronization at different remote locations. By the time synchronization and information technology, it becomes available to execute synchronized measurements of large power system. Authors have constructed an online global monitoring system ofthe Western Japan 60Hz power system.This paper investigates dynamic characteristics of frequency oscillation after a disturbance based on measurement results. First, by observing the frequency oscillationsat each point and phase differences among them, global behaviors of the power system are investigated. It is considered how power flow varied in the power system just afterthe disturbance. Secondly, transient behaviors are studiedin detail through the Wavelet analysis. Some interesting interactions among the local power systems can be observedand system performances originated from a Load FrequencyControl (LFC) can be extracted. Finally, frequency variation characteristics by the LFC are studied on a plane of frequency deviation versus phase difference. Then the stiffnessand controlled behaviors of the power system are carefullyconsidered.From these analyses, it is confirmed that the multiplesynchronized phasor measurement system has a great possibility to investigate the global power system in an easy way.Keywords - Global Positioning System, Interconnected power systems, Phase measurement, Load frequency control, Synchronization, Time-frequency analysis, Wavelet transform.1 INTRODUCTIONWESTERN Japan 60Hz power system is a longitudinal and huge power system which consists of sixmajor electric power companies interconnected with eachother by high-voltage ac or dc transmission lines. Dueto its longitudinal structure the power system is knownto have some significant long term oscillation modes. Asconcerns frequency oscillation characteristics, the powersystem may indicate some interesting dynamics becauseof a situation surrounding Load Frequency Control (LFC).First, the all six companies in the power system have recently adopted Tie-line Bias Control (TBC) for increasing importance of tie-line power flow regulation. Secondly, the system dynamics are also affected by indepen-15th PSCC, Liege, 22-26 August 2005dent power producers which do not contribute anything tothe LFC. In the circumstances, dynamics of the frequencyoscillation and its control become not only interesting butalso important issue for power system engineers to keepthe power system reliability.However, it used to be difficult for most of researchersto observe the dynamics of a whole power system because of difficulties in measuring system variables synchronously at appropriate points which are distant fromeach other. In recent years time stamps of the Global Positioning System (GPS) can be utilized for precise time synchronization at different locations even if the measurementpoint is far from the other. Based on the time synchronizing method and recursive Discrete Fourier Transform(DFT) algorithm, time synchronized voltage phasor measurement technologies have been developed [1, 2]. In thecircumstances, useful application studies have just startedall over the world [3, 4].Authors have constructed an online global monitoringsystem of the Western Japan 60Hz power system [5, 6]based on the time synchronized phasor measurement techniques. In the system, seven Phasor Measurement Units(PMUs) [7], which can accumulate time sequential data ofthe voltage phasors synchronously using the time stampsof GPS, are located at seven universities, respectively. Theuniversities are in large cities and each of them belongsto the demand area supplied by the different major electric power company. The PMU uses an outlet on thewall of laboratory for single-phase terminal voltage measurement. Additionally, the PMUs have a network interface for remote access via Internet. The universities areequipped with campus information networks and interconnected with each other, so the accumulated data are automatically collected in data servers by utilizing the wellformed campus information network. Therefore it becomes easy for us to study the power system dynamics bythe global monitoring. Authors now continue the multiplephasor measurement in the power system.This paper investigates dynamic characteristics of frequency oscillation after a disturbance based on the multiple synchronized phasor measurement. The phasor measurement provides relations between phase differencesand frequency deviations.First, by observing the relations, global behaviors ofSession 9, Paper 1, Page 1
the power system are carefully investigated. It is considered by the measurement how power flows varied in thepower system just after the disturbance.Secondly, transient behaviors are studied in detailthrough the Wavelet analysis. It is known that a behavior which originated from the LFC is a long term variation during from a few to ten minutes. The behavior isexpected to be observed in case that the frequency suddenly changes because of a disturbance. In this studytime-frequency analysis based on the Wavelet transformis employed to distinguish the frequency behaviors due tothe LFC. Some interesting interactions among the localpower system are extracted from the transient behaviors.Finally, frequency variation characteristics associatedwith the LFC are studied on a plane of frequency deviation versus phase difference. There is an attractive literature which deals with statistical studies about relationsbetween tie-line power flow and frequency deviation under the LFC [8]. The result of the phasor measurement isexpected to show some similar behaviors discussed in theliterature because the phase difference between some twoareas is closely related to the power flow between them.This paper also presents that the extracted LFC behaviorshows similar dynamics known as relations between tieline power flow and frequency deviations under the LFC.Then the stiffness and controlled behaviors of the powersystem are carefully considered by a statistically method.From these analyses, it is confirmed that the multiple phasor measurement system has a great possibility toinvestigate the global power system dynamics in an easyway.(UPS). By the UPS, the PMU can continue the synchronized phasor measurement for at least 15 minutes in caseof losing its power source.The PMU has 10BaseT network interface and we candownload the data accumulated in the PMU through thewell-formed campus information network. Data serversare located at Osaka University, Nagoya Institute of Technology (NIT), and Kyushu Institute of Technology (KIT)in order to classify the enormous data by PMUs. The phasor data accumulated in the PMUs are automatically collected from every PMU to the data servers by utilizing thecampus network. We can also browse the measured databy every one second on an internet browser, therefore themeasurement system can be operated as an online monitoring system.A measurement process in this system has been carefully designed. To be available for analysis of both shortand long term power system dynamics, one cycle of measurement is decided as 20 minutes and a sampling intervalof the phasor data is 2/60 sec. As the phasor data stored inthe PMUs must be transferred to the data servers, the measurement cycle is accompanied by 10 minutes idling interval, which is used for data transmission from the PMU tothe data servers. Then the 20 minutes mesurement and10 minutes data transmission are repeated alternately byevery PMU. Although continuous measurement is limitedless than 20 minutes by the data transmission interval,most of LFC dynamics can be caught within the measurement interval.: GPS SatellitesFukui Univ.Hiroshima Univ.22.1Osaka Univ.Kyushu Instituteof TechnologyMULTIPLE SYNCHRONIZED PHASORMEASUREMENT SYSTEM15th PSCC, Liege, 22-26 August 2005Nagoya Instituteof TechnologyTokushima Univ.Miyazaki Univ.System ConfigurationAs shown in Fig. 1, authors have constructed the multiple synchronized phasor measurement system for WesternJapan 60Hz power system. The power system consists ofsix power systems depicted as circles in Fig. 1. The sixlocal power systems belong to different six major electricpower company, respectively, and they are interconnectedby ac tie-line (solid line) or high-voltage dc transmissionlines (doted line) with each other. PMUs are located atseven laboratories of university in each of six power systems as summarized in Table 1. The power system including Osaka University supplies the largest demands in thesix local power systems.The phasor measurement system employs PMUs manufactured as commercial products, NCT2000. The PMUcan measure a single-phase instantaneous voltage at 100Voutlets on the wall, with correcting its internal clock basedon the time stamps of GPS. As the PMU uses the timestamps of GPS, the time synchronization among PMUslocated at distant place can be easily accomplished.In order to continue the synchronized phasor measurement even if an interruption or a voltage sag occurs at theoutlet, each PMU has an Uninterruptible Power Supply: PMU with UPS: AC: DCInternetFigure 1: Multiple phasor measurement Universities with a PMUNagoya Institute of Technology (NIT)Osaka UniversityFukui Universitythe University of TokushimaHiroshima UniversityKyushu Institute of Technology (KIT)Miyazaki UniversityTable 1: PMU distributions.2.2Phasor Measurement TechniqueBased on the recursive DFT algorithm, the voltagephasor is given by MM 2 V̇ vk sin kθ jvk cos kθ , (1)Mk 1k 1where vk is sequential data of the instantaneous voltage of100V outlet measured through A/D transformer, M is thenumber of times for sampling of the voltage and θ is thesampling angle. In the case of this apparatus, M 96 andSession 9, Paper 1, Page 2
θ 3.75 [deg]. From (1), we have the phase angle δ asfollows: 1 {V̇ }.(2)δ tan {V̇ }The phase angle δ is accumulated in the PMU as time sequential data.General Characteristics of Accumulated DataThe phase angle δ is calculated as a phase differencebetween observed instantaneous voltage and 60Hz reference signal produced by the PMU based on the timestamps of GPS. Without information about system parameters and configuration, both the phase angle value itselfand the phase difference value itself are not so useful because, for example, the phase angle can be directly shiftedby an angular displacement at a wye-delta transformer.On the other hand both varying phase angle and varying phase difference between two points give us a veryuseful information. Increasing phase angle represents thatthe frequency of the observed voltage is higher than thesystem nominal frequency, 60Hz. Decreasing phase angle means that the frequency of the observed voltage islower than 60Hz. The time derivative of phase angle corresponds to the deviations of system frequency. So thefrequency deviations can be calculated asδn 1 δn, fn 360 tn(3)Accuracy of Measured DataThe PMU corrects its internal clock by the time stampsof GPS. A time error of the clock is guaranteed within 1µs. In this case, phase angle δ of the terminal voltage atthe outlet on the wall is used as measured data. An errorof phase angle is guaranteed less than 0.1 deg. The accuracy of time and phase angle is enough to analyze thefrequency oscillations as a whole power system becauseoscillations with short term or small amplitude less thanthe error are out of the range for the LFC.3 OBSERVATION OF FREQUENCYOSCILLATIONS AFTER A DISTURBANCEIt is known by a press release from an Electric PowerCompany that a generator of the company was droppedout by an accident at 10:00 on May 19, 2004. The generator is in Shikoku where the University of Tokushima is,15th PSCC, Liege, 22-26 August 2005Wednesday, May 19, 200420 minutes from 9:50 to 10:102/60sec36000 0.1 deg.1 µsTable 2: Measurement conditions.where tn [s] is a sampling interval of sequential phasedata δn and N is the number of accumulated phase angledata. Therefore frequency variation can be observed bythe PMU with accumulating the sequential frequency deviations fn .The variation of phase difference between two pointsmeans that the power flow between the two points haschanged. Increasing the phase difference represents thepower flow has been increased, and decreasing the phasedifference means the power flow has been decreased, conversely.2.4DateIntervalSampling intervalNumber of dataAccuracy of angleAccuracy of clockFig. 2 shows frequency deviations calculated by (3)with phase angle data measured at each university. Asconcerns about the frequency oscillation measured at theUniversity of Tokushima, the maximum value of the frequency deviations is 0.0833Hz, the minimum value is 0.1358Hz, and the averaged frequency is equency deviations [Hz]2.3and its generating power was 566MW at that time. Thepress release also says that, although a generating powerdecreased by 536MW with the accident, there was no supply problem and the power system continued its properoperation. The decreased power 536MW was 7.8 % of6860MW, which is the available power of the local system.Then, this paper picks up the measured data from thestocked data in the data server, which includes at the timeof the accident. The measurement system accumulatedfrom 9:50 to 10:10 on Wednesday, May 19, 2004, in JapanStandard Time, by every 0.033 seconds. Measurementconditions are summarized in Table 2. Unfortunately, wedo not have mesurement results for 10 minutes both justbefore 9:50 and after 10:10 because the 10 minutes durations were reserved for data transmission interval. However, the 20 minutes measurement interval gives us a lot ofinformation about the system dynamics and the followingsections reveal them.Fukui Univ.0.050.00-0.05-0.10Univ. of Tokushima0.050.00-0.05-0.10Osaka Univ.0.050.00-0.05-0.10Hiroshima aki Univ.510time[min]1520Figure 2: Frequency variations in the power system.It can be seen in Fig. 2 that frequency oscillations withshort term and small amplitude indicate some individuali-Session 9, Paper 1, Page 3
15th PSCC, Liege, 22-26 August 2005knowing neither the system parameters and configurationswhich lie among the PMUs nor a value of steady-statepower flow.There is a HVDC transmission line between Shikokuand Kansai, and it normally carries electric power generated at a power plant in Shikoku to Kansai which is a largedemand area. If the HVDC transmission line compensatedsomewhat of the shortage of supplied power in Shikoku,the multiple phasor measurement system could hardly observed a power flow variation on a HVDC transmissionline because the power flow variation does not appear as achange of phase angle.Although these difficulties are left, it should be notedthat the above qualitative considerations can be drawnonly by the data measured with PMUs which are placedat the laboratories of university. The multiple phasor measurement system is useful to consider such a large powersystem behavior based on observed actual data.12degreesFukui Univ.12degreesUniv. of Tokushima12degreesOsaka Univ.12degreesHiroshima Univ.KIT12degreesphase differences [deg]Miyazaki Univ.12degreesties. The short term oscillation may be influenced by localload variations on the abrupt shifts of phasor because thePMU measured at 100V outlets on the wall of laboratory.Then the individualities are supposed to originate from themeasurement system. On the other hand, frequency oscillations with long term indicate some important behavior asa global system. In order to investigate global system behaviors, frequency oscillations with short term and smallamplitude are neglected and the long term frequency oscillations are carefully investigated in this paper.In Fig. 2, every frequency deviation shows a remarkable sudden decrease at 10min. It is the time when thegenerator dropped out as described above, therefore thedecrease of frequency deviation is assumed to be causedby a shortage of supplied electric power, which originatedin the accident.On the other hand, long term frequency oscillationsare almost identical with each other regardless of the disturbance. This means that the all local power systems keptsynchronization and the interconnected power system operated properly, too. The fact corresponds with the pressrelease by the electric power company.Variations of phase difference between each universityand NIT are shown in Fig. 3. In Fig. 3, the only phasedifference between the University of Tokushima and NITshows a sudden change at 10min. It is the time when theaccident occurred at the power plant, therefore the changeof phase difference is also caused by the accident. On theother hand, it is known that a phase difference and a powerflow between two point have a close relation to each other.Changing power flow between Shikoku and Chubu arearesults in varying the phase difference between the Univ.of Tokushima and NIT. Taking these into account, it canbe said that the shortage of supplied power was caused inShikoku area by the accident and some amount of powerflowed into Shikoku area, resulting in the change of phasedifference between the Univ. of Tokushima and NIT.Fig. 3 also indicates behaviors of the other local area.Chubu, Kansai, Chugoku and Shikoku is interconnectedby AC tie-line from east to west in this order, as shownin Fig. 1 and Table 1. However, phase differences between NIT and the local areas except Shikoku display little change at the time of accident. Accordingly, it canbe said from the results that the change of phase difference between the Univ. of Tokushima and NIT is nearlyequal to the one between the Univ. of Tokushima and Hiroshima Univ. in Chugoku. This mentions that changesof power flow hardly occur among the local areas exceptShikoku at that time and it happened just between Shikokuand Chugoku. Therefore, it can be concluded that, after the shortage of supplied power in Shikoku occurredby the accident, power flow from Chugoku and Kansai toShikoku increased and the increased power flow appearedas a sudden change of phase angle difference only betweenShikoku and Chugoku.However, it is difficult to decide the increased amountof power flow. The value of phase difference cannotbe straightly translated to the value of power flow with0510time [min]1520Figure 3: Variations of phase difference based on phase angle measuredat NIT.4 OBSERVATION OF TRANSIENTPHENOMENA BY WAVELET ANALYSISAs described above, the shortage of supplied power inShikoku might be supported by its neighboring areas withincreasing the power flow from them to Shikoku. Afterthe disturbance, phase difference between the Universityof Tokushima and NIT returned slowly to its initial valuejust before the disturbance, as shown in Fig. 3. The phasedifference between the University of Tokushima and Hiroshima University can be assumed to have behaved likeit, too. Fig. 2 shows that the frequency deviations also returned to zero value simultaneously. These behaviors areseemed to depend on LFC which might be applied to thepower system after the disturbance.Session 9, Paper 1, Page 4
frequency deviations [Hz]0.010.00Eastern UniversitiesNIT, Fukui Univ.620640time [sec]660680Figure 4: Behaviors of the local system derived by Wavelet analysis.15th PSCC, Liege, 22-26 August 2005Miyazaki Univ.20-2-4x10KITFukui Univ.O
face for remote access via Internet. The universities are equipped with campus information networks and intercon-nected with each other, so the accumulated data are auto-matically collected in data servers by utilizing the well-formed campus information network. Therefore it b