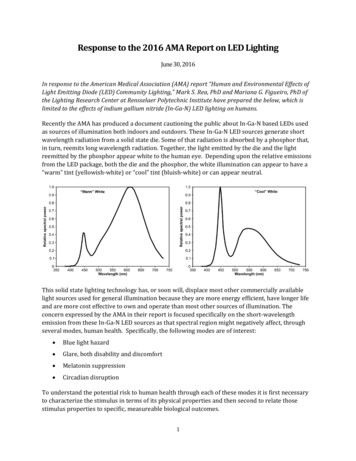
Transcription
Association of State and Provincial Psychology BoardsExamination for Professional Practice in Psychology (EPPP)2015–2016 Annual Technical ReportExam Dates: August 15, 2015–August 7, 2016Prepared by:Pearson VUEAugust 2016Pearson VUE Confidential
Non-Disclosure and Confidentiality NoticeThis document contains confidential information concerning Pearson’s services, products, data securityprocedures, data storage parameters, and data retrieval processes. You are permitted to view and retain thisdocument provided that you disclose no part of the information contained herein to any outside agent oremployee, except those agents and employees directly charged with re viewing this information. Theseagents and employees should be instructed and agree not to disclose this information for any purposesbeyond the terms stipulated in the agreement of your company or agency with Pearson.C opyright 2016 NC S Pearson, Inc. All rights reserved. The PEARSON logo is a trademark in the U.S.and/or other countries.Pearson VUE Confidential
Tables of ContentsScope of Work .1Executive Summary .1Background.1Candidate Pe rformance .2Candidate Volume and Pass Rates . 2Speededness Analysis . 2Examination Results .3Measurement Model . 3Equating and Scaling . 3Test Scores . 4Reliability . 5Testing Period Summary Statistics .5Re fere nces .6Appendix A. Target Test Spec ifications .7Appendix B. Summary Statistics Across State and Prov inc ial Jurisdictions .8Pearson VUE Confidential
Tables and FiguresTableTableTableTable1.2.3.4.Candidate Volume and Pass Rates: F irst- Time Candidates .2Candidate Volume and Pass Rates: Repeat Candidates .2Scaled-Score Summary Statistics by Degree .4Candidate Volume and Pass Rates across Testing Periods .5Pearson VUE Confidential
Scope of WorkThe Examination for Professional Practice in Psychology (EPPP) is offered by the Associationof State and Provincial Psychology Boards (ASPPB). The EPPP is designed to assist state andprovincial boards of psychology in determining licensure and certification of candidates. Thisreport includes the development, administration, and scoring of the EPPP for the August 15,2015–August 7, 2016 administrations.Executive SummaryA total of 6,117 candidates took the EPPP examination between August 15, 2015 andAugust 7, 2016. The overall pass rate for first -time candidates was 74.0%, whereas thepass rate for repeat test takers was 39.4%. Moreover, a higher reported academic degreegenerally related to a higher pass rate.Timing analysis provides little indication that the exams were speeded. That is, candidatesdid not appear rushed to complete the exam items in the allotted time. Out of the 6,117total candidates, 73 (1.2%) were not administered all test questions within the allottedtime.The coefficient alpha estimate of reliability for the EPPP forms was acceptable at 0.936 forForm 7168030, 0.921 for Form 7168040, 0.918 for Form 7168050, 0.920 for Form7168060, and 0.925 for Form 7168070.BackgroundPearson VUE began administering the EPPP exams for ASPPB in February 2015 viacomputer‐based testing. Four EPPP operational test forms (7168030, 7168040, 7168050,and 7168060) were administered continuously between August 2015 and January 2016, andfour EPPP operational test forms (7168040, 7168050, 7068060, and 7168070) wereadministered continuously bet ween February 2016 and August 2016. Each form contains175 operational items plus one of one to four form-specific blocks of 50 pretest items 1. Thepretest blocks associated wit h any given form differ from the pretest blocks associated withany other form. Moreover, pretest blocks in August 2015–January 2016 across all formsdiffer from the pretest blocks in February 2016–August 2016. Test specifications can befound in Appendix A.Because all data in this report are based solely on operational items, each set of test formssharing the same operational items is treated as one combined form in the report tables.ASPPB also provides multiple translated exam forms—two each in Spanish and French—thatare offered for candidates seeking licensure in Puerto Rico (for the Spanish forms) orCanada (for the French forms). Candidates who take the translated forms are excluded from1Form 7168030 had all four pretest blocks administered between August 2015 and January 2016. Form 7168040had two unique pretest blocks administered between August 2015 and January 2016, and two different pretestblocks administered between February 2016 and August 2016. Form 7168050 had two pretest blocks administeredbetween August 2015 and January 2016, and one different pretest block administered between February 2016 andAugust 2016. Form 7168060 had one pretest block administered between August 2015 and January 2016, and onedifferent pretest block administered between February 2016 and August 2016. Form 7168070 had one pretestblock administered between February 2016 and August 2016.Pearson VUE ConfidentialPage 1
any subsequent analyses. Pearson VUE will continue to monitor the volume and pass ratesof the translated forms for any abnormalities.Candidate PerformanceCandidate Volume and Pass RatesA total of 6,117 candidates took the EPPP examination from August 15, 2015 to August 7,2016. Of those candidates, 4,755 (77.7%) were first-time test takers.Tables 1 and 2 show the pass rates for first-time and repeat candidates broken down byhighest degree obtained. Note that Form 7168030 was only offered until January 31, 2016,and Form 7168070 was only offered starting on February 1, 2016.Table 1. Candidate Volume and Pass Rates: First-Time CandidatesExam ssNrate1,06974.97168050PassNrate1,081 7.3467875.073.2264,75565.474.0UnknownTotalTable 2. Candidate Volume and Pass Rates: Repeat am nownTotalCandidate volume, broken down by jurisdiction, can be found in Appendix B. Candidateswho took the translated exam forms are also included in Appendix B.Speededness AnalysisThere is little indication that any form was speeded. That is, candidates did not appearrushed to complete the exam. Out of 6,117 total candidates, 73 (1.2%) were notadministered all test questions within the allotted time.Pearson VUE ConfidentialPage 2
Examination ResultsAll statistics presented in this section are based solely on first -time candidates.Measurement ModelItem response theory (IRT) is a general theoretical framework associated with severalmathematical models that assumes test responses are based on the interaction between theattributes of candidates as well as test items. The advantage of using IRT models in scalingis that all of the items measuring performance in one latent construct can be placed on thesame scale of difficulty. Placing items on the same scale across years facilitates the creationof equivalent forms each year.A Rasch IRT model was used for item calibration using Winsteps (Version 3.92.1; Linacre,2016). Under the Rasch model, the probability of a candidate answering an item correctly isa function only of the item’s difficulty and the candidate’s ability. Mathematically, theprobability of candidate i correctly answering item j can be defined asexp ( 𝜃 𝑏 )𝑃𝑖𝑗 1 exp (𝑖𝜃 𝑏𝑗 ),𝑖(1)𝑗where𝜃𝑖 represents the ability of person i, and𝑏𝑗 indicates the difficulty of item j.One can regard 𝜃 and 𝑏 as depicting the general case, where individual candidate abilitiesand item difficulties are a subset. In the case of Equation 1, both 𝜃 and 𝑏 are expressed onthe same metric ranging over the real number line, with greater values representing eithergreater ability or greater item difficulty. Note that as ability increases for any given item(i.e., 𝜃𝑖 increases for any fixed 𝑏𝑗 ), exp(𝜃𝑖 𝑏𝑗 ) increases, which implies that 𝑃𝑖𝑗 increases.Therefore, increased ability corresponds to a concomitant increase in the model-predictedprobability of answering any item correctly.Equating and ScalingEquating was accomplished using the operational items’ predetermined measures from thecalibrated item bank (common item equating).The EPPP is scaled so that all candidates receive a score in the range of 200 to 800, with ascaled cut score of 500. The current scaling tables were provided by the previous vendor. Inthe future, scaling will be achieved by applying a linear transformation to the logit abilitiesobtained during equating. The linear transformation will take the generalized form of scaledscore A*θ B (truncated to the next lowest integer).Jurisdictions can report scaled scores in a different metric than those recommended byASPPB. For instance, New York provides scaled scores converted to a range of 51 to 99,with a scaled cut score of 75. All statistics and graphs presented in this section use thestandard scaled score rather than any converted scaled score.Pearson VUE ConfidentialPage 3
Test ScoresTable 3 contains scaled-score distributions for each operational form, broken down byhighest degree obtained.Table 3. Scaled-Score Summary Statistics by DegreeExam 168070MastersUnknownAllPearson VUE ConfidentialNPage 4
ReliabilityReliability, as it applies to testing, is the consistency or reproducibility of the observed examscores. Test reliability is directly related to score stability and standard error and, as such, isan essential element of fairness and validity. A common estimate of test-score reliability isCronbach’s alpha (α), which is an indicator of the exam’s internal consistency (Cronbach,1951). The reliability of the test is then estimated by considering how well the items thatreflect the same construct yield similar results (or how consistent the results are fordifferent items that reflect the same construct measured by the test . High reliabilityindicates that scores are consistent and not unduly influenced by random error. A generalrule of thumb for high-stakes tests is that α should be at least 0.80, but preferably 0.90 orhigher (Nunnally & Bernstein, 1994). The reliability for Forms 7168030–7168070 betweenAugust 15, 2015 and August 7, 2016 were found to be acceptably reliable at 0.936, 0.921,0.918, 0.920, and 0.925, respectively.Testing Period Summary StatisticsIn Table 4, summary statistics for number of candidates tested and pass rate are presentedacross all exams for each testing period that Pearson VUE has been responsible for examdevelopment or measurement services.Table 4. Candidate Volume and Pass Rates across Testing PeriodsExamformTesting ate7152.1TotalPassNrate79770.97168000Feb 2015–Aug 201571680107168020Feb 2015–Aug 2015Feb 2015–Aug 0Feb 2015–Aug 2015Aug 2015–Feb 0Aug 2015–Jan 2016Feb 2016–Aug 050Aug 2015–Jan 2016Feb 2016–Aug 201649467471.975.213920931.736.47168060Aug 2015–Jan 2016Feb 2016–Aug .167.871.97168070Feb 2016–Aug 201667873.224326.792160.9Pearson VUE ConfidentialPage 5
ReferencesCronbach, L. (1951). Coefficient alpha and the internal structure of tests. Psychometrika,16, 297–334.Linacre, J. M. (2016). Winsteps (Version 3.92.1) [Computer software]. Beaverton, OR:Winsteps.com.Nunnally, J. C., & Bernstein, I. H. (1994). Psychometric theory (3rd ed.). New York, NY:McGraw-Hill.Pearson VUE ConfidentialPage 6
Appendix A. Target Test SpecificationsDomain areaEmphasisNo. of itemsOperational Pretest12Biological Bases of BehaviorCognitive-Affective Bases of Behavior12%13%212366–734Social & Cultural Bases of BehaviorGrowth & Lifespan Development12%12%21216656Assessment & 57778Research MethodsEthical/Legal/Professional Issues8%15%142647–8100%17550TOTALPearson VUE ConfidentialPage 7
Appendix B. Summary Statistics Across State and Provincial JurisdictionsJurisdictionAbbreviation2015 a2015–2016 bPass 62.572.190.063.6179370.671.02712677.869.0British 31606275.659.72349375.260.2District of tuckyKSKYLouisianaMassachusettsPass rateTotalN159NPass 70.6—New BrunswickNorth CarolinaNorth �921477.257.11542175.357.1New HampshireNew landNL11New MexicoNova 661.984.076.7NevadaNew .31772674.688.5Pearson VUE Confidential75.9—73.743.5Page 8
A3910170236PEPQ100077.175.4——109337Prince Edward ISLQuebec87.276.2——1080.775.7——Puerto RicoRhode IslandPRRI22234.595.7474729.883.0697021.787.1South CarolinaSouth 3.5TexasUtahTXUT12118VirginiaUS Virgin .31770.62965.584.111583.519783.8WisconsinWest 269.467.0Note. All candidates, including those who took translated forms, are included.aIncludes exams from Feb. 1, 2015–Aug. 14, 2015. bIncludes exams from Aug. 15, 2015–Aug. 7, 2016.Pearson VUE ConfidentialPage 9
The EPPP is scaled so that all candidates receive a score in the range of 200 to 800, with a scaled cut score of 500. The current scaling tables were provided by the previous vendor. In the future, scaling will be achieved by applying a linear transformation to the logit abilities obtained during equating.File Size: 500KB