Transcription
FUTURE OF PATIENTFINANCIAL ENGAGEMENTMike Trilli, Aite GroupMark Archer, NoggintechsSteve Kramer, ACI Worldwide
Today’s SpeakersMike TrilliMark ArcherSteve KramerSenior AnalystAite smarcher@noggintechs.comVice PresidentACI Worldwidesteve.kramer@aciworldwide.com
Join the Conversation on Twitter#BeckersHRTweet your perspectiveSee exclusive survey results
Agenda1. New threat to your financial security2. Examples of analytics increasing collections3. Patient demands4. How to get started5. ROI
New Threat to Your FinancialSecurityAite Group
New High Deductible Plan Market DynamicsIncrease in number of consumers enrolled in high deductible plansConsumer impactChange to personal financial modelsProvider impactChange to business revenue modelsIncrease in the total number of consumers paying bills to providersConsumer impactExpect a familiar and easy paymentexperienceProvider impactCompeting for share of consumer bill paymentwalletIncrease in the total number of bills consumers pay to providersConsumer impactNeed help to pay larger billsProvider impactDesign pre, point, and post service paymentexperience with financial engagement in mind
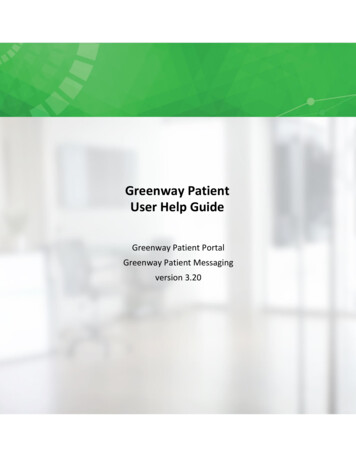
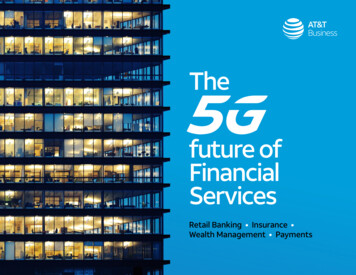
Changes to Providers’ Patient PopulationsD i s tr ibution of H e al th Pl an Enr oll ment f or C ov ered Wor kersby Pl an Ty pe , 2 0 12 t o 2 0 1220%8%2013POS2014HMO2015HDHPSource: KaiserPPO15%9%2016
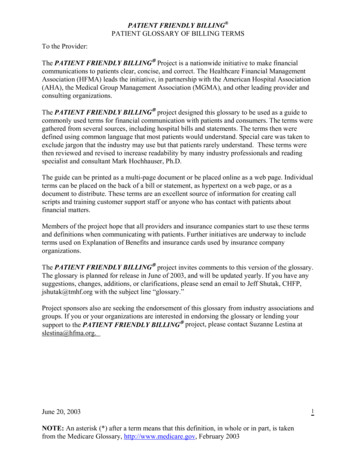
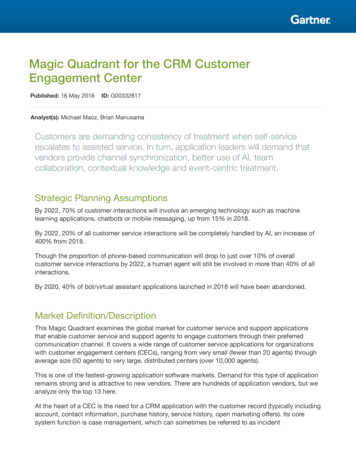
Consumers are Emerging as a Healthcare PayerTotal U.S. Healthcare Consumer Out-of-Pocket Payments, 2015 to e2019(In US billions) 515.1 445.7 405.9 476.9 38.2 423.8 31.2 21.9 17.920152016Totale2017e2018YOY incremental payments volumeSource: Aite Groupe2019
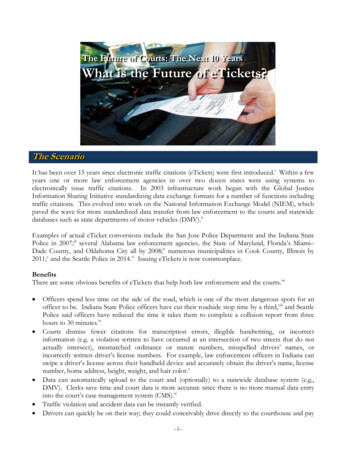
Consumer’s Bill Payment WalletQ. Which of the following bills do you pay or have you paid in thelast 12 months? (N 2,429)93%Electricity (n 2,250)88%Cable/satellite TV (n 2,143)83%Wireless phones (n 2,009)79%Auto/car insurance (n 1,914)77%Major credit cards (n 1,862)68%Water/sewer (n 1,648)63%Gas/oil (n 1,527)61%Vehicle registration (n 1,239)54%Property insurance (n 1,321)51%Garbage (n 1,239)Life insurance (n 1,474)45%Health insurance (n 1,077)44%Medical bills (n 1,034)43%Property taxes (n 995)41%Landline phones (n 989)41%Source: Aite Group Medical bills are the 13th most frequent bill a consumer pays out of 29categoriesConsumers bring these other bill payment experiences into healthcareOther bill payment experiences are easier than medicalSource: Aite Group
Current Pay & Chase Practices Unsustainable 30% of patients walk out of providers’ doors without paying anything Patients average 3.3 billing statements before paying an outstanding balance Collection agencies recover 16 for every 100 owedSource: MGMA
The New Patient Engagement Model – Personal and DigitalProviderPatientPre-servicePoint of service Calculate propensity-to-pay scorebased on the estimated costs andeligibility of services to berendered Estimate cost of billed services billed Calculate propensity-to-pay score Deliver personalized financial conversationusing auto generated scripts Enroll patient in a recurring or one-timepayment option Offer electronic billing enrollment Kick-off patient-portal login process anddigital experience Present a single, consolidated digital bill Offer online bill payment Deliver personalized communicationsbased on patient preferences Receive estimate cost andpayment options May enroll in payment options orwait until appointment Engages in financial conversation based offestimated amount owed Enrolls in a payment option Makes bill receipt and paymentpreferences known in portal Look up bill contents or pays bill per arecurring payment plan, with a healthsavings or flexible spending account, orwith other personal accountsSource: Aite GroupPost-service
PollHow do you determine how much a patient can pay?14
Bills and Payments are Digital Engagement LeversBillPaymentsQ. Where do you typically go to look up your electronicmedical bill? (n 1,909 bills)Do not look up8%Percentage of Consumer Out of Pocket Medical Bill Payment Spendby ChannelDirect debit , 6%Other type ofwebsite3%Do not know , 2%Phone, 7%Provider websiteor mobile/tabletapplication32%Mail, 31%Bank website ,10%Bank online25%In person, 14%Provider website,29%My email inbox32%Source: Aite Group
Digital Bills lead to Digital PaymentsDigital bills lead to digital paymentsDigital bills lack penetrationPayment Channels Used By Type of Medical Bill Delivery MediumI get an electronic bill(n 558 bills)14%3% 11%56%Q. How do you currently get your health insurance bill?(n 11,624 bills)I get both a paperand an electronicbill, 10%17%I get an electronicbill, 11%I get both a paper billand an electronic bill(n 702 bills)I get a paper bill in themail (n 4,379 bills)9%7%6% 10%Direct debit15%15%Phone51%18%29%In personI make thispayment, but Idon't get a bill,15%40%OnlineMailSource: Aite GroupI get a paper bill inthe mail, 63%
Section 1 Questions
Examples of Analytics IncreasingCollectionsNoggintechs
Improving The Entire Patient Revenue CycleAppointment MadePaymentPropensity to PayAppointmentPropensity to PayeBillPaymentSegmentationSMS, Email, Evoice, Live Calls, Mobile / Web Access
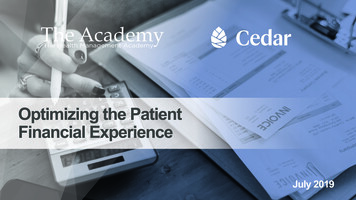
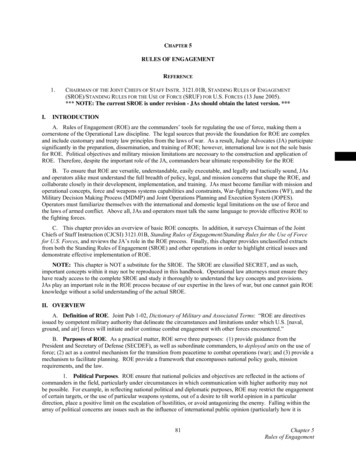
Bringing Intelligence to Medical Debt CollectionPropensity to Pay – Patient Strategy FoundationPopulation Odds 7:3(7 bads for 3 goods)Percent of populationBadsGoods100:11:100
How to Think About Segmentation and Actions
PollWhen your staff talks to a patient, which of these do they changebased on patient’s ability to pay?14
PollWhen a patient comes to your website, which of these does yourwebsite change based on patient’s ability to pay?14
Increasing Self-Pay After Insurance (SPAI)Total SPAI OwedIntelligent SettlementBespoke Pay PlanOffersEngagementRewardsMessage Tone& FrequencyTuningBroadenchannelsSPAIPaid
ResultsActual Day 1 to day 59 CollectionPercentageActual 60 Patient Balances Cum Lift Curve(static pool)35%(static th 1Month 2 ChampMonth 3 ChalWeek 0Week 1Week 2 Week 3 ChampWeek 4Week 5 ChalWeek 6Week 7
ResultsDay 60 Pool Worked Up to Day 12035%30%25%20%15%10%5%0%Business as UsualNumber of PaymentsChallenger StrategyDollars Collected
ImpactPayment Rate From Day Of AdjudictionFlow to 52%50%48%306090BAU Champion120Challenger150180BAU ChampionFlow to LossChallengerIncremental Cash
Section 2 Questions
Patient DemandsACI Worldwide
Patients Want Easier-to-Read Bills88%of patients wantan easier to read healthcare bill.Source: Aite Group’s How Americans Pay Bills sponsored by ACI Worldwide
Options, Options, OptionsHow Patients Want the Payments Experience Improved80%5:38Tuesday, June 6MESSAGES60%1m agoAppointment reminder:Please note you have anoutstanding balance of 50which is due on or beforeyour appointment.40%Press for more20%Press home to unlock0%Convenient payment channelsMultiple funding optionsPayment plansSource: Aite Group’s How Americans Pay Bills sponsored by ACI Worldwide
Beyond Options, Patients Want Faster and Safer PaymentsHow Patients Want the Payments Experience ImprovedSecuritySpeedImmediate payment confirmation0%20%40%60%80%100%Source: Aite Group’s How Americans Pay Bills sponsored by ACI Worldwide
How to Get StartedOne YearTotal revenueSelf pay after insurance (SPAI) 500,000,00020%Industry average net flow to loss59.30%New net flow to loss44.90%Incremental SPAI dollars collected1Provide ROI to CFO2Easy technology integration3Start collecting more 14,400,000Answer the PollActual results may vary to projection, driven by local market conditions and the level of operating sophistication and efficiency of the client.The projections above assume a baseline of immature operating sophistication and efficiency. Incremental SPAI collected is net of paid POS co-pays.
Status quo is not an option15
Questions?billpay@aciworldwide.com
Collection agencies recover 16 for every 100 . Bringing Intelligence to Medical Debt Collection Bads Goods Population Odds 7:3 . Aite Group’s How