Transcription
The Theory of ConstraintsProductivity Metrics in Software DevelopmentPhoto by aimee n. Licensed under Creative Commons.IntroductionThis paper is largely based on the work of David J. Anderson, in “Agile Management For SoftwareEngineering”. It also includes some of my own interpretations and understandings of the Theory ofConstraints. The original intent of this paper was to facilitate the discussion of productivity and metricsin the Development Department at McLane Advanced Technologies, LLC. This paper is not intended tobe a comprehensive or exhaustive discussion of the points within, but it intended to spur additionalresearch and conversations. I hope you enjoy reading it as much as I enjoyed writing it.The Introduction: Productivity Metrics In Software Development Copyright 2009 Derick Bailey. All Rights Reserved.1
INTRODUCTION . 1THEORY OF CONSTRAINTS . 3THROUGHPUT ACCOUNTING . 4METRICS IN TOC . 4PRODUCTION METRICS.4Inventory (V) .4Quantity: Unit of Production (Q) .5Lead Time (LT) .5Production Rate (PR) .5Optimizing Lead Time (LT) vs. Production Rate (PR) .5FINANCIAL METRICS .6Investment (I) .6Operating Expense (OE) .7Throughput (T) .7Maximizing Net Profit (NP) and Return On Investment (ROI) .7Average Cost Per Function (ACPF).7ADDITIONAL METRICS FOR THE BUSINESS OF SOFTWARE DEVELOPMENT .7APPLYING TOC TO SOFTWARE DEVELOPMENT . 8ESTIMATING SOFTWARE DEVELOPMENT .8MONITORING PRODUCTIVITY .8DEFINING METRICS FOR METHODOLOGIES.9SDLC (“waterfall” Software Development Lifecycle) .10Extreme Programming (XP) .10Others .10REFERENCES. 11Additional Sources .11CONTACT INFORMATION . 11COPYRIGHT NOTICE AND LICENSING . 11The Introduction: Productivity Metrics In Software Development Copyright 2009 Derick Bailey. All Rights Reserved.2
Theory of ConstraintsThe core of the Theory of Constrains (TOC) is that for any given system, at any given time, there will beat least one constraint on that system, determining how quickly the system can produce.TOC, applied to manufacturing, seeks to identify bottlenecks in the production line. Theunderlying assumption is that a production facility is only as fast as the slowest process in thechain. As a general rule, TOC assumes that a value chain is only as strong as the weakest link inthe chain. The capacity of the weakest link is the current system constraint.- David Anderson, “Agile Management for Software Engineering”[1]TOC is a systems approach that looks at every part of a system, from concept to cash. Individual stepsare not considered to be of highest priority – that is, TOC does not optimize a single step in a system toensure that this single step is working to its full capacity. Instead, TOC‘s primary focus is to maximize thethroughput of a system. Given the knowledge of the system’s constraints, it seeks to increase theproduction capabilities of that system, while reducing the cost of production and shortening the timeneeded to produce.There are five basic steps outlined by TOC, to accomplish these goals:1. Identify the constraint(s)2. Exploit the constraint to maximize productivity3. Subordinate all other steps or processes to the speed or capacity of the constraint4. Elevate the constraint – in other words, work to remove the current constraint, leading to highercapacity or production rate for the entire system5. Lather, rinse, repeat. Although TOC was originally a system for improving the production capabilities of manufacturing, it canbe applied to other industries – including software development. David Anderson’s book is essentially a300 page case study on how Sprint.com operates their software development efforts and other relatedprocesses and services.The Theory of Constraints: Productivity Metrics In Software Development Copyright 2009 Derick Bailey. All Rights Reserved.3
Throughput AccountingThroughput Accounting is also a systems approach – it examines the entire cost structure of a system,from concept to cash. This is in direct opposition to standard cost-accounting systems, which seek tomaximize the production rate of single steps in a given system, with no regard for the productioncapacity of the entire system. The goal of applying Throughput Accounting with TOC is to increase thethroughput of the system while decreasing the inventory and investment, and decreasing the operatingexpenses of that system.At this point, there is no real need to distinguish between TOC and Throughput Accounting. Therefore,they will both be referred to as TOC.Metrics in TOCThere are a few high level categories of metrics that can be found in TOC: Production metrics andFinancial metrics. Production metrics help us to measure how much of what we are producing and howquickly we are producing it. The financial metrics use the production metrics to tell us the cost and profitof the software that we are producing.For simplicity in explanations, I am going to assume that a single feature or end-user function is how weare tracking the development efforts. This is only one way of tracking, though. There is additionaldiscussion on applying the metrics of TOC to various methodologies, later.Production MetricsThe production metrics measured by TOC include Inventory (V) Lead Time (LT) Quantity: Units of Production (Q) Production Rate (R)Inventory (V)Inventory in software development is not as straight forward as manufacturing. What are the “rawmaterials” or “unfinished goods” that we need to track as inventory? What this comes down to, is howwe track productivity through our system. Anything that moves through our system in consideredinventory when it is not actively being worked on. This includes any ideas that we have for features andfunctionality in the system, and unfinished work currently waiting on something – people to work on it,answers to questions, etc, and even finished work that is not yet delivered to the customer.The Throughput Accounting: Productivity Metrics In Software Development Copyright 2009 Derick Bailey. All Rights Reserved.4
The cost of inventory storage in software development is negligible. We use source control anddocument management systems to store this inventory, reducing the storage cost down to almostnothing. However, the intellectual cost of inventory is significant. When the system puts asideunfinished work for a period of time, there is a minimum amount of effort that is required to re-asseswhere the work was left and whether or not the existing design and functionality is still valuable andcorrect. Any unfinished work that is no longer valid for any reason is re-work (all re-work is waste), andthe cost incurred during the production of the unfinished work must be written off as OperationalExpense (OE - discussed later).Quantity: Unit of Production (Q)This is the total number of units of production that have moved through the software developmentsystem, to date. Q can be incremented at the time a feature or function is complete, that is “done, done,done”[2] – ready to be delivered to the customer. However, any feature or function that is not deliveredto the customer yet, is considered inventory. If a feature is done and the customer then decides thatthey do not want the feature, the cost of producing that feature must be written off as OperationalExpense, and Q is not incremented for the feature.Lead Time (LT)Lead time is the time it takes to move a feature from initial idea, through the system, delivered to thecustomer. That is, the time it takes to product one unit of production (Q).Production Rate (PR)Production rate is the number of units (Q) produced during a given period of time. That is, how manyfeatures or functions were developed to completion during a given period of time – 3 units per week; 2units per month; etc.Optimizing Lead Time (LT) vs. Production Rate (PR)It is preferable to focus improvement efforts on the Lead Time of a software development system,rather than the Production Rate. A decrease in Lead Time will increase the Production Rate. However,focusing on Production Rate does not always decrease Lead Time. The net effect of these changes –positive or negative – has a corresponding affect to the financial metrics of the development system.Focusing on Lead Time allows a software development team to rapidly produce the features andfunctions that a customer wants, as soon as they ask for them. A team may only produce 4 units (Q) permonth - but if the Production Rate is 1 per week, then the customer is receiving updates on a weeklybasis. As the software development system begins to shorten its Lead Time for feature development,the Production Rate will increase. When a team’s Lead Time drops from 1 unit per week (5 days) downto 1 unit in 3 days, the Production Rate will have increased from 4 units per month to around 6.67 unitsper month. That’s an increase in Production Rate of 59% while simultaneously delivering the featuresmore frequently.The Metrics in TOC: Productivity Metrics In Software Development Copyright 2009 Derick Bailey. All Rights Reserved.5
Focusing on Production Rate may lead to improvements in Lead Time as well. However, it may also leadto a team that has a larger inventory stacked up in the development system. That is, a team may beproducing 10 units (Q) per month, but they may take 3 months to move each of the features fromconcept to release. The longer a feature sits in the system, the more that feature will cost – theintellectual cost of having to re-asses the feature’s state and restart the push through the system.In order to decrease the Lead Time of the system, we must reduce the Inventory currently in the systemand also remove the waste in the system. The reduction of Inventory allows a team to focus on what thecustomer currently needs. This corresponds to a reduction in Operational Expense by reducing theamount of time and effort that is spent re-learning a feature or function that has been sitting ininventory. The reduction of waste in the system allows the team to produce the features faster byeliminating the waste in the system – the problems that cause delays. The system can produce softwarefaster, thereby reducing the Operational Expense again.Financial MetricsOther metrics, such as Return On Investment and Net Profit can be derived from the production metrics. Investment (I) Operating Expense (OE) Throughput (T) Net Profit (NP) T – OE Return On Investment (ROI) NP / I Average Cost Per Function (ACPF)Investment (I)Investment is the total dollar amount in a given software development system.Investment “is all money invested in software production systems plus money spent to obtain ideasfor client-valued functionality. It thus includes software development tools and requirementsgathering. For a one-time project, however, its I is not constant, so I is subtracted from T at theend.”- John Arthur Rickkets, “Reaching The Goal”[3]The investment in a system of software development has a direct impact on the Return On Investmentfor the software being developed.The Metrics in TOC: Productivity Metrics In Software Development Copyright 2009 Derick Bailey. All Rights Reserved.6
Operating Expense (OE)Operating expense is the cost of converting an idea into working software. This includes salaries of teamany over-head categories of labor in a company. For example, the Business Development departmentwho originally won the contract, the HR department to staff the team, the IT department to support thenetwork and email for the team, the physical housing costs of the building, etc.All waste – that is, activity or work that produces no value in the eyes of the customer – is part ofOperational Expense. This includes rework and code that is thrown away because the customer does notneed it or because it has bugs and needs to be cleaned up or fixed.Throughput (T)Throughput is the dollar amount of a feature sold, minus the cost of installing or delivering the feature.This is typically measured as a Throughput rate – how much money is earned per unit of production (Q).Maximizing Net Profit (NP) and Return On Investment (ROI)“the way to maximize NP and ROI in [Throughput Accounting] is to increase T while decreasing I andOE. This is done in software engineering by gathering requirements rapidly yet accurately, creatingsoftware that customers value, and eliminating waste, which is composed of requirements andfunctions that are discarded before software enters production.”– John Arthur Ricketts, “Reaching The Goal”[3]Average Cost Per Function (ACPF)The cost of software development efforts (new features in existing systems, new systems in general, oreven bug fixes in existing systems) can be calculated as the Average Cost per Function. This is the dollaramount that the software development system will spend to create an individual feature. Average Cost Per Function (ACPF) OE / QAdditional Metrics for the Business of Software DevelopmentThere are additional metrics for monitoring the business of software development, with TOC. BothDavid Anderson and John Ricketts have outlined these metrics, how to calculate them and how to applythem, in their respective books: Agile Management for Software Engineering, by David J. Anderson [1] Reaching The Goal, by John Arthur Ricketts [3]The Metrics in TOC: Productivity Metrics In Software Development Copyright 2009 Derick Bailey. All Rights Reserved.7
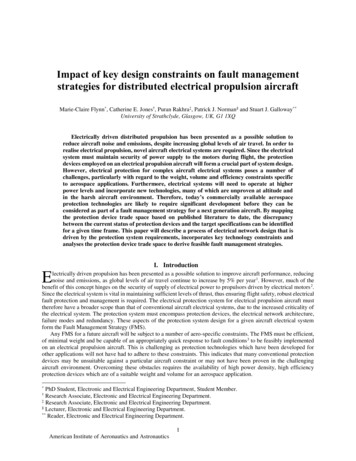
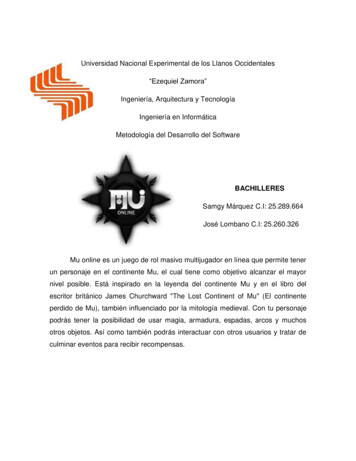
Applying TOC to Software DevelopmentSoftware development is not a “production” system, but is a system of design and development. Assuch, we cannot accurately predict the final size, shape, complexity, or a number of other aspects of thesystems that we are creating. We can, however, measure these aspects of existing systems as they areproduced. We can measure the emergence of the aspects of our system and use that empiricalknowledge to give a range of expected results for the given team, working on new features orfunctionality.Estimating Software DevelopmentGiven the Average Cost Per Function, and the known average Lead Time for functions, softwareestimation becomes significantly easier. Rather than estimating the amount of time that a team believesa feature or function will take, they only need to estimate the size of the features and functions. Oncethe sizes and quantities of features and functions are known, multiply those quantities by the AverageCost Per Functions for the estimated cost of the system. Then multiple those quantities by average LeadTime to get the total estimate for the time it will take to create the system, feature requests, or bugfixes in question.Monitoring ProductivityTo monitor the productivity of a feature or function through the system, TOC often borrows the“Cumulative Flow Diagram” (CFD) from Lean thinking. This type of diagram illustrates how the featuresor functions are flowing through the system.For example, if we have a perfectly stable system where one feature is requested every day, and onefeature is delivered every 5 days, our CFD would look like this:Number Of t2In Production012345678910Number Of Days Of Project WorkThe Applying TOC to Software Development: Productivity Metrics In Software Development Copyright 2009 Derick Bailey. AllRights Reserved.8
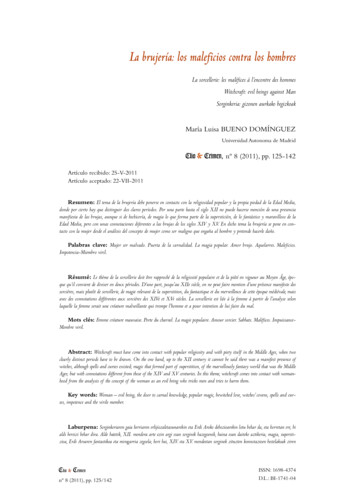
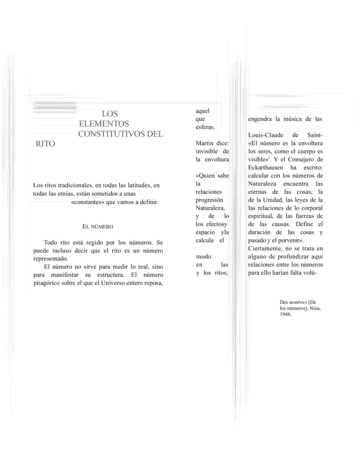
This shows that a single feature travelled from Analysis, through the system, and was deployed in 5 days(Lead Time).Of course a more realistic world would not be quite so clean cut. Many different features may takemany different time frames. A closer-to-reality example of a CFD may look like entIn Production12345678910In this chart, we can see that there is a much different flow of the features through the system. Theanalysis process appears to be occuring much faster than the rest of the system can keep up with. Thedevelopment effort may actually be the constraint on the system, according to this diagram. Essentially,when a flat spot is found in the flow, that is a signal that features are becoming stuck, they have run intoproblems, or are taking longer than normal to be processed.Defining Metrics For MethodologiesWhen we attempt to apply the metrics from TOC into an environment other than manufacturing, thedefinition of those metrics becomes important. After all, what is a “Unit Of Production (Q)” or“Inventory (I)” in software development? They are certainly not the sam
As the software development system begins to shorten its Lead Time for feature development, the Production Rate will increase. When a teams Lead Time drops from 1 unit per week (5 days) down to 1 unit in 3 days, the Production Rate will h