Transcription
Training PackKey Performance Indicators - KPI’s
Aims & ObjectivesTarget Audience : Site Management to Team LeadersPurpose of Module :To ensure employees have the skills toquantify impact, and provide timely direction for an individualscontribution ( at all levels) towards achieving overall business goalsAims & Objectives : How to define & measure our given business goals Why have KPI’s How clarity of objectives improves motivation anddelivers performance Standardised approaches to KPI’s How to translate and cascade KPI’s at all levels Explain links to Performance Management
Key Performance IndicatorsCourse Outline INTRODUCTION WHAT ARE KEY PERFORMANCE INDICATORS? CHARACTERSITICS OF A GOOD KPI EXAMPLES OF KPI’S THE KPI CASCADE PROCESS HOW TO CREATE AND MANAGE KPI’S SUMMARY3
Introductions Name Department Length of service Knowledge ofKey Performance Indicators
What are KPI’sFlip Chart
Key Performance IndicatorsWHAT ARE KPI’s FOR? TO COMMUNICATE STATUS - ACTUAL v TARGET PLANT LEVEL BUSINESS LEVEL WORK STATION LEVEL TO DRIVE IMPROVEMENT BY FACT NOT GUESSWORK TO HELP PRIORITISE IMPROVEMENT ACTIVITY A CONTINUAL HEALTH CHECK FOR THE BUSINESS TO CONNECT THE CUSTOMER TO THE PROCESS
Key Performance IndicatorsESSENTIAL IMPORTANT TO THE VIEWER VITAL - AFFECTS THE BUSINESS CUSTOMER FOCUSED DRIVES IMPROVEMENT
Key Performance IndicatorsUSEFUL CURRENT - UP TO DATE EASY TO UNDERSTAND IMPORTANT AND RELEVANT VIEWER CAN CONTRIBUTE HAS A STAKE CAN HAVE AN EFFECT (good and bad)
Key Performance IndicatorsIMMEDIATE URGENCY / OWNERSHIP RESPONSIBILITIES DEFINED DYNAMIC IMPROVEMENT PLAN AUDIT PROCESS - ACTUAL V’s PLAN CLEAR OBJECTIVES
Key Performance IndicatorsWHAT ARE KPI’s NOT? GROUP OF METRICS NOT EVERYTHING WE MEASURE IS A KPI ! STATISTICS THESE CAN HELP DEFINE KPI’s WORK MEASUREMENT A TOOL FOR BLAME WALL PAPER
Key Performance IndicatorsCHARACTERISTICS OF GOOD KPI DYNAMIC WELL MANAGED - ROTATE VITAL FEW OWNED AND OPERATED BY LOCAL TEAM SIMPLE EASY TO UPDATE - MANUAL VISUAL LOCATED WHERE EASY TO SEE CHANGES JUMP OUT AT VIEWER ENGAGING RELEVANT - CREATES TALKING POINT STANDARD FORMAT EASY FOR OUTSIDER TO UNDERSTAND FEEDBACK RECORDED AND ACTED UPON
Key Performance IndicatorsBusiness KPI’s Safety Performance Quality Performance Cost Performance Delivery Performance People Performance
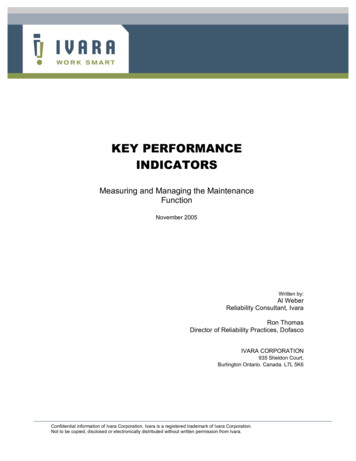
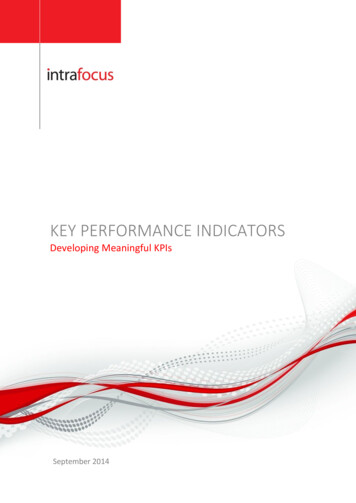
ExamplesActual PerformancePlotted Against TargetDefects Per AssemblyUnambiguous TitleVisual IndicatorofPerformance Trend600500MachiningSub AssyTest2001 TargetNovSepJulMayMarJanNov1000SeptLegend EasyTo understandJul400300200Target ImprovementAssembly
ExamplesRAG Colour CodingRED Outside of target with no improvementor deteriorating trend.AMBER Inside of target but with deteriorating trend. Outside of target but with improving trend.GREEN Inside of target with improving or level trend.
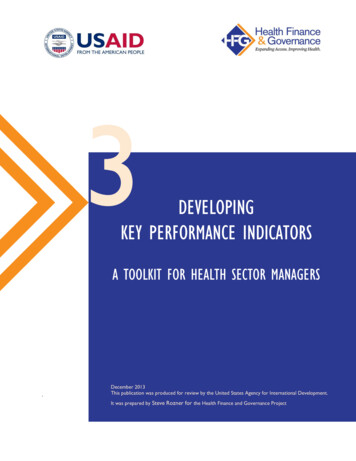
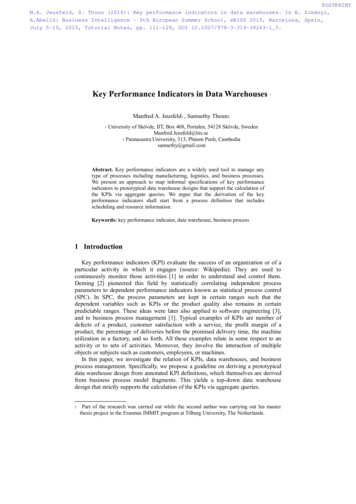
ExamplesScrap Cost 20041600080YTD Scrap Cost: 34.0k7012000601000050800040600030400020200010No. Of Items 1400000JAN FEB MAR APR MAY JUN JUL AUG SEP OCT NOV DECScrap CostScrapped ItemsBudget
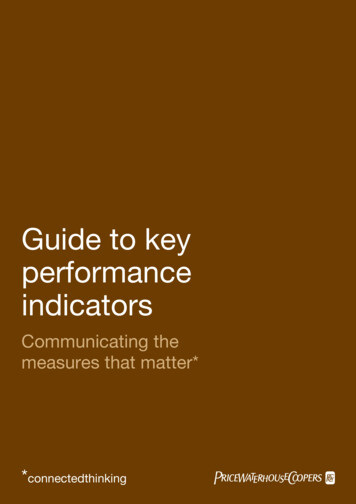
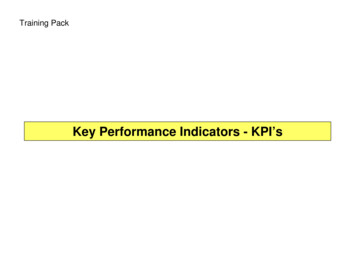
Examples100%90%80%70%60%50%40%30%20%10%0%How are we doingScheduleagainst the plan?Are we on target?Stage 1Stage 2Stage 3
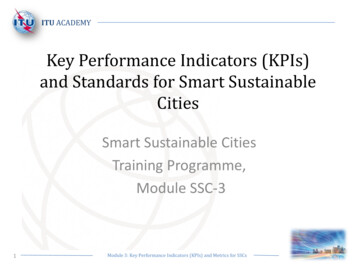
ExamplesExternal Supply Schedule AdherenceWhat are we aiming for?100%80%60%40%20%0%232425Supplier 1Supplier 226272829Supplier 3Supplier 430313233Supplier 5
ExamplesWIP90003.5800037000 '0005000240001.5Stock Turns2.560003000120000.5100000Nov 99 Jun 00 Sep 00WIP Value Product AWIP BudgetOct 00Nov 003695137043WIP Value Product BStock Turns
Examples% TAKT 45403530252015105DAYDATESHIFTHrs Achieved / Hrs Planned x 100
Examples
Performance Management CascadeStep 1 - Team Leaders manage the Key Drivers of performance Are we fully manned to complete the workpackages? Is overtime under control?Stage 1 Jig Board Are we hitting targets (Minutesto complete Operations)?Minutes tocomplete Op 1Step 2 - Manager holds dailyTeam Leader review bywork package Actions timely and focused Support given when neededMinutes tocomplete Op 2Step 3 - Assembly Managers review Weekly PerformancewithManagers. Cost accountability introduced. Focus on shift by shift performance.Manhours (Shift B)3,2003,0002,8002,6002,4002,2002,000JanFebM arA prM ayJun&JulA ugSepOc tNovDec
Performance Management CascadeStep 4 - Head of Business reviews Weekly Performance Good informedStg 01 Cost Per SetdebateStg 01 Hours per Set4,500resulting fromStg 01 Build4,000upward cascade3,500of Team Leaders’3,0002,500performance9085807518 01. 07016 014 012 02,0000.6600.4550.2500.04510 0 Countermeasureplans if targetsnot being met0.8651,50080(0.2)(0.4)401,000JanFebM arAprM ayJun( 0Aug.6)SepOctNovDec(0.8)P e r i od50060Jul( 1. 0 )Direct040YTD9101111231314515ddedal ueWeek V ar iAance t oV32.11671791819W eekDiAscr tuptCumul at i v euali on - E x t er nal11201321Indirect2215232417251926NPODisruptio( 1. 2 )2127282923252729Out OfWeekJ i g V ar i ance t o 32. 1 Ref r eshT r ai ni ngWeekDi sr upti on - atI nti verB udgetCumule nalB udget 32. 1For ecas t 32.RefhFor1ecasrt es(Lean)Step 5 – Senior Management Team reviewsMonthly performanceProduction Volume Senior level escalation plans.Hours per Set23501. 53006, 5006, 0002501250Cost Per Set5, 5000. 520005, 000200150-0 . 54, 5001501004, 0001003, 50050-1- 1. 53, 000-202, 50050J anFebM arA prM ayJunJulA ugSep2, 000&Period Variance (32.1)J unJ ulA ug SepCumulativeActualOc t NovSepOc tNovDecActualDisruptionStage 1Stage 2Stage3FALBudget (32.1)ForecastDitiOBPJ an0JanFebM arA prFebM ayM arJ unA prJ ulM ayA ugDecOc tNovDecPeriod VarCumulative
Performance Management CascadeStep 6 - Site Cost Performance consolidated. Manufacturing Director reviews Factory Manager Performance. Forecasts of cost performance compiled to ensure corrective actions taken to achieve “Budget”. Risks & Opportunities monitoring and control.Summ ary - All Categories200, 000,0001, 500,000180, 000,0001, 000,000160, 000,000140, 000,000500, 000120, 000,0000100, 000,00080, 000,000-500,00060, 000,00040, 000,000-1,000, 00020, 000,0000-1,500, 000M onthly /1Cumulative budgetForecast /- to budgetCumulative forecast&Cumulative actual
What KPI’s do you think would be applicable toyour areaFlip Chart
How to Create and Manage KPI’sIdentifyCustomersand SuppliersMonitor ProgressTo Plan And TakeCorrective ActionFormImprovementTeamsForm TeamACTPLANCreateImprovementPlanDefine leCHECKDOCollect DataTrain UsersDeterminePerformanceDrivers1Develop FormatAnd ReviewProcessScore & PrioritiseKEYPerformanceIndicatorsIdentify ownersand users
How to Create and Manage KPI’sIdentifyCustomersand SuppliersDeterminePerformanceDriversForm TeamDefine LocalPerformanceIndicatorsScore & PrioritiseKEYPerformanceIndicators
How to Create and Manage KPI’sEase of recording dataImpact on businessFrequency of occurrenceDefine LocalPerformanceIndicators&Score & PrioritiseKEYPerformanceIndicators
How to Create and Manage KPI’sIdentifyCustomersand SuppliersDeterminePerformanceDriversForm TeamDefine LocalPerformanceIndicatorsScore & PrioritiseKEYPerformanceIndicatorsDevelop FormatAnd ReviewProcessIdentify Ownersand Users
ExampleKPI : Key Performance IndicatorLOST HOURS (UNPLANNED WORK) PRE & p QualityToolingLeanUnplanned Absence&Blue Shift TWRed Shift DJLocation: X:\Broughton\A340-600\Lean Manufacturing\Stage 00\Std Documents\Lost Hours KPIGHIJKLM567
How to Create and Manage KPI’sIdentifyCustomersand SuppliersDeterminePerformanceDriversForm TeamDefine LocalPerformanceIndicatorsScore & PrioritiseKEYPerformanceIndicatorsTrain UsersDevelop FormatAnd ReviewProcessIdentify Ownersand Users
How to Create and Manage KPI’sIdentifyCustomersand SuppliersDeterminePerformanceDriversForm TeamCreateImprovementPlanDefine LocalPerformanceIndicatorsScore & PrioritiseKEYPerformanceIndicatorsCollect DataTrain UsersDevelop FormatAnd ReviewProcessIdentify Ownersand Users
How to Create and Manage KPI’sMonitor ProgressTo Plan And TakeCorrective ActionIdentifyCustomersand riversForm TeamCreateImprovementPlanDefine LocalPerformanceIndicatorsScore & PrioritiseKEYPerformanceIndicatorsCollect DataTrain UsersDevelop FormatAnd ReviewProcessIdentify Ownersand users
Typical KPI’sKPI - examplesQualityDefects(Defects per unit)Errors(errors per unit)DeliverySchedule adherenceTarget1 Defects per unit2 errors per unit0 delta (nil Hours behind or ahead of plan)(Hours delta to plan)Cycle TimeTo be agreed(Hours per Unit)CostManning(man hours per set)(Cost per unit)270 hours per unitPeopleSkill LevelTraining Hours75% people trained to Practitioner Level40 hrs per man per year 5,000 per unitKey performance indicators need to be simple and focused
KPI’sSUMMARY Direct relationship to business plan Communicates progress against plan Drives continuous improvement Visual - provokes a response Effective - simple and easy to understand Ownership - relates to everyone Up to date - dynamic management
Key performance indicators need to be simple and focused 75% people trained to Practitioner Level 40 hrs per man per year Typical KPI’s Direct relationship to business plan Communicates progress against plan Dr