Transcription
Lockeford Plant Materials CenterPO Box 6821001 N. Elliott RoadLockeford,CA 95237Phone: (209) 727- 5319Fax (209) 727- 5923Email: Margaret.Smither-Kopperl@ca.usda.govWeb-page: http://plant-materials.nrcs.usda.gov/capmc/2
Table of 11National Soil Health Study13Drought Tolerant Cover Crops21Cover crop component demonstrations25Pollinator Meadows29Sainfoin and Grass Seeding Trial45Biofuel Oilseed Study: Camelina Variety Trial49Inter-Center Strain Trials51Observational Planting of Roemer’s Fescue for Corvallis PMC53Evaluation of springbank clover57Demonstration planting of ‘Windbreaker’ sacaton61Seed and Plant Production65Seed Production67Reimbursable Projects69Bureau of Land ManagementNative Plants Development71National Park ServiceSequoia and Kings Canyon377
Yosemite79Outreach81Trainings at the Lockeford PMC83SLEWS and FARMS Restoring Riparian Habitat on the Mokelumne River85Indigenous Stewardship Methods and California Indian Outreach87Peoples Garden89Publications91Presentations934
USDA-NRCS Lockeford Plant Materials CenterCenter Staff 2013Margaret Smither-Kopperl, ManagerDennis Frommelt, GardenerShirley Fowler, Biological Science TechnicianShawn Vue, Admin Asst, Seed TechLarry Sell, Farm Asst (1/2 time)Plant Materials SpecialistVacantCalifornia Plant Materials CommitteeTom Hedt, State Resource ConservationistCeci Dale Cesmat, State Rangeland Management SpecialistDennis Chessman, State Resource AgronomistThomas Moore, State BiologistStephen Smith, State ForesterJennifer Cavanaugh,Area 1 – RaeAnn DubayArea 2 – Lisa Shanks, Alyson AquinoArea 3 – Rob Roy, Joe WilliamsArea 4 –Brooks Englhardt, Shea ValeroAnita Brown, Director of Public AffairsHue Dang, Resource Conservationist,Greg Norris, State Conservation EngineerSid Davis, Assistant State Soil ScientistLockeford PMC Staff: Margaret Smither-Kopperl,Other ad hoc members:John Englert, National PM ManagerJim Briggs, West Region PM SpecialistBruce Munda, AZ Plant Materials SpecialistDan Ogle, ID Plant Materials SpecialistKathy Pendergrass, OR Plant Materials SpecialistManuel Rosales, Tucson PMC ManagerErik Eldredge, Fallon PMC ManagerKathy Pendergrass, Acting Corvallis PMC Manager5
6
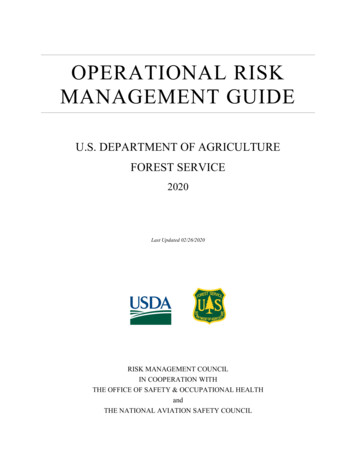
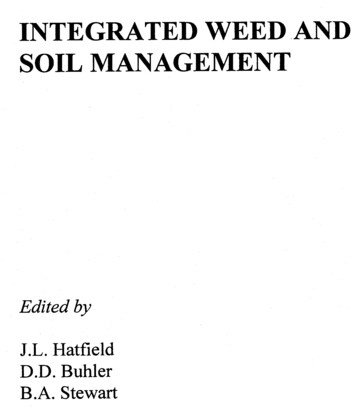
INTRODUCTIONThe Lockeford Plant Materials Center (CAPMC) is a federally owned and operated facility, currentlyunder the administration of the California State Office of the USDA Natural Resources ConservationService. The California Plant Materials Program began February 1935 with the Soil Conservation ServicePlant Materials Nursery at Santa Paula, CA. In 1939 a 60-acre Plant Materials Center was established atPleasanton, CA and in September 1973 was moved to the current site at Lockeford, CA.The current CAPMC service area covers close to 62 million acres (96,700 mi²) and includes 11 MajorLand Resource Areas (MLRAs) (Figure1). The area served by the California Plant Materials Center ischaracterized by a Mediterranean climate with six month dry season in the summer, and six-monthrainy season in the winter. The area has a very complex pattern of soils. The topography consists ofbroad valleys, rolling foothills, upland plateaus and rugged mountains. Elevation extremes are from 47feet below sea level to 14,400 feet above sea level. Agriculture in the service area is extremelydiversified, including fruits and vegetables, rangeland with extensive livestock production, dairies, andtimber production. We continue to develop plant technologies to promote conservation to addressresource concerns within our service area.The CAPMC is 106.7 acres of prime farmland located along the Mokelumne River near Lockeford,California. Soils at the CAPMC are primarily Columbia fine sandy loam and Vina fine sandy loam. Thelevee is an Egbert silty clay loam. Soil pH ranges from 6.7 to 7.0, Irrigation water is available to all fieldsat the CAPMC as surface irrigation, and also with a new pressurized irrigation system installed at theCAPMC in 2012. The irrigation systems allow us to access all fields with up to date irrigation systemsincluding sprinkler, through hand and wheel line and subsurface drip irrigation.The service area has a complex topography composed of broad valleys, including the Central Valley,rolling foot-hills, upland plateaus, and rugged mountains. The CAPMC’s conservation plant releasesinclude native releases: purple needlegrass, California brome, blue wildrye, sulfur flower buckwheat,inland saltgrass, and fourwing saltbush. Our non-native releases include Berber orchard grass used forrange and pasture enhancement, and ‘Lana’ woollypod vetch with utility for cover crops.The mission of the CAPMC is to develop technology and plant materials to address the resourceconcerns of California. The majority of our work focuses on species that are native to California. TheCAPMC is responsible for seed increase plantings of potentially valuable plant species and for themaintenance of seed stock of California cooperative releases. We work with NRCS field offices, publicagencies, universities, conservation organizations, tribes, and commercial seed producers and nurseries.We continue to develop plant technology for addressing resource concerns, which in California includessoil health, water quality and quantity, air quality, wildlife habitat especially pollinators and landrestoration.7
Figure 1. Service Area Map for the Lockeford Plant Materials Center showing Major Land ResourceAreas8
9
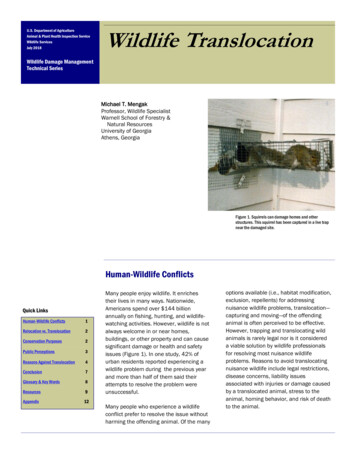
The average precipitation at the Lockeford Plant Materials Center is 19 inches, as the area has a Mediterraneanclimate the majority of the rain falls over the winter. The year 2013 was an historic drought year as only 6inches of rain fell for the entire year.Figure 3. Rainfall at the Lockeford PMC during 2013.Precipitation lAugSeptOctNovDecA major challenge during 2013 was the limited scientific staff at the Lockeford PMC. This was amelioratedthrough the assistance of staff at the State Office including Ceci Dale-Cesmat, Dennis Chessman, Tom Moore,Jacqui Gaskill, Dan Johnson, Greg Norris and Sid Davis who helped with planning and implementation of studies.10
Studies11
12
Effects of Mixed Species Cover Crop on Soil HealthUSDA-NRCS California Plant Materials CenterCAPMC-T-1208-CPAnnual Progress report prepared by Shirley Fowler and Margaret Smither-KopperlIntroductionSoil health is critical as a natural resource for crop production. The Lockeford Plant Materials Center (CAPMC) isparticipating in a national Plant Materials Program Study, with six other PMCs around the US, to evaluate theeffects of cover crops on soil health. The CAPMC is the only PMC situated in California and with a Mediterraneanclimate. The first year of the study was planted in fall of 2012. The CAPMC is evaluating three different seedingrates and mixes of six plant species to observe their impact on soil health. Cover crops planted each fall andsweet corn is planted each summer as an example of a commodity crop. At multiple times during the life of thecover crop, the CAPMC will collect above-ground data to determine the consequences of treatments on plantcover, species composition, and total biomass. Analysis on soil properties, fertility, and biological activity aretaken at cover crop planting and termination. This report is a preliminary analysis of data from the first yearstudy and conclusions are subject to change with further data from the next two years.Information gathered in this study will help us determine the effectiveness of these cover crop species to theCentral Valley of California and their effects on soil health, as well as their effect on commodity cropperformance.Summary of Preliminary Results % Cover averaged over seeding rates after 60 days was 95% for the 6-component mix, 90% for the 4component mix and 85% for the 2-component mix. % Cover averaged over diversity after 60 days increased with seeding rate, at 60 days it was 95% for 60seeds/ft2, 90% with 40 seeds/ft2and 85% with 20 seeds/ft2. Above ground biomass in the 4- and 6-component mixes was almost double the 2-component mix atcover crop termination. Weed suppression occurred. Weed biomass was higher with the 20 seeds/ft2 seeding rate, especially inthe 2-component mix. Weed biomass was lowest (below 10% cover) in plots containing tillage radish atseeding rates of 40 and 60 seeds/ft2. Canola was not competitive as it was not found within the 6-component mix. Total nitrogen and the soil health index were not significantly different between treatments, but haddecreased after the sweet corn harvest prior to planting the cover crop for the second year. Below ground radish biomass was not significantly different between the 4- and 6-component mixes;dry matter averaged 1.05 ton/acre and 0.8 ton/acre respectively. Corn yields were significantly higher in the 4- and 6-component mix, compared to the control and 2component mix. Tillage radish was the variable associated with increased corn yield.13
Methods and MaterialsCover crop mixes were planted October 18-19, 2012 onto a cultivated clean seed bed in a field of Vina fine sandyloam. No irrigation was applied as 4 inches of rainfall fell in the two months following planting in 2012, ensuringgood germination and early growth. The experimental design was a randomized complete block with fourblocks and 2 factors; cover crop diversity and seeding rate. There were three seeding mixes representingincreasing diversity with combinations of rye, crimson clover, radish, hairy vetch, canola, and oats. (Table 1).The second factor was seeding rates of 20, 40 and 60 seeds per ft2. In addition to these 9 treatments there wasa control plot in each block.Table 1. Planting mixes for soil health study.Mix2-component4-componentGrasses50% cereal rye45% cereal ryeLegumes50% crimson clover22.5% crimson clover22.5% hairy vetchBrassicas6-component22.5% cereal rye22.5% oats22.5% crimson clover22.5% hairy vetch5% tillage radish5% canola10% tillage radishThe cover crop was terminated on March 27 using the roller crimper. Biomass samples using designatedprotocols were taken prior to rolling the plots. Soil temperatures and moisture levels were recorded at covercrop termination. This time was chosen as the tillage radish seeds were close to maturity. However the grasses,rye and oats were still leafy and immature and were not killed by the roller-crimper. A spray of glyphosate wasapplied to all plots to kill the cereals and weeds and the ground was left fallow prior to planting.Sweet corn (cultivar Bodacious) was planted on May 13, 2013 using a modified Truax range drill, to give anapproximate 32 in row spacing. Irrigation was applied using sprinkler irrigation prior to seeding and afterplanting until the corn plants were approximately 2 feet tall. After this time irrigation was applied using theburied drip lines set-up prior to planting in fall of 2012. Sweet corn was harvested on July 26, 2013. The cornwas mowed prior to planting in cover crops again in fall of 2013 for the second year of the study.Results and DiscussionAbove Ground Growth from Cover Crop PlantingAfter planting the seeds germinated and grew rapidly to provide cover over the soil, by 30 days cover wasbetween 40 and 50% for all plots (Figure 1 and 2). After 60 days, cover was 85% for the 2-component mix, 90%for the 4-component mix, and 95% for the 6-component mix. Seeding rate also affected % cover at 60 days itwas 85% with 20 seeds/ft2, 90% for 40 seeds/ft2, and 95% for 60 seeds/ft2. The canopy cover closed at about 90days for all treatments.14
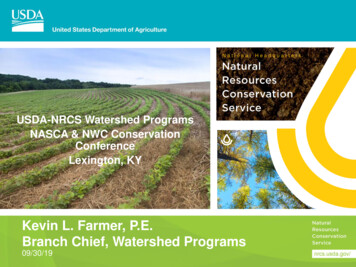
Figure 1. Plot photos of 2, 4, and 6 component mixes of cover crops in 18 March 2013, nine days prior to covercrop termination. The seeding rate was 40 seeds/ft2.a.Two component mixb.Four component mixc.Six component mixFigure 2. Effect of three cover crop mixes with 2, 4 and 6 species and three seeding rates on % cover during2012 and 2013 season.Soil moisture at cover crop termination was similar in all plots at 20 – 21 % volumetric water content asmeasured using the HydroSense II. Soil temperatures also were similar between treatments at cover croptermination at 45 – 47 oF. These temperatures were too cold to plant sweetcorn so planting was delayed untilMay.Cover crop termination was carried out when the radish was approaching maturity, although the grains werestill immature. Dry matter from above ground biomass was lowest in the control plots and the 2-component mix(Table 1, Figure 3a). The highest biomass values were in the 4- and 6-component mixes, which were almostdouble the two component mix.15
Table 2. Above ground biomass of cover crops at termination and % composition of three cover crops mixesand three seeding rates. Values within the same column followed by the same letter are not significantlydifferent in Tukey HSD means comparisons at α 0.05.Cover rolSeeding rate2(seeds/ft )2040602040602040600Dry matter(lb/acre)Grass (rye andoats) %927 c1127 bc908 c2241 a2191 a1467 abc2107 a1939 ab1405 abc510 c39 ab55 a54 a28 b29 b28 b36 b40 ab28 b Legumes(clover andvetch) %22 a22 a26 a22 a22 a25 a19 a22 a25 a-Brassicas(tillage radish)%35 a40 a39 a30 a29 a38 a-Weeds %40 b24 bc20 bc15 c9 c9 c14 c9 c8 c99 aThe effect of seeding rates averaged across diversity treatments, indicated that the 20 and 40 seeds/ft2 seedingrate had higher biomass than the 60 seeds/ft2 seeding rate (Figure 3b). Presumably the higher seeding ratecaused competition between plants reducing total biomass. As these plots were terminated prior to maturity ofthe grain crops, results could have changed significantly if termination had been delayed.Figure 3. Effect of three cover crop mixes with 2, 4 and 6 species and three seeding rates on above groundbiomass at cover crop termination on March 27, 2013 (Dry matter lb/acre)abA comparison of the plant composition across treatments finds that the p
Larry Sell, Farm Asst (1/2 time) Plant Materials Specialist Vacant . California Plant Materials Committee Tom Hedt, State Resource Conservationist . Ceci Dale Cesmat, State Rangeland Management Specialist . Dennis Chessman, State Resource Agronomist . Thomas Moore, State Biologist . Stephen Smith, State Forester . Jennifer Cavanaugh, Area 1 – RaeAnn Dubay . Area 2 – Lisa Shanks, Alyson .