Transcription
Challenges in MeetingInternational Requirements forClinical Bioequivalence of InhaledDrug ProductsTushar Shah, M.D.Sr. VP, Global Respiratory Research and DevelopmentTEVA Pharmaceuticals3/17/20091
Presentation Topics Review of clinical requirements for orally inhaleddrug products by various regulatory authorities- The need to demonstrate dose-response Study designs for determining clinicalbioequivalence (BE)- Beta agonists (BA)- Inhaled corticosteroids (ICS) Implications of shallow dose-response forevaluating bioequivalenceAlternative options?3/17/20092
Status of Current Guidelines/Guidances For InVitro/In Vivo BE of Orally Inhaled ne on the Requirements for Clinical Documentation forOrally Inhaled Products (OIP) including the Requirements forDemonstration of Therapeutic Equivalence Between TwoInhaled Products for use in the Treatment of Asthma andChronic Obstructive Pulmonary Disease (COPD) in Adults andfor Treatment of Asthma in Children and AdolescentsGuideline,January, 2009CanadaGuidance to Establish Equivalence or Relative Potency ofSafety and Efficacy of a Second Entry Short-acting Beta2agonists Metered Dose InhalerSubmission Requirements for Subsequent Market EntryInhaled Corticosteroid Products for use in the Treatment ofAsthmaGuideline,February, 1999USA3/17/2009Draft guidance,August, 2007Informal Only for Inhalation Products – Presentations given atRegulatory and Scientific Conferences. FDA seekingproposals.3
Summary of EMEA Guideline A stepwise approach to demonstrating BEhas been proposed- If BE is shown via in vitro comparison STOP- If in vitro data do not support BE, perform PK anddeposition studies (PK with charcoal or imaging studies)- If PK and deposition studies support BE STOP- If PK and deposition studies do not support BE, performpharmacodynamic studies3/17/20094
Summary of EMEA Guideline:Pharmacodynamic Studies Bronchodilation or bronchoprotection may be used forefficacy studiesStudy design must be sensitive enough to discerntreatment differences- Relative potency approach is recommended or statisticallysignificant dose separation- More than one dose of the test and reference product- Use dose at the low end of recommended range- 90% (?) confidence interval (CI) must be entirely within 67 to150% if relative potency is used For safety comparisons use high dose and include PK,PD measures and AE- 90% CI must be entirely within 80 to 125% for PK- Test product cannot be worse than reference product for anysafety measure3/17/20095
Summary of Canadian Guideline forSecond Entry SABA In vitro comparison between test and referenceproductsEfficacy Study- Two doses of test and reference using either bronchodilationor bronchoprovocation- Relative potency including 90% CI must be entirely between80 – 125%. Safety- Maybe obtained from efficacy studies or separate studiesMonitor acute AEs (heart rate, tremor, serum potassium, etc)Standard dose and higher doseSafety of test product cannot be worse than reference productPK ?3/17/20096
Summary of Canadian Draft Guidancefor Second Entry Market ICSIn vitro comparison between test andreference A systemic exposure study (PK) A clinical study based on evaluating antiinflammatory markers as primary endpoints 3/17/20097
Canada Draft Guidance for ICS:Clinical Study Study Population: ICS naïve with stable asthma and 3%sputum eosinophils.- Use of other anti-inflammatory measure needs to be pre-agreed Study Duration: Parallel design 3 wks. Choice of Dose: Lowest dose of Test and Reference productsvs Placebo. Efficacy Endpoints: Sputum eosinophils and pre-bronchodilatorFEV1- At least 50% change in sputum eosinophil counts and 10% predictedchange in mean FEV1 between active and placebo treatments areconsidered clinically significant. Therapeutic Equivalence Criteria: 90% CI of the ratio ofmean eosinophil count and FEV1 should be within 80-125%.3/17/20098
Summary of Likely FDA ExpectationsFrom Dr. Chowdhury RDD 2008 (“US Perspectives on the Equivalence of ICS”) In vitroQ1 and Q2 (same ingredients and all within 5% of reference)- Equal performance in applicable in-vitro testing (i.e., emitted dose,metered dose, APSD, general shape, appearance)- Similar instructions- Basically a “direct copy” of the reference Safety: Equivalent systemic effect (PK) at relevant dose orpharmacodynamic effect (PD) (i.e., HPA axis suppression if bloodlevel comparisons not practical) Efficacy: Sensitive and relevant endpoints (dose-response)- SABA – bronchodilation or bronchoprotection models acceptable- ICS – no established clinical models capable of showing doseresponse (candidates may include allergen challenge, sputumeosinophilia, exhaled nitric oxide and an “asthma stability model)-3/17/20099
The Need to Demonstrate Dose-response? Test Dose AReference Dose ATest Dose BReference Dose BScientific rationale for dose-response as a methodfor establishing dose equivalence- Study validity – assay sensitivity- Establishment of relative potency between Test and Reference3/17/200910
% Maximum ResponseDose-response RelationshipDose3/17/200911
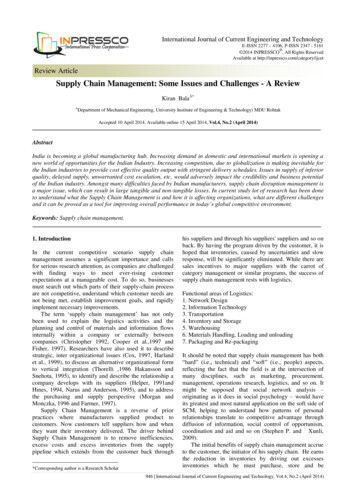
% Maximum ResponseMore Severe Disease Can Shift Doseresponse Relationship to the RightMore severe diseaseDose3/17/200912
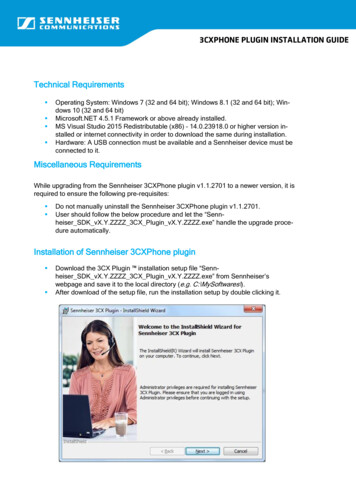
Most Current Respiratory Drugs Are Dosed atFlat Part of Dose-response Relationship% Maximum ResponseCurrently available dosestrengths of BA and ICSDose3/17/200913
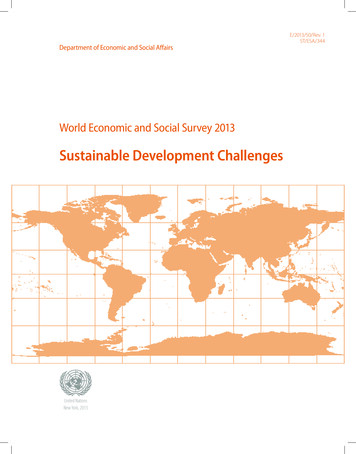
Finney Bioassay (Parallel Line) Is Commonly Used toEstablish the Relative Potency Ratio for Two Treatments The following hypothesesParallel-Line Assayare tment54.53.52.51.500.5 The results demonstrate- Dose independentRELATIVE POTENCYRATIO- Proof of a DOSERESPONSE20Response (FEV1)s- The dose-response isLINEAR- The dose-response has asignificant SLOPE- Dose response curves arePARALLELLog DoseNote: Data must overlap on the Response(y- axis) to use parallel-line assay14
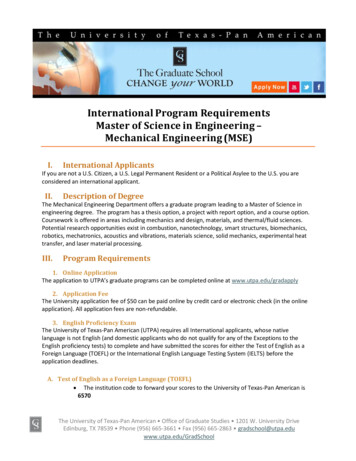
Effect of Slope on CI Using theFinney BioassaySteep slope forDose-response Narrow CI% Change FEV11Shallow slope forDose-response Wide CI% Change FEV1 1lLog dose of TreatmentWith a shallow dose-response curve, the CI will be wider as compared witha dose-response curve that is steep3/17/200915
Ideal Clinical Study Design/EfficacyMeasure For Assessing Dose-response Sensitive for demonstrating dose-separation- Able to distinguish a doubling dose?- Steep dose-response slope ReproducibleLow inter- and intra-subject variabilityNarrow CI for determining bioequivalence- Achieved with manageable patient numbers3/17/200916
Clinical Study Designs for BA –Formoterol and Albuterol Bronchoprotection- PC20 or PD20 to methacholine Bronchodilation- FEV1 AUC3/17/200917
Formoterol Dose-response Studies y OutcomeEstimated DoseResponse Slope,per log dose (mcg)Numerical doseresponse0.66 / log doseSingle DoseBecker andSimons, 1990PC20at 6hrSingle doseCross-overN 16Ages 7-12Formoterol 12and 24 mcgPC20at 12hr0.42 / log doseSingle and Repeat DoseLipworth etal., 1999Single dosePD201 hr afterfirst doseRepeat dosePD201 hr after last(2 wk) dose3/17/2009Repeat doseParallelN 38Ages 18-45Formoterol 6, 12and 24 mcgNumerical doseresponse1.0 / log dose 0 / log dose18
Single Dose Formoterol Dose-responseStudies – FEV1ReferenceRingdal etal, 1998Key EndpointMax FEV1DesignDosesKey OutcomeN 31Ages 18-65Formoterol 6, 12,24 and 48 mcgSignificant doseseparation for 48vs 6, 12, 24 mcgEstimated DoseResponse Slopeper log dose(mcg)0.16 L /log dose0.15 L /log doseMaesen etal, 199212 Average FEV1,FEV1 AUCN 30Ages 18-65Formoterol 12, 24and 48 mcgSignificant doseseparation for 12and 48 mcg0.09 L /log dose0.08 L /log dosePalmqvist etal, 199712h Average FEV1N 28Ages 20-69Formoterol 6, 12and 24 mcgNumerical doseresponse0.07 L /log doseBousquet etal, 200512h Average FEV1N 51Ages 18-70Formoterol 12and 24 mcgSignificant doseseparation0.20 L /log dosePohunek etal, 200412h Average FEV1,FEV1 at 12hN 68Ages 7-17Formoterol 6, 12,24 and 48 mcgSignificant doseseparation for 6vs 24 and 48mcg0.08 L /log dose3/17/20090.09 L /log dose19
Simulation Examining Power as a Function ofTotal Sample Size and Slope of Log Doseresponse Relationship The sample size required to achieve reasonable studypower was examined as a function of:- The slope of the dose-response curve- The confidence interval limits required to declare bioequivalency Intra-subject variability was estimated from the literature3/17/200920
Sample Size for Methacholine Challenge80% 1.0704520 100.9905030 100.81206540 100.71458545 5CI0.5-2.01.01005540 100.91307045 100.81459050 100.719511560250.6250150854090% PowerBased on assumed true relative potency of 0.953/17/200921
Sample Point Estimates for Relative PotencyAre Acceptable Even with Wider CIsRange of sample point estimates of relative potency yielding 90% CIsthat satisfy the given thresholds assuming 50 subjects and the samevariances as used for the .5-2.0MethacholineChallenge(slope 0.6)1.0 – 1.10.9 – 1.20.8 – 1.30.7 – 1.6MethacholineChallenge(slope 0.8)0.9 – 1.10.9 – 1.20.8– 1.30.7 – 1.7Serial FEV1(slope 0.15)0.9 – 1.10.8 – 1.20.8 – 1.20.7 – 1.63/17/200922
Summary of Albuterol Relative Potencyand CI’sCitation# ofSubjectsDose (mcg)AlbuterolTreatmentRelativeDosePotency90% CIAhrenset al. (1999)2490, 270DPI AlbuterolCFC MDI Ventolin1.120.68-1.94Parmesewaranet al. (1999)18100, 200,400HFA MDI ProventilCFC MDI VentolinPlacebo1.080.81-1.46Stewart et al.(2000)2490, 360CFC MDI AlbuterolCFC MDI Ventolin1.010.69-1.503/17/200923
Challenges Associated withDemonstrating Bioequivalence for BA Bronchoprotection and bronchodilator endpointscan be utilizedDose-response trends are observed with singledose studies- Slopes are generally flat (greater with methacholinechallenge vs FEV1)- CI needs to be wider than standard bioequivalencelimit (0.8 to 1.25) in order for studies to be feasible- CI as wide as 0.67 to 1.5 still yields acceptable pointestimates for dose potency when manageable patientnumbers are utilized3/17/200924
Overview of Dose-response Data forInhaled Corticosteroids (ICS) in Asthma A range of doses are approved based onstudies investigating different doses indistinct populations (ICS naïve, ICStreated, OCS sparing)- Dose-response rarely demonstrated on traditionalefficacy measures such as FEV1, symptoms, rescuealbuterol use, exacerbations, methacholine challenge The reproducibility of the occasional studydesign that have been able to discriminate ICSdoses is unknown at present3/17/200925
Dose Response Studies Where ICS Doseresponse Was ObservedReferencePauwels et al[NEJM 1997]PrimaryEndpointDesignICS DosesKey OutcomeCommentExacerbations 210-215 patients/arm 1600 mcg bud 1 year study Parallel groupBUD 100 and 400 mcgBDBUD 100 and 400 mcgBD Formoterol12 mcg BD Dose-responsefor ExacerbationRate Busse et al[JACI 1999]FEV1%Predicted Severe Asthma(FEV1 51-53%) 50-59 patients/arm 6 week study Parallel groupBDP CFC 100, 400and 800 mcg/dayBDP HFA 100, 400 and800 mcg/day Dose-potencyRatio established 2.6 (95%CI: 1.111.6) Ahrens et al[AJRCCM2001]AsthmaStabilityfollowing OCS 12 patients on 8002000 mcg ICS X-over 3 wks treatment 4-7 days wash-inwith 40mg bid OCSBDP 100 and 800 mcgday Dose-responseestablished forFEV1, PEF, FEF25- 3/17/2009No DoseResponse forFEV1, Sx orSABA useFEV1differencesbetweenadjacent doseswas very smallPilot study CI 0.5-2.07526
Dose-response Using FeNOReferencePrimaryEndpointDesignICS DosesDailyKey OutcomeCommentSilkoff et al[Chest, 2001]FeNO 2 Studies (15 and12 pts) Dose EscalationBudesonide 100, 400 and800 mcg Dose-responsebetween 100 and800 mcg doses Jatakanon et al[Thorax, 1999]FeNO 21 pts 4-week study Parallel GroupBudesonide 100, 400 mcgin QD or BID doses Decrease inFeNO in a dosedependentmanner Jones et al[ERJ, 2002]FeNO 65 pts on ICS, ICSwithdrawn 8-week study Parallel GroupBeclomethasone 50, 100,200, and 500 mcg Linearrelationshipbetween ICS doseand % changeFeNO Kelly et al[JACI, 2006]FeNO,SputumEos. 14 patients, ICSnaive 6-week,sequential, singleblindFluticasone 50, 100, 200,and 400 mcg Linear doseresponserelationshipdemonstrated FeNO(rate) 28 patients No controllers Parallel GroupBudesonide 100, 400 mcg Onset of actionwas dosedependent Kharitonov etal[Thorax, 2002]3/17/2009FENO superiorto FEV1 and PC20in establishingdose-responsePlateau after400 mcg of BUDLarge drop-outrate Prednisone useFeNO atscreening was 25 ppb.Baseline FeNO14-20 ppb.27
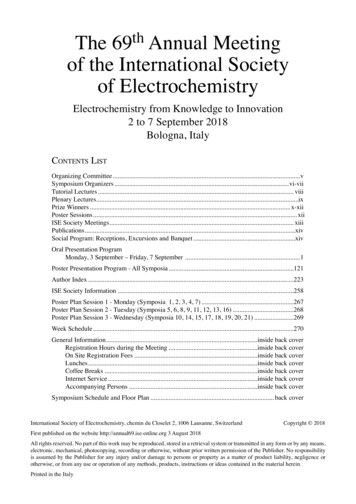
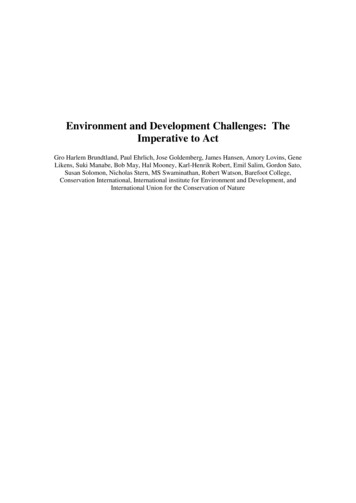
FeNO Studies – Silkoff et al FeNO difference wasstatistically significantfrom placebo at all ICSdosesA significant doseseparation wasdemonstrated onlybetween doses 100 and800 mcg/dMust interpret withcaution as this was acumulative dose studyAdapted from Silkoff et. al, Chest/119/5/May, 20013/17/200928
Summary of Dose-response DataWith ICS Dose-response is difficult to demonstrate usingtraditional designs and efficacy measuresStudy designs that may allow for dose-responseto be shown include:- FeNO- Asthma stability using OCS wash-in Studies have limitations in design and have yetto be replicatedEven if successful, these studies will require 4-8fold dose separation and a wider CI to succeed3/17/200929
Challenges in Meeting RegulatoryRequirements Limited guidances currently- All have different approaches and expectations Almost all require dose-response to establish study validityDose-response will be a challenge todemonstrate- Study designs which may succeed for BA and ICShave been reported- Additional confirmation still needed- Will require CI wider than current expectations- May require 4-8 fold dose separation3/17/200930
Additional ChallengesLowest strength available may be on flatpart of dose-response relationship How to handle multiple strengths Availability of placebo devices to performdouble-blind studies How to handle ICS/BA combinations 3/17/200931
Alternative Approaches to Pursue ifDose-response Not Able to Be Shown Greater emphasis on in vitro equivalenceEU approach of using PK with and withoutcharcoalCanadian approach for ICS- Dose-response not necessary Clinical comparison using traditional measures- More pragmatic and clinically relevant especially forICS- Compare Test product vs Reference product andplacebo for each strength based on asthma severity- Inclusion of placebo arm provides study validity3/17/200932
Measure For Assessing Dose-response . 0.9 130 70 45 10 0.8 145 90 50 10 0.7 195 115 60 25 0.6 250 150 85 40 90% Power Based on assumed true relative potency of 0.95. 3/17/2009 22 Sample Point Estimates for Relative Potency Are Acceptab