Transcription
Spatial Distribution ModelsRobert J. Hijmans and Jane ElithMay 20, 2021
CONTENTS1Introduction2Data preparation2.1 Species occurrence data .2.2 Importing occurrence data2.3 Data cleaning . . . . . . .2.4 Duplicate records . . . . .2.5 Cross-checking . . . . . .2.6 Georeferencing . . . . . .2.7 Sampling bias . . . . . .3.5558101113143Absence and background points174Environmental data4.1 Raster data . . . . . . . . . . . . . . . . . . . . . . . . . . . . . . . . . . . . . . . . . . . . . . . .4.2 Extracting values from rasters . . . . . . . . . . . . . . . . . . . . . . . . . . . . . . . . . . . . . .2323265Model fitting, prediction, and evaluation5.1 Model fitting . . . . . . . . . . . . . . . . . . . . . . . . . . . . . . . . . . . . . . . . . . . . . . .5.2 Model prediction . . . . . . . . . . . . . . . . . . . . . . . . . . . . . . . . . . . . . . . . . . . . .5.3 Model evaluation . . . . . . . . . . . . . . . . . . . . . . . . . . . . . . . . . . . . . . . . . . . . .292931336Modeling methods6.1 Types of algorithms and data used in examples6.2 Profile methods . . . . . . . . . . . . . . . . .6.2.1Bioclim . . . . . . . . . . . . . . . .6.2.2Domain . . . . . . . . . . . . . . . .6.2.3Mahalanobis distance . . . . . . . . .6.3 Classical regression models . . . . . . . . . .6.3.1Generalized Linear Models . . . . . .6.3.2Generalized Additive Models . . . . .6.4 Machine learning methods . . . . . . . . . . .6.4.1Maxent . . . . . . . . . . . . . . . .6.4.2Boosted Regression Trees . . . . . . .6.4.3Random Forest . . . . . . . . . . . .6.4.4Support Vector Machines . . . . . . .6.5 Combining model predictions . . . . . . . . .414143444748495052525355555758Geographic Null models7.1 Geographic Distance . . . . . . . . . . . . . . . . . . . . . . . . . . . . . . . . . . . . . . . . . . .7.2 Convex hulls . . . . . . . . . . . . . . . . . . . . . . . . . . . . . . . . . . . . . . . . . . . . . . .6363657.i
7.37.4Circles . . . . . . . . . . . . . . . . . . . . . . . . . . . . . . . . . . . . . . . . . . . . . . . . . .Presence/absence . . . . . . . . . . . . . . . . . . . . . . . . . . . . . . . . . . . . . . . . . . . . .8References9Appendix: Boosted regression trees for ecological modeling9.1 Introduction . . . . . . . . . . . . . . . . . . . . . . .9.2 Example data . . . . . . . . . . . . . . . . . . . . . . .9.3 Fitting a model . . . . . . . . . . . . . . . . . . . . . .9.4 Choosing the settings . . . . . . . . . . . . . . . . . . .9.5 Alternative ways to fit models . . . . . . . . . . . . . .9.6 section{Simplifying the model . . . . . . . . . . . . . .9.7 Plotting the functions and fitted values from the model .9.8 Interrogate and plot the interactions . . . . . . . . . . .9.9 Predicting to new data . . . . . . . . . . . . . . . . . .9.10 Spatial prediction . . . . . . . . . . . . . . . . . . . . .9.11 Further reading . . . . . . . . . . . . . . . . . . . . . .ii666771.757576768284848891929496
Spatial Distribution ModelsRobert J. Hijmans and Jane ElithCONTENTS1
Spatial Distribution Models2CONTENTS
CHAPTERONEINTRODUCTIONThis document provides an introduction to species distribution modeling with R. Species distribution modeling (SDM)is also known under other names including climate envelope-modeling, habitat modeling, and (environmental or ecological) niche-modeling. The aim of SDM is to estimate the similarity of the conditions at any site to the conditions atthe locations of known occurrence (and perhaps of non-occurrence) of a phenomenon. A common application of thismethod is to predict species ranges with climate data as predictors.In SDM, the following steps are usually taken: (1) locations of occurrence of a species (or other phenomenon) arecompiled; (2) values of environmental predictor variables (such as climate) at these locations are extracted from spatialdatabases; (3) the environmental values are used to fit a model to estimate similarity to the sites of occurrence, oranother measure such as abundance of the species; (4) The model is used to predict the variable of interest across anthe region of interest (and perhaps for a future or past climate).We assume that you are familiar with most of the concepts in SDM. If in doubt, you could consult, for example, thebook by Janet Franklin (2009), the somewhat more theoretical book by Peterson et al. (2011), or the recent reviewarticle by Elith and Leathwick (2009). It is important to have a good understanding of the interplay of environmental(niche) and geographic (biotope) space – see Colwell and Rangel (2009) and Peterson et al. (2011) for a discussion.SDM is a widely used approach but there is much debate on when and how to best use this method. While we referto some of these issues, in this document we do not provide an in-depth discussion of this scientific debate. Rather,our objective is to provide practical guidance to implemeting the basic steps of SDM. We leave it to you to use othersources to determine the appropriate methods for your research; and to use the ample opportunities provided by the Renvironment to improve existing approaches and to develop new ones.We also assume that you are already somewhat familiar with the R language and environment. It would be particularlyuseful if you already had some experience with statistical model fitting (e.g. the glm function) and with spatial datahandling as implemented in the packages raster and sp. To familiarize yourself with model fitting see, for instance,the Documentation section on the CRAN webpage and any introduction to R txt. For the raster package you canconsult these pages.When we present R code we will provide some explanation if we think it might be difficult or confusing. We will domore of this earlier on in this document, so if you are relatively inexperienced with R and would like to ease into it,read this text in the presented order.SDM have been implemented in R in many different ways. Here we focus on the functions in the dismo and the rasterpackages (but we also refer to other packages). If you want to test, or build on, some of the examples presented here,make sure you have the latest versions of these packages, and their dependencies, installed. If you are using a recentversion of R, you can do that with:install.packages(c('raster', 'rgdal', 'dismo', 'rJava'))This document consists of 4 main parts. Part I is concerned with data preparation. This is often the most time consumingpart of a species distribution modeling project. You need to collect a sufficient number of occurrence records thatdocument presence (and perhaps absence or abundance) of the species of interest. You also need to have accurateand relevant environmental data (predictor variables) at a sufficiently high spatial resolution. We first discuss someaspects of assembling and cleaning species records, followed by a discussion of aspects of choosing and using the3
Spatial Distribution Modelspredictor variables. A particularly important concern in species distribution modeling is that the species occurrencedata adequately represent the actual distribution of the species studied. For instance, the species should be correctlyidentified, the coordinates of the location data need to be accurate enough to allow the general species/environment tobe established, and the sample unbiased, or accompanied by information on known biases such that these can be takeninto account. Part II introduces the main steps in SDM: fitting a model, making a prediction, and evaluating the result.Part III introduces different modeling methods in more detail (profile methods, regression methods, machine learningmethods, and geographic methods). In Part IV we discuss a number of applications (e.g. predicting the effect of climatechange), and a number of more advanced topics.This is a work in progress. Suggestions are welcomed.Robert J. Hijmans and Jane Elith4Chapter 1. Introduction
CHAPTERTWODATA PREPARATION2.1 Species occurrence dataImporting occurrence data into R is easy. But collecting, georeferencing, and cross-checking coordinate data is tedious.Discussions about species distribution modeling often focus on comparing modeling methods, but if you are dealingwith species with few and uncertain records, your focus probably ought to be on improving the quality of the occurrencedata (Lobo, 2008). All methods do better if your occurrence data is unbiased and free of error (Graham et al., 2007) andyou have a relatively large number of records (Wisz et al., 2008). While we’ll show you some useful data preparationsteps you can do in R, it is necessary to use additional tools as well. For example, QGIS, is a very useful program forinteractive editing of point data sets.2.2 Importing occurrence dataIn most cases you will have a file with point locality data representing the known distribution of a species. Below is anexample of using read.table to read records that are stored in a text file.We are using an example file that is installed with the dismo package, and for that reason we use a complex way toconstruct the filename, but you can replace that with your own filename. (remember to use forward slashes in the pathof filenames!). system.file inserts the file path to where dismo is installed. If you haven’t used the paste functionbefore, it’s worth familiarizing yourself with it (type ?pastein the command window).# loads the dismo librarylibrary(dismo)file - paste0(system.file(package "dismo"), "/ex/bradypus.csv")# this is the file we will use:file## [1] ow read it and inspect the values of the filebradypus - read.table(file, header TRUE,# or do: bradypus - read.csv(file)# first rowshead(bradypus)##specieslonlat## 1 Bradypus variegatus -65.4000 -10.3833## 2 Bradypus variegatus -65.3833 -10.3833## 3 Bradypus variegatus -65.1333 -16.8000## 4 Bradypus variegatus -63.6667 -17.4500## 5 Bradypus variegatus -63.8500 -17.4000sep ",")(continues on next page)5
Spatial Distribution Models(continued from previous page)## 6 Bradypus variegatus -64.4167 -16.0000# we only need columns 2 and 3:bradypus - bradypus[,2:3]head(bradypus)##lonlat## 1 -65.4000 -10.3833## 2 -65.3833 -10.3833## 3 -65.1333 -16.8000## 4 -63.6667 -17.4500## 5 -63.8500 -17.4000## 6 -64.4167 -16.0000You can also read such data directly out of Excel files or from a database (see e.g. the RODBC package). Because thisis a csv (comma separated values) file, we could also have used the read.csv function. No matter how you do it, theobjective is to get a matrix (or a data.frame) with at least 2 columns that hold the coordinates of the locations wherea species was observed. Coordinates are typically expressed as longitude and latitude (i.e. angular), but they could alsobe Easting and Northing in UTM or another planar coordinate reference system (map projection). The convention usedhere is to organize the coordinates columns so that longitude is the first and latitude the second column (think x and yaxes in a plot; longitude is x, latitude is y); they often are in the reverse order, leading to undesired results. In manycases you will have additional columns, e.g., a column to indicate the species if you are modeling multiple species; anda column to indicate whether this is a ‘presence’ or an ‘absence’ record (a much used convention is to code presencewith a 1 and absence with a 0).If you do not have any species distribution data you can get started by downloading data from the Global BiodiversityInventory Facility (GBIF). In the dismo package there is a function gbif that you can use for this. The data used belowwere downloaded (and saved to a permanent data set for use in this vignette) using the gbif function like this:acaule - gbif("solanum", "acaule*", geo FALSE)If you want to understand the order of the arguments given here to gbif or find out what other arguments you canuse with this function, check out the help file (remember you can’t access help files if the library is not loaded), bytyping: ?gbif or help(gbif). Note the use of the asterix in “acaule*” to not only request Solanum acaule, but alsovariations such as the full name,*Solanum acaule* Bitter, or subspecies such as Solanum acaule subsp. aemulans.Many occurence records may not have geographic coordinates. In this case, out of the 1366 records that GBIF returned (January 2013), there were 1082 records with coordinates (this was 699 and 54 in March 2010, a tremendousimprovement!)# load the saved S. acaule datadata(acaule)# how many rows and colums?dim(acaule)## [1] 136625#select the records that have longitude and latitude datacolnames(acaule)## [1] "species""continent""country"## [4] "adm1""adm2""locality"## [7] "lat""lon""coordUncertaintyM"## [10] "alt""institution""collection"## [13] "catalogNumber""basisOfRecord""collector"## [16] "earliestDateCollected" "latestDateCollected""gbifNotes"## [19] nues on next page)6Chapter 2. Data preparation
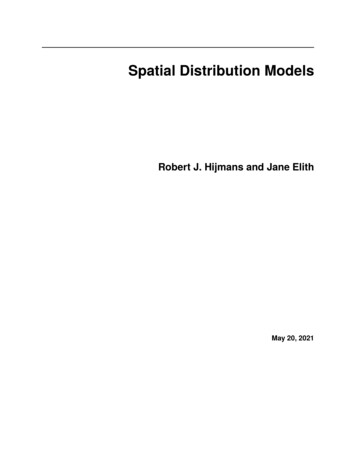
Spatial Distribution Models(continued from previous page)## [22] "maxDepthM""minDepthM"## [25] "cloc"acgeo - subset(acaule, !is.na(lon) & !is.na(lat))dim(acgeo)## [1] 108225"ISO2"# show some valuesacgeo[1:4, c(1:5,7:10)]##speciescontinentcountry adm1adm2## 1Solanum acaule Bitter South America Argentina Jujuy Santa Catalina## 2Solanum acaule Bitter South AmericaPeru CuscoCanchis## 3 Solanum acaule f. acaule NA Argentina NA NA ## 4 Solanum acaule f. acaule NA Bolivia NA NA ##latlon coordUncertaintyM alt## 1 -21.9000 -66.1000 NA NaN## 2 -13.5000 -71.0000 NA 4500## 3 -22.2666 -65.1333 NA 3800## 4 -18.6333 -66.9500 NA 3700Below is a simple way to make a map of the occurrence localities of Solanum acaule. It is important to make suchmaps to assure that the points are, at least roughly, in the right location.library(maptools)data(wrld simpl)plot(wrld simpl, xlim c(-80,70), ylim c(-60,10), axes TRUE, col "light yellow")# restore the box around the mapbox()# add the pointspoints(acgeo lon, acgeo lat, col 'orange', pch 20, cex 0.75)# plot points again to add a border, for better visibilitypoints(acgeo lon, acgeo lat, col 'red', cex 0.75)2.2. Importing occurrence data7
Spatial Distribution ModelsThe wrld simpl dataset contains rough country outlines. You can use other datasets of polygons (or lines or points)as well. For example, you can download higher resolution data country and subnational administrative boundariesdata with the getData function of the raster package. You can also read your own shapefile data into R using theshapefile function in the raster package.2.3 Data cleaningData ‘cleaning’ is particularly important for data sourced from species distribution data warehouses such as GBIF. Suchefforts do not specifically gather data for the purpose of species distribution modeling, so you need to understand thedata and clean them appropriately, for your application. Here we provide an example.Solanum acaule is a species that occurs in the higher parts of the Andes mountains of southern Peru, Bolivia andnorthern Argentina. Do you see any errors on the map?There are a few records that map in the ocean just south of Pakistan. Any idea why that may have happened? Itis a common mistake, missing minus signs. The coordinates are around (65.4, 23.4) but they should in NorthernArgentina, around (-65.4, -23.4) (you can use the “click” function to query the coordintates on the map). There are tworecords (rows 303 and 885) that map to the same spot in Antarctica (-76.3, -76.3). The locality description says that isshould be in Huarochiri, near Lima, Peru. So the longitude is probably correct, and erroneously copied to the latitude.Interestingly the record occurs twice. The orignal source is the International Potato Center, and a copy is provided by“SINGER” that aling the way appears to have “corrected” the country to Antarctica:8Chapter 2. Data preparation
Spatial Distribution Modelsacaule[c(303,885),1:10]##species continentcountry adm1 adm2## 303solanum acaule acaule NA Antarctica NA NA ## 885 solanum acaule acaule BITTER NA Peru NA NA ##localitylatlon coordUncertaintyM alt## 303 NA -76.3 -76.3 NA NaN## 885 Lima P. Huarochiri Pacomanta -76.3 -76.3 NA 3800The point in Brazil (record acaule[98,]) should be in soutern Bolivia, so this is probably due to a typo in the longitude.Likewise, there are also three records that have plausible latitudes, but longitudes that are clearly wrong, as they are inthe Atlantic Ocean, south of West Africa. It looks like they have a longitude that is zero. In many data-bases you willfind values that are ‘zero’ where ‘no data’ was intended. The gbif function (when using the default arguments) setscoordinates that are (0, 0) to NA, but not if one of the coordinates is zero. Let’s see if we find them by searching forrecords with longitudes of zero.Let’s have a look at these records:lonzero subset(acgeo, lon 0)# show all records, only the first 13 columnslonzero[, 1:13]##species continentcountry adm1 adm2## 1159 Solanum acaule Bitter subsp. acaule NA Argentina NA NA ## 1160 Solanum acaule Bitter subsp. acaule NA Bolivia NA NA ## 1161 Solanum acaule Bitter subsp. acaule NA Peru NA NA ## 1162 Solanum acaule Bitter subsp. acaule NA Peru NA NA ## 1163 Solanum acaule Bitter subsp. acaule NA Argentina NA NA ## 1164 Solanum acaule Bitter subsp. acaule NA Bolivia NA NA ##localitylat lon## 1159 between Quelbrada del Chorro and Laguna Colorada -23.7166670## 1160Llave -16.0833340## 1161km 205 between Puno and Cuzco -6.9833330## 1162km 205 between Puno and Cuzco -6.9833330## 1163 between Quelbrada del Chorro and Laguna Colorada -23.7166670## 1164Llave -16.0833340##coordUncertaintyM alt institution collection catalogNumber## 1159 NA 3400IPKGBWKS 30027## 1160 NA 3900IPKGBWKS 30050## 1161 NA 4250IPK WKS 30048304709## 1162 NA 4250IPKGBWKS 30048## 1163 NA 3400IPK WKS 30027304688## 1164 NA 3900IPK WKS 30050304711The records are from Bolivia, Peru and Argentina, confirming that coordinates are in error. Alternatively, it could havebeen that the coordinates were correct, perhaps referring to a location in the Atlantic Ocean where a fish was caughtrather than a place where S. acaule was collected). Records with the wrong species name can be among the hardestto correct (e.g., distinguishing between brown bears and sasquatch, Lozier et al., 2009). The one record in Ecuador islike that, there is some debate whether that is actually a specimen of S. albicans or an anomalous hexaploid varietyof S. acaule.2.3. Data cleaning9
Spatial Distribution Models2.4 Duplicate recordsInterestingly, another data quality issue is revealed above: each record in ‘lonzero’ occurs twice. This could happenbecause plant samples are often split and send to multiple herbariums. But in this case it seems that the IPK (TheLeibniz Institute of Plant Genetics and Crop Plant Research) provided these data twice to the GBIF database (perhapsfrom seperate databases at IPK?). The function ‘duplicated’ can sometimes be use
SpatialDistributionModels (continuedfrompreviouspage) ## 6 Bradypus variegatus -64.4167 -16.0000 # we only need columns 2 and 3: bradypus -bradypus[,2:3]