Transcription
Research Article430What Do Physicians Read (andIgnore) in Electronic Progress Notes?P.J. Brown1; J.L. Marquard2; B. Amster2; M. Romoser2; J. Friderici3; S. Goff3; D. Fisher21Divisionof Clinical Informatics, Baystate Health, Springfield, MA, USA;of Engineering, University of Massachusetts Amherst, Amherst, MA, USA;3Department of Epidemiology & Biostatistics, Baystate Health, Springfield, MA, USAKeywordsElectronic health records, documentation, attention, information seeking behavior, humansSummaryObjective: Several studies have documented the preference for physicians to attend to the impression and plan section of a clinical document. However, it is not clear how much attention other sections of a document receive. The goal of this study was to identify how physicians distribute theirvisual attention while reading electronic notes.Methods: We used an eye-tracking device to assess the visual attention patterns of ten hospitalistsas they read three electronic notes. The assessment included time spent reading specific sections ofa note as well as rates of reading. This visual analysis was compared with the content of simulatedverbal handoffs for each note and debriefing interviews.Results: Study participants spent the most time in the “Impression and Plan” section of electronicnotes and read this section very slowly. Sections such as the “Medication Profile”, “Vital Signs”and “Laboratory Results” received less attention and were read very quickly even if they containedmore content than the impression and plan. Only 9% of the content of physicians’ verbal handoffwas found outside of the “Impression and Plan.”Conclusion: Physicians in this study directed very little attention to medication lists, vital signs orlaboratory results compared with the impression and plan section of electronic notes. Optimizingthe design of electronic notes may include rethinking the amount and format of imported patientdata as this data appears to largely be ignored.Correspondence to:Patrick J. Brown, MDDivision of Clinical InformaticsBaystate Health1550 Main St., 5th FloorSpringfield, MA 01199patrick.brown@bhs.orgphone: (413) 794–0934fax: (413) 794–0885 Schattauer 2014Appl Clin Inform 2014; 5: 430–444DOI: 10.4338/ACI-2014-01-RA-0003received: January 11, 2014accepted: March 30, 2014published: April 23, 2014Citation: Brown PJ, Marquard JL, Amster B, RomoserM, Friderici J, Goff S, Fisher D. What do physicians read(and ignore) in electronic progress notes? Appl Clin Inf2014; 5: 430–444 http://dx.doi.org/10.4338/ACI-2014-01-RA-0003PJ Brown et al.: What Do Physicians Read (and Ignore) in Electronic Progress Notes?This document was downloaded for personal use only. Unauthorized distribution is strictly prohibited.2College
Research Article431Electronic health records (EHRs) have the potential to improve clinical documentation and patientcare by improving the legibility and accessibility of patient notes [1, 2, 3]. Some of the components ofelectronic clinical documentation include narrative text, structured data entry and/or directly imported patient data such as vital signs, laboratory results, or medication lists. Each data format haspotential benefits and limitations for use in the entry and retrieval of information in electronicdocumentation. For example, narrative text enables unrestricted entry of patient information and ispraised for its ability to capture and communicate cohesive patient histories [4]. However, narrativesare not easily searched and do not typically support features such as clinical decision support. Bycontrast, structured data entry can assist electronic documentation through the use of pre-defineddata fields, although physicians complain that structured data entry can be cumbersome [5, 6]. Electronic documents also have the capacity to directly import large volumes of patient data into thenote, although there are concerns that this feature has clogged electronic documents with too muchdata – making it more difficult to glean meaningful information from electronic clinical documents[7, 8, 9].Understanding how clinicians obtain information from electronic clinical documents is gainingmore importance as hospitalized patients are increasingly cared for by teams of physicians who mayhave limited time to familiarize themselves with a patient’s history. While physicians have many information sources available to them when providing care to a hospitalized patient, the electronicprogress note is frequently used to gather an up-to-date assessment of the patient’s condition [10]. Arecent sequential pattern analysis of EHR navigation in an ambulatory clinic showed that physiciansseem to jump to specific areas of a patient chart (e.g. assessment and plan) over others (e.g. medication lists) without regard to the sequential design of the EHR [11]. This has led some to proposeredesigning clinical notes to place this information at the beginning of the note (e.g. APSO notes) orlimit the amount of imported data to lessen the impact of “note-bloat” on a document’s usability [12,13, 14]. However, it is not clear how physicians attend to different areas of a clinical note or whethersections other than the impression and plan receive a proportional amount of attention.2. ObjectivesThe purpose of this study is to use an eye-tracking device to assess how physicians allocate their visual attention when reading electronic notes and determine if their attention is influenced by the volume of information within a particular section of a note. If physicians attend to areas of a note basedon the volume of information, we would anticipate that they would take more time to read notesthat contained more information than others. Similarly, within a given note we would expect physicians to spend relatively more time reading sections that contained proportionally more information. If we can objectively identify how physicians direct their visual attention to different sections ofa note, we may be able to better inform design changes for electronic notes.3. Methods3.1 Setting and SampleThis study was conducted at an academic medical center that has been using an enterprise-wideEHR (Cerner Millennium, Kansas City, MO) since 2005. Forty three hospitalists were asked to takepart in this study through a combination of email announcements and in-person presentations atfaculty meetings. Enrollment was stopped after we reached a convenience sample of ten physicians.3.2 Study ProcedureEach subject read three de-identified electronic progress notes on a computer screen (progress notesare included in the appendix). To limit the impact that a patient’s length of stay in a hospital might Schattauer 2014PJ Brown et al.: What Do Physicians Read (and Ignore) in Electronic Progress Notes?This document was downloaded for personal use only. Unauthorized distribution is strictly prohibited.1. Background
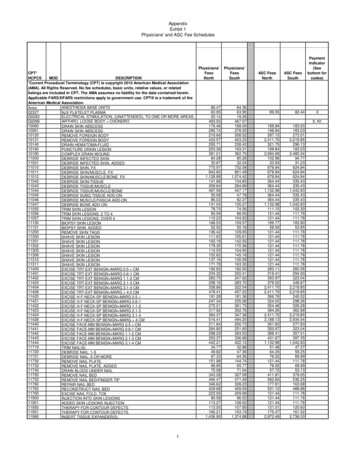
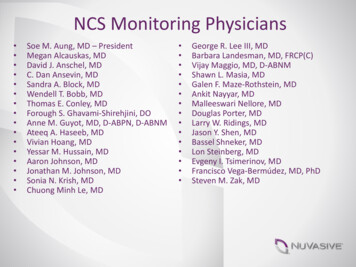
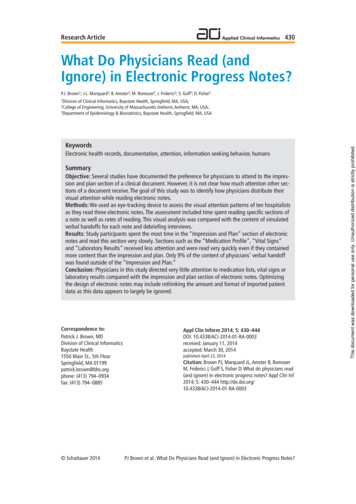
432have on the content and volume of the notes, the three progress notes were all taken from the secondhospital day of an adult medicine service. We chose the first progress note of the hospital stay tolimit the amount of material copied and pasted from other progress notes. The notes were producedusing the EHR’s proprietary note-writing software (PowerNote). This tool allows notes to be produced through a combination of narrative text, data importation and the selection of structured text(point-and-click). The volume and content of imported data can vary at the discretion of each note’sauthor.All of the notes included patients with a primary diagnosis of congestive heart failure althoughother diagnoses such as pneumonia, chest pain, dyspnea, atrial fibrillation, hypertension, etc. werepresents in varying degrees. Notes 1 and 2 included a total of six diagnoses while Note 3 includedseven diagnoses. To limit the chance that a hospitalist might have personal familiarity with a particular note, we chose all of the samples from hospital visits that occurred eighteen months beforethe study was conducted. The three notes were written by different authors.To preserve patient confidentiality, images of the notes were taken using screen capture software(TechSmith, Okemos, MI) and de-identified by redacting data such as the patient’s name, date ofbirth, medical record number, etc. These de-identified images were transferred into an electronicdocument (Microsoft, Redmond WA) with no page breaks to allow subjects to scroll through thenotes on a computer screen in a manner similar to the way electronic notes appear in the EHR. Allof the notes were organized with the same subject headings (e.g. Overnight Events, Review of Systems, Physical Exam.) but varied in the amount of narrative text, structured data entry, and imported data within each subject heading.Subjects viewed the notes on a computer screen as if they were in the EHR and were instructed toread each note at their own pace with no time limit applied. To record their visual attention patterns,subjects wore a portable eye-tracking device while reading. The ASL Mobile Eye (Applied ScienceLaboratories, Bedford, MA) is a lightweight (76 grams), tetherless eye-tracking device that includesa scene camera, eye optics, ultraviolet light source and ultraviolet reflecting monocle all mounted onsafety glasses ( Figure 1). The Mobile Eye software program overlays cross hairs on a video, specifying the exact locations where the subjects fixated as they read the notes and conducted the handoffs. This type of visual scanning data is commonly used as proxy for visual attention [15, 16].After calibrating the eye-tracking device for each participant, subjects were asked to read eachnote one at a time and dictate a verbal handoff to summarize the case as if they were transitioningcare to another hospitalist. We added the verbal handoff task to establish a specific context for theparticipants and provide a way to analyze the link between where participants directed their visualattention and what they thought was important to convey in their summary. This approach reducesthe probability of making erroneous conclusions based solely on observations of visual scanningpatterns. After reading and conducting handoffs for the three notes, we asked each subject the following debriefing questions:1. Were the notes believable?2. What strategies do you typically use to read notes?3. How does context influence how you approach reading a note?The dictations and interviews were recorded, transcribed and analyzed for content.3.3 Note analysisBecause all of the notes utilized the same heading structure (e.g., “Overnight Events” always preceded “Review of Systems” followed by “Physical Examination”, etc.) it was possible to map each noteinto nine “zones”, shown in Figure 2. However, because different zones of the notes contained different types of data (e.g., numbers in the vital signs and laboratory results and words in other zones)we utilized character count rather than word count to standardize the volume of data in each zone.The character count of each zone was analyzed to compare the volumes of text in each zone acrossthe three notes. Schattauer 2014PJ Brown et al.: What Do Physicians Read (and Ignore) in Electronic Progress Notes?This document was downloaded for personal use only. Unauthorized distribution is strictly prohibited.Research Article
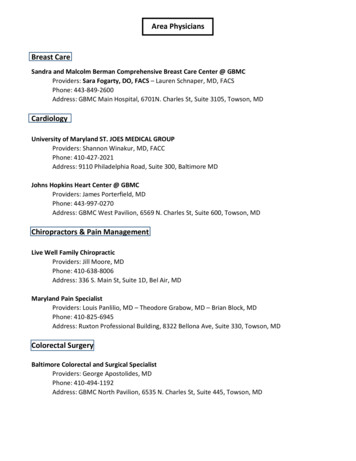
Research Article433Visual attention was measured via the eye-tracking device data in terms of “fixations” and “glances”.A fixation is defined as visual attention directed at the same location for 0.1 seconds or more while aglance is defined as a series of consecutive fixations within an area of interest [17]. The eye tracker isaccurate to within 0.5 degrees of visual angle. To account for this level of accuracy, eye fixationswere counted if the subject looked within a 1 cm border around one of the nine pre-defined zones( 0.5 degrees 1.1cm in our study). We used ASL Result Pro software (Bedford, MA) to determinethe locations and durations of subjects’ fixations. This software allows the investigator to draw boxesto articulate where a zone begins and ends. Two analysts went through the video frame-by-frame tomake sure that the boxes were in the correct locations. We then analyzed the total amount of timethat each subject read each note and the time they spent glancing at the text within each zone.Principal outcomes included raw reading time in seconds as well as seconds per character (reading time in seconds divided by characters per zone). When necessary, dependent variables weretransformed to meet assumptions of normality and examined using repeated-measures analysis ofvariance or linear mixed models with “individual” specified as random effect. Fixed effects includedcategorical variables for note (3 levels) and zone (9 levels); these were tested in a backwards fashionusing the Wald test (alpha 0.05). Once the final models were specified, marginal means were estimated with 95% confidence intervals derived using the Delta method. Pairwise comparisons wereperformed using linear combinations of coefficients. Statistical analyses were performed in (Excel)or Stata/MP 12.1 for Windows (Copyright 1985–2011 StataCorp LP).3.5 Verbal handoff analysisThe audiotaped handoffs were transcribed and organized into discrete statements for the purpose ofcoding. A second author reviewed the discrete statements and disagreement in how the text was organized was resolved through discussion. Discrete statements were then coded by by two investigators using the “SIGNOUT” categories previously developed for describing elements of a handoff[18]. The investigators coded each of the 30 transcripts independently. The first note (10 transcripts)was used to develop consensus in coding and the second two notes (n 20) were used to assessinter-rater reliability [19]. The SIGNOUT categories include 8 pre-defined elements of a handoff:1. Sick or DNR (highlights unstable patients and DNR/DNI status)2. Identifying Data (name, age, gender, diagnosis)3. General hospital course (hospital course up to the current hospital day)4. New events of day (specific events on the current hospital day)5. Overall health status/Clinical condition6. Upcoming possibilities with plan, rationale (theoretical concerns)7. Tasks to complete overnight with plan, rationale (specific instructions)8. Any questions? (opportunity for the recipient of sign-out to ask questions).A “0” code was used for statements that were not pertinent to these elements. Because subjects inthis study were providing an audiotaped handoff, there was no opportunity for questions. Therefore,we excluded the last element of SIGNOUT and replaced this with an “other” category onto which wecould map statements both coders felt did not fit any of the other seven categories.To map the handoff information within each of the SIGNOUT categories to specific zones of acorresponding note, the statements were matched to any zone where that information could possibly be found. If a statement could be found in more than one zone, both zones were included aspossibilities. For example, a statement such as “This is a 75 year old gentleman” could be found inboth the Demographic zone of the note (where age and gender are included) as well as the Impression and Plan zone. An example of this method is illustrated in Figure 3. After assigning zones toeach statement we then calculated the percentage of the total statements in each zone for that noteand compared percentages across zones. Schattauer 2014PJ Brown et al.: What Do Physicians Read (and Ignore) in Electronic Progress Notes?This document was downloaded for personal use only. Unauthorized distribution is strictly prohibited.3.4 Visual attention analysis
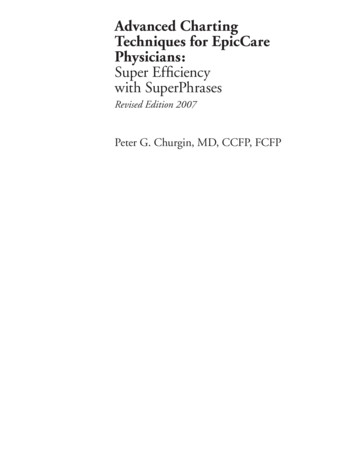
Research Article4344. Results4.1 SubjectsOur sample (n 10) included five men and five women with an average age of 37 years (range from34 to 42 years). The average time since the completion of residency for the group was 6 years (rangefrom 3 to 8 years).4.2 Note Analysis“Impression and Plan” and “Medication Profile” zones showed the highest relative volumes of text,although there was considerable variation in the volume of text between notes. For example, approximately one third of the volume of Note 1 was contained in the “Impression and Plan” zone withanother third in the “Medication Profile”. Note 3 also had about a third of its volume in the “Impression and Plan” but only 2% of its volume in the “Medication Profile”. By contrast, Note 2 had only12% of its volume in the “Impression and Plan” zone but almost 50% of the note volume in the“Medication Profile”.4.3 Visual Attention AnalysisThe average reading duration across all notes was 112 seconds. The averaged time ranged from 103– 121 seconds across the three notes, with additional variation seen among the ten subjects’ averagereading times (range 62 – 193 seconds). In unadjusted analyses, a two-way ANOVA showed significant differences between subjects (F-test p-value 0.001) and notes (F-test p-value 0.04).When assessing reading duration compared to character count we found that subjects on averagetook more time to read notes with a greater volume of text, even after adjusting for contents of zoneand note (adjusted estimate 0.005 seconds per additional character, 95% CI 0.002, 0.009). Forexample, Note 2 had the highest character count (5371) and on average took the most time to read(121 seconds) while Note 3 had the lowest character count (2096) and on average took the least timeto read (103 seconds). A significant linear association was found between time spent reading andcharacter count (univariable R2 0.24, p 0.001) when assessing the entire note.Within notes, we found that physicians spent an overwhelming amount of their time reading the“Impression and Plan” over other zones. As shown in Figure 5 and Figure 6, subjects demonstrated the longest glance duration and slowest reading rate in this zone for each note (p 0.001, allpairwise comparisons). By contrast, subjects seemed to spend very little time in other zones such asthe “Medication Profile”. Figure 7 highlights the stability of this association across character countand note. Irrespective of the percent character count (horizontal axis), the Impression and Plan zoneconsistently receives the highest percent glance duration in all three notes. Conversely, the Medication Profile zone consistently receives the lowest percent glance duration, regardless of the amountof data contained within that zone.4.4 Verbal Handoff Content AnalysisThe verbal handoffs contained between 68 and 76 discrete statements per note. Inter-rater reliabilityfor category assignment was 90%. The most common codes assigned were #3 General HospitalCourse and #2 Identifying Data ( Table 1).4.5 Verbal Handoff MappingThe coded statements mapped to one of four categories: “Impression and Plan exclusively”, “Impression and Plan & other zones”, “Zones other than Impression and Plan exclusively”, and “No identified zone”. Table 2, demonstrates that most coded statements could be mapped to the “Impressionand Plan” zone of the note; either exclusively (36%) or in combination with other zone(s) (45%).Taken together, these two groups contributed to 81% of the statements in the verbal handoffs with Schattauer 2014PJ Brown et al.: What Do Physicians Read (and Ignore) in Electronic Progress Notes?This document was downloaded for personal use only. Unauthorized distribution is strictly prohibited. Figure 4 displays the percentage of characters located in each zone of the notes. On average, the
Research Article435only 9% of the verbal handoff statements not having material included in “Impression and Plan” and10% of statements mapped to “No identified zone”. Examples of statements with “No identifiedzone” would include comments such as “That’s it”, “Done”, etc.4.6 Debriefing interveiwsWhen I look to give sign-out I tend to go straight to the summary section of the ‘Assessment and Plan’ becausethat tells
glance is defined as a series of consecutive fixations within an area of interest [17]. The eye tracker is accurate to within 0.5 degrees of visual angle. To account for this level of accuracy, eye fixations were counted if the subject looked within a 1 cm border around one of the nin