Transcription
A JOB CLASSIFICATION ANDCOMPENSATION PLANFOR THE CITY OFMIAMI BEACH, FLORIDAAugust 2009Condrey and Associates, Inc.PO Box 7907Athens, Georgia 30604-7907www.condrey-consulting.com
Table of ContentsIntroduction . 1The Classification Plan . 8The Compensation Plan . 11Cost of Implementation. 16Future Pay Practices . 20Appendix A-1:Appendix A-2:Appendix A-3:Appendix B:Appendix C:Appendix D:Appendix E:Salary Survey Summary . 27Salary Survey Summary – Updated . 29Salary Survey Summary – South Florida . 31Position/Grade Analysis by Grade. 33Best Practices and Benefits Survey Summary . 43Best Practices and Benefits Survey Instrument . 63Position Description Questionnaire . 68
IntroductionAt the request of the City of Miami Beach, Condrey and Associates, Inc. entered into acontract with the City for the development of a job classification and compensation plan. Aclassification and compensation study is conducted every seven to ten years by mostorganizations. A classification and compensation study balances internal equity (the relationshipof positions to each other within an organization) and external equity (the relationship ofpositions to the external labor market). If a study is not conducted for a period of time, somepositions continue to be paid below their internal and external worth to the organization, whilesome positions exceed it. Therefore, a classification and compensation study is a necessary stepthat healthy, functioning organizations should undertake every seven to ten years.Compensation is more than what a person receives in remuneration from an organization.It has as much to do with the effective management of the organization as does a good leader or amodern budgeting structure. Compensation helps indicate to organizational members how theyare viewed by the organization—either positively or negatively. It can also either be astraightjacket for managers or allow them to better manage their workgroup. In other words, thecompensation system comprises a crucial part of the administrative infrastructure of theorganization.A good compensation system balances internal equity versus external equity. A goodcompensation plan seeks a system that makes sense internally across the organization and is alsocompetitive externally in the relevant comparable labor market. Much employee dissatisfactionwith pay concerns their personal assessment of how they are paid relative to others within theirown organization (internal equity). If one group of employees perceives another to be paid morehighly for a similar level of work, resentment can result. This resentment can lead to increased1
turnover, lower productivity and general discontent in the workplace along with morale andretention issues across the organization. Only by conducting a classification and compensationstudy can an organization determine if its system is internally valid and externally competitive.The objectives of the study included:1.Reviewing and revising the current classification system and pay plan for all Cityclassifications and employees;2.Collecting wage survey data from comparable jurisdictions;3.Producing a recommended pay plan based on job analysis, job evaluation, and wagesurvey data;4.Developing new job descriptions for all 388 City classifications;5.Identifying best practices of other public jurisdictions and private entities across thecountry related to controlling personnel costs;6.Developing practical strategies to control future escalation of personnel costs in theCity of Miami Beach; and7.Assessing the impact of proposed changes including the impact on the community,employee morale, cost impacts, and other supporting requirements.The process used to collect the necessary data and develop the classification andcompensation plan consisted of several steps and phases. The first step involved the distributionof a position description questionnaire to all City employees (see Appendix E, page 68). Thequestionnaire covered major aspects of the employee's position as well as the physical demandsand work environment of the position. A position questionnaire was received for everyemployee classification. After reviewing the information on the position questionnaires,Condrey and Associates interviewed employees individually and developed a classificationrecommendation for each position. Approximately 500 position incumbents were personallyinterviewed for the study, representing at least one person in each of the City’s 388classifications. Our experience in interviewing the City’s employees was a positive one.2
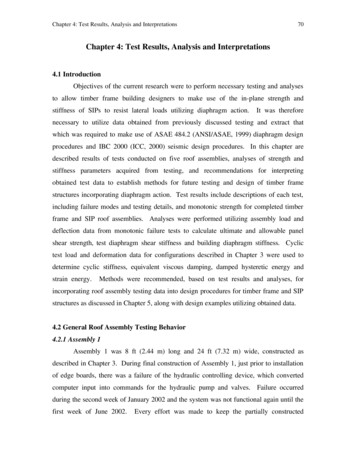
Employees responded to the position questionnaires properly and the interviews with employeeswere very well received. The City should take pride in its competent and professional workforce.The next step in the work plan involved evaluating each classification for grade assignment.In order to provide a reliable set of ratings, all positions were rated by Condrey and Associatesutilizing the Factor Evaluation System (FES). An explanation of FES can be found on page 8 ofthis report. Additionally, exempt and non-exempt (overtime eligible) classification designationswere analyzed as mandated by the Fair Labor Standards Act (FLSA) and Equal EmploymentOpportunity (EEO) class codes were analyzed for each position.The project also involved collecting salary survey information. Condrey and Associates, inassociation with the University of Florida’s Florida Survey Research Center, conducted a salarysurvey of selected public and private organizations specifically for this study. Most of the localgovernments included in the survey are jurisdictions that the City of Miami Beach has used in thepast for other benchmarking purposes, such as their community satisfaction surveys andenvironmental scans. These jurisdictions are similar and/or comparable to Miami Beach in anumber of ways, including in any and/or all of the following: geographic size, population,tourism community, entertainment community, communities within the South Florida region,etc. In addition to these local governments, a number of other local public organizations that alsoare major employers in the area were benchmarked, including Jackson Memorial Hospital andMiami Dade College. The private sector organizations used for this survey included several locallarge employers such as Mt. Sinai Hospital, Ryder and the University of Miami. The surveyrespondents are listed in Table I. Summary results of the survey are presented in Appendix A-1.Appendix A-1 shows the mean and median for the minimum, maximum, and actual averagesalary rates of the survey respondents. The mean is the arithmetic average of the data. The3
median is the midpoint of the data. For example, one half of the respondents reported salariesabove this number; one half reported salaries below it.It should be noted that after presentation of the initial report in March 2009, the City ofMiami Beach, in conjunction with Condrey and Associates, gathered additional information fromseveral south Florida jurisdictions and two California jurisdictions. These additionaljurisdictions are outlined in Appendix A-2; Appendix A-3 displays the salary survey summary ofparticipating public and private organizations in South Florida.In order to make the salary survey data comparable to the City of Miami Beach, all surveydata was normed. Norming is a methodology that allows one to make an “apples to apples”comparison of salary information from sources in different geographic regions. Essentially, weutilized the City of Miami Beach cost-of-living data (115.9% of the national average) as aconstant in converting salaries from other cites into “Miami Beach dollars.” For example, usingMiami Beach as a point of comparison converts a 70,000 salary reported by the City of Atlanta(96.1% of the national cost-of-living index) to 84,420 in the City of Miami Beach (115.9 96.1 1.206; 1.206 x 70,000 84,420). Conversely, a 70,000 salary reported by the City of SanFrancisco would only translate to 47,460 in the City of Miami Beach since its cost-of-living is170.9% of the national average.Analysis of the salary data shows a very reliable sample with average normed andunnormed data producing very similar results. Furthermore, including or excluding privatesector data produced no significant difference in results. For example, the summary of the salarysurvey results presented on page 28 reports that the “minimum annual rate median” for theposition of Senior Systems Analyst is 57,635 for all survey respondents. When the respondentdata is divided into public and private sector categories, the public sector median is 58,558; the4
private sector median is 57,031. The large initial response rate (approximately 70%), coupledwith the attention given survey data compilation by the University of Florida, and additionalsalary information gathered by the City, has produced a very reliable resource for the City ofMiami Beach.A survey of benefits and best practices (exemplary behaviors of comparable organizations)was also conducted along with a review of published information for total compensation costcontainment including approaches for cost of living adjustments, pension increases, changes tobenefits, etc. The results of the best practice and benefits survey are fully presented in AppendixC.In addition to collecting additional salary survey information after publication of the March2009 report, Condrey and Associates met with representatives of each department and four of thefive unions to discuss the report. Based on this input and additional salary information, somemodifications were made to the initial report. We appreciate the cooperation of all involved inthis process and believe it strengthens the classification and compensation recommendationscontained herein.The most significant change supported by the new survey data was the maintenance ofparity between entry-level police and fire positions. Data presented in Appendix A-3demonstrates that the South Florida average entry-level salary for Firefighter ( 44,551) is slightlyhigher than that of entry-level Police Officer ( 43,293). This is contrary to the national trend andsupports salary parity between these important public safety positions.5
Table ISalary Survey RespondentsArizonaCity of ScottsdaleCaliforniaCity of Beverly HillsLos Angeles County*City of San Diego*City of San FranciscoCity of Santa BarbaraCity of Santa MonicaCity of West HollywoodFloridaBroward County*City of ClearwaterCity of Coral GablesCity of Coral Springs*City of Daytona BeachCity of Ft. LauderdaleCity of HialeahCity of Hollywood*City of Key Biscayne*City of Key WestCity of MiamiMiami-Dade CountyCity of PensacolaCity of St. PetersburgJackson Memorial HospitalMiami-Dade CollegeMount Sinai HospitalRyderUniversity of Miami* Salary information from this organization was included after the initial March 2009 report.6
GeorgiaCity of SavannahHawaiiCity of HonoluluMarylandCity of AnnapolisNorth CarolinaCity of CharlotteSouth CarolinaTown of Hilton Head IslandTexasCity of GalvestonVirginiaCity of Virginia BeachWashington, DCCity of Washington, D.C.7
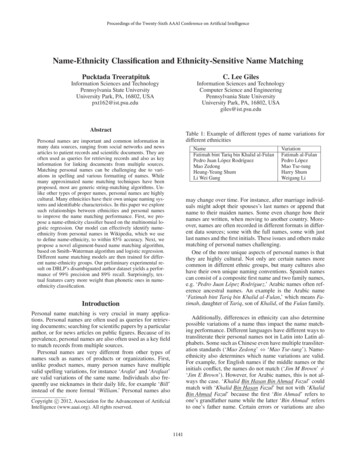
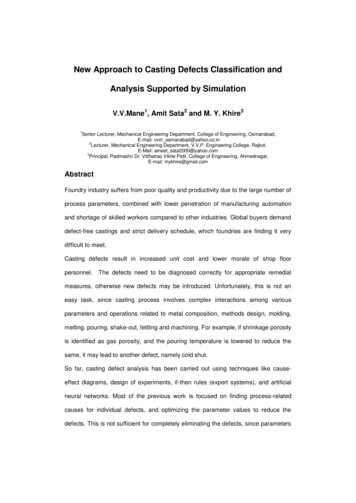
The Classification PlanThe system used to classify the jobs in the City of Miami Beach is an adapted version of theFactor Evaluation System (FES). FES was developed by the U.S. Civil Service Commission(now the Office of Personnel Management) and is considered to be a state-of-the-art system inpublic human resource management.FES is a point-factor-comparison evaluation system that uses nine factors for theevaluation of jobs: (1) Knowledge Required by the Position, (2) Supervisory Controls, (3)Guidelines, (4) Complexity, (5) Scope and Effect, (6) Personal Contacts, (7) Purpose of Contacts,(8) Physical Demands, and (9) Work Environment. In order to adapt it to this setting, a tenthfactor covering supervisory responsibility was utilized as described by Henderson and Clarke1.The factors are weighted (i.e., Knowledge Required by the Position "counts more" than PhysicalDemands). Each factor has several levels, and each level is assigned a specified number ofpoints. The combined score on all the factors determines the total number of points for eachposition and its assignment to a grade in the classification plan. Table II displays the FESfactors. Table III presents an example of how the factor scores are tallied (see Tables II and III).Appendix B depicts the grade level assigned all City positions. The assigned grade levels reflecta combination of data generated by FES, the salary surveys, and a review of organizationalrelationships within the City.Based on hierarchical alignment, the point factor system we utilized appears to produceresults similar to the system previously employed by the City of Miami Beach. An exception isthat labor and trade positions are now rated slightly higher in relative comparison to their internalcounterparts. It is our opinion that the new internal value system is not a radical departure fromthe one previously utilized, but rather an enhancement of such.1Henderson, Richard I. and Kitty W. Clark, Job Pay for Job Worth: Designing, Managing, and InvolvingEmployees in an Equitable Job Classification System, University Press, June 1994.8
Table IIFactor Evaluation SystemDescription of FactorsFactor 1: Knowledge Required by the PositionooKind or nature of knowledge and skills needed; andHow these knowledges and skills are used.Factor 2: Supervisory ControlsoooHow the work is assigned;The employee’s responsibility for carrying out the work; andHow the work is reviewed.Factor 3: GuidelinesooThe nature of guidelines for performing the work; andJudgment needed to apply the guidelines or develop new guides.Factor 4: ComplexityoooNature of the assignment;Difficulty in identifying what needs to be done; andDifficulty and originality involved in performing the work.Factor 5: Scope and EffectooPurpose of the work; andImpact of the work product or service.Factor 6: Personal ContactsoPeople and conditions under which the contacts are made (except supervisor).Factor 7: Purpose of ContactsoReasons for contacts in Factor 6; skill needed to accomplish work through person-to-person activities.Factor 8: Physical DemandsoThe nature, frequency, and intensity of physical activity.Factor 9: Work environmentoThe risks and discomforts imposed by physical surroundings and the safety precautions necessary to avoidaccidents or discomfort.Factor 10: Supervisory and Management ResponsibilityoThe level of management responsibility assumed by the position.9
Table IIISample Factor Evaluation ScoresAny City, USAFACTOR 1FACTOR 2FACTOR 3FACTOR 4FACTOR 5FACTOR 6FACTOR 7FACTOR 8FACTOR 9FACTOR PLEXITYSCOPE &EFFECTPERSONALCONTACTSPURPOSE ESPNSBLTY------LVL 7------PTS 1250------LVL 5------PTS 650------LVL 4------PTS 450------LVL 4------PTS 225------LVL 4------PTS 225------LVL 3------PTS 60------LVL 3------PTS 120------LVL 1------PTS 5------LVL 1------PTS 5------LVL 6------PTS 450TOTAL 3440GRD 26GRD 26DPT/DIV PD/1JOB TITLE Job A25HR/1Job b C695044503275422542252252501515215023602119DS/6Job D69504450327542253150225250151515021851917FIN/6Job E57503275327531503150225250151515017351616DC/2Job ob G45503275212527527522525015151501235129CD/6Job H335021252125275275225120151515085599FIN/8Job I3350212521252752752251202201515087097PR/9Job J220021252125275275110120220220150720710
The Compensation PlanThe compensation plan developed for the City is based on an internal value systemreflected in the classification plan and on a salary survey of comparable organizations to helpassure an externally equitable and competitive pay system.The pay plan consists of thirty grades. Tables IV – A, B and C display the proposed salaryscales. Compensation Plan A reflects salaries at 115% of the market (or average compensation)or approximately the third quartile of responding organizations. Placing the salary scale at 115%of the labor market means that a market salary of 40,000 would translate to 46,000. At thislevel, the entry-rate for the organization would be greater than approximately 75% of competingorganizations. Compensation Plan B reflects salaries at 107.5% of the market (a 40,000 marketsurvey salary would translate to 43,000, with Miami Beach’s entry-rate greater thanapproximately 62% of its competitors), and Compensation Plan C reflects salaries at 100% of themarket (a 40,000 market survey salary would remain at 40,000 with the entry-rate for theorganization greater than approximately 49% of salary survey respondents). The proposed salaryrange for grades 1-23 (non-management level positions) is fifty percent from the minimum to themaximum of the pay range (65% for grades 24-30, management-level positions). The City’scurrent salary ranges for each grade is anywhere between 10% (for certain Fire and Policepromotional positions) all the way up to 61.5% from the minimum to the maximum of the payranges. There does not appear to be any difference between classified and unclassified(management-level v. non-management-level).The range for all proposed grades continues to be deliberately broad so that problemsassociated with employees reaching the top of their pay range will be minimized.The range is greater for positions in grades 24-30 since national recruitment strategies arenormally required for these management-level positions. Department director positions areplaced at grade 27/28 in the new pay plan. This flexibility in hiring department directors will11
allow the City to adjust salary offers to match the particular qualifications of a successfulapplicant for these important positions. This is not unusual among large organizations and isused as a pay banding strategy to insure competitiveness in the labor market for thesemanagement-level positions. Further, it is recommended that unlike the City’s current system,where no additional compensation is provided for maxed out employees other than the COLA,the City should consider a policy that once employees reach the top of the range,performance/merit increases should be earned as a lump sum payment (one-time “bonus”) ratherthan being added to base salary. This will help alleviate retention and motivation problemsassociated with employees who have "maxed out" of their pay range. The broad pay range andlump sum payment process are considered to be best practices in allowing a jurisdiction toeffectively manage its compensation system on a long-term basis.In order to keep the proposed salary table current, a periodic market adjustment (based onmarket conditions) should be considered. This adjustment should be applied to the salaryschedule and as a general percentage s
The Classification Plan The system used to classify the jobs in the City of Miami Beach is an adapted version of the Factor Evaluation System (FES). FES was developed by the U.S. Civil Service Commission (now the Office of Personnel Management) and is considered to be a sta