Transcription
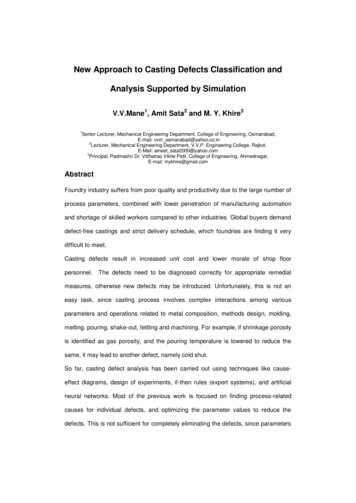
New Approach to Casting Defects Classification andAnalysis Supported by SimulationV.V.Mane1, Amit Sata2 and M. Y. Khire31Senior Lecturer, Mechanical Engineering Department, College of Engineering, Osmanabad,E-mail: vvm osmanabad@yahoo.co.in2Lecturer, Mechanical Engineering Department, V.V.P. Engineering College, Rajkot,E-Mail: ameet sata2000@yahoo.com3Principal, Padmashri Dr. Vitthalrao Vikhe Patil, College of Engineering, Ahmednagar,E-mail: mykhire@gmail.comAbstractFoundry industry suffers from poor quality and productivity due to the large number ofprocess parameters, combined with lower penetration of manufacturing automationand shortage of skilled workers compared to other industries. Global buyers demanddefect-free castings and strict delivery schedule, which foundries are finding it verydifficult to meet.Casting defects result in increased unit cost and lower morale of shop floorpersonnel.The defects need to be diagnosed correctly for appropriate remedialmeasures, otherwise new defects may be introduced. Unfortunately, this is not aneasy task, since casting process involves complex interactions among variousparameters and operations related to metal composition, methods design, molding,melting, pouring, shake-out, fettling and machining. For example, if shrinkage porosityis identified as gas porosity, and the pouring temperature is lowered to reduce thesame, it may lead to another defect, namely cold shut.So far, casting defect analysis has been carried out using techniques like causeeffect diagrams, design of experiments, if-then rules (expert systems), and artificialneural networks. Most of the previous work is focused on finding process-relatedcauses for individual defects, and optimizing the parameter values to reduce thedefects. This is not sufficient for completely eliminating the defects, since parameters
related to part, tooling and methods design also affect casting quality, and these arenot considered in conventional defect analysis approaches.In this work, we present a 3-step approach to casting defect identification, analysisand rectification. The defects are classified in terms of their appearance, size,location, consistency, discovery stage and inspection method. This helps in correctidentification of the defects. For defect analysis, the possible causes are grouped intodesign, material and process parameters. The effect of suspected cause parameterson casting quality is ascertained through simulation. Based on the results and theirinterpretation, the optimal values of the parameters are determined to eliminate thedefects.The proposed approach overcomes the difficulty of controlling process parameters infoundries with manual processes and unskilled labor, by making the design morerobust (less sensitive) with respect to process parameters. This will especially helpSME foundries to significantly improve their quality levels.1. IntroductionMetal casting is one of the direct methods of manufacturing the desired geometry ofcomponent. The method is also called as near net shape process. It is one of theprimary processes for several years and one of important process even today in thest21 century. Early applications of casting are in making jewellery items and goldenidols. Today, casting applications include automotive components, spacecraftcomponents and many industrial & domestic components, apart from the art andjewellery items.The principle of manufacturing a casting involves creating a cavity inside a sandmould and then pouring the molten metal directly into the mould. Casting is a veryversatile process and capable of being used in mass production. The size ofcomponents is varied from very large to small, with intricate designs. Out of theseveral steps involved in the casting process, moulding and melting processes are
the most important stages. Improper control at these stages results in defectivecastings, which reduces the productivity of a foundry industry. Generally, foundryindustry suffers from poor quality and productivity due to the large number of processparameters, combined with lower penetration of manufacturing automation andshortage of skilled workers compared to other industries. Also, Global buyers demanddefect-free castings and strict delivery schedule, which foundries are finding it verydifficult to meet.Casting process is also known as process of uncertainty. Even in a completelycontrolled process, defects in casting are found out which challenges explanationabout the cause of casting defects. The complexity of the process is due to theinvolvement of the various disciplines of science and engineering with casting. Thecause of defects is often a combination of several factors rather than a single one.When these various factors are combined, the root cause of a casting defect canactually become a mystery. It is important to correctly identify the defect symptomsprior to assigning the cause to the problem. False remedies not only fail to solve theproblem, they can confuse the issues and make it more difficult to cure the defect.The defects need to be diagnosed correctly for appropriate remedial measures,otherwise new defects may be introduced. Unfortunately, this is not an easy task,since casting process involves complex interactions among various parameters andoperations related to metal composition, methods design, molding, melting, pouring,shake-out, fettling and machining. The proper classification and identification of aparticular defect is the basic need to correct and control the quality of casting.2. Present Approaches for Analysis of Casting DefectsAt present, casting defect analysis is carried out using techniques like historical dataanalysis, cause-effect diagrams, design of experiments, if-then rules (expertsystems), and artificial neural networks (ANN). They are briefly explained in thissection.
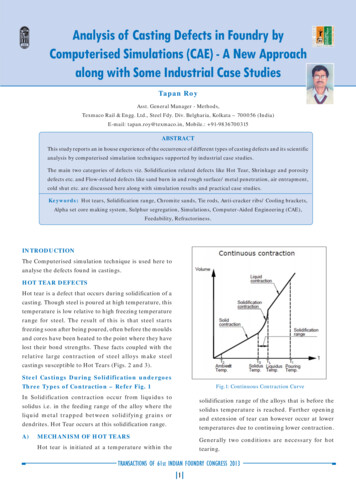
2.1 Historical Data AnalysisTo understand this concept, data for occurrence of defects are collected from one ofleading casting manufacturer in Maharashtra for one year. From this data,occurrence chart has been prepared which further helps to identify occurrence majordefects in castings. These data further help to prepare the chart for occurrence ofdefect. The details are shown in table 1 and fig. 1.Table1.Historical Data of casting defectsRejectedQuantityJobRejection %Cold ShutCrush2051882.302.11Knock Crack1651.85BlowholeContractor’sHouling Cracks12355DefectsRejectedQuantityJobRejection %16130.170.14100.111.38Cores BrokenMismatchSub. ContractFettling 10.010.00311.1012 %0.47ScabFet. CrackShrinkageSlagBad 20.010.01SwellSinkCore 0.010.003Low 0.030.07HardOthers0.07RunoutFigure 1: Pareto Analysis of Casting DefectsSlurry 0.040.11Fettling 0.140.17Cores 0.21Bad et. 0.47Houling BlowholeCrushCold Shut0Knock 0.621Bad Mold1.382Percentage RejectionSlurryPenetrationLow HardnessCore ScabSwellSinkOthers2.11Bad MoldDefects
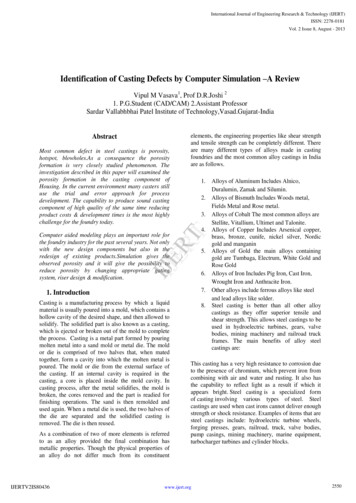
2.2Cause- Effect diagramCause- effect diagram is one of the approaches to enumerate the possible causes.When all possible causes are known to us, the operating conditions are verified andapplied to determine the potential cause item by item. As the primary factors areidentified, they are further examined to find the specific problems that cause thedefects. After the particular cause has been identified, remedies are suggested toeliminate the defects. Examples (data collected for various defects occurred duringsand casting for one year at one of leading casting manufacture in Maharashtra) forchecking the individual cause-effect for some of the defects are listed below.Material: FC 200 (Gray cast iron) & Production: 18000 casting /month (Approximate)2.2.1 CrushThe cause-effect diagram is as shown in fig. 2.Based on experience in foundry,following remedies are suggested:Remedies: Change the hardness of mould. Proper clamping of mould boxes. Use of appropriate sand with adequate green compressive strength, Use proper pins. Properly clean the pattern and mould before moulding.2.2.2 ShrinkageThe cause-effect diagram for shrinkage is shown in fig. 2. Suggested remedies are asfollows:Remedies: Use the suitable composition that is adjusted silicon and (1.80 to 2.10) orcarbon equivalent (3.9 to 4.1) .Carry out proper ramming and maintainoptimum pouring temperature and time.
2.2.3 Cold ShutThe cause-effect diagram for cold shut is shown in fig.4. Based on experience infoundry, following remedies are suggested:Remedies: Smooth pouring with the help of monorail.Figure 2: The cause Effect diagrams for crushFigure 3: The cause Effect diagrams for crush
Properly transport mould during pouring. Arrange proper clamping arrangement2.2.4 MismatchThe cause-effect diagram for mismatch is shown in fig.5. Based on experience infoundry, following remedies are suggested:Figure 4: The cause Effect diagrams for cold shutFigure 5: The cause Effect diagrams for Mismatch
Remedies: Properly arrange box warpage. Properly move boxes with pins. Properly clamp the boxes.The cause-effect diagram can easily determine causes of defects and suggest theirremedies to eliminate the problems. The main limitation of the cause effect diagram isthat it largely depends on the experience and traditionally, it is prepared byexperience or intuitively. Also, cause effect diagrams are not easily found out inliterature except few casting defects.2.3 Design of Experiments (DoE)In casting processes, there are various parameters with different adjustment levelsmay influence the defects in casting. For each type of defect, several causes havebeen listed under differing categories such as design, moulding and pouring/meltingrelated parameters. The focus of the design of experiment is on the robustness of thecasting parameters. The methodology to achieve optimized process parameters areas given below: Any defect is selected which is needed to be analyzed. For example, manyinternal defects (shifts, warpage, blow holes, drop etc.) largely depends on themoulding. The target of process is to achieve “lower casting defects” by adjusting theprocess parameters. Select the most significant parameters that cause the defects in casting. Theseparameters can be identified by the cause effect diagram. Plan the experiments as per either design of experiments or orthogonal array(OA) and parameter levels. Based on the experimental conditions, collect thedata.
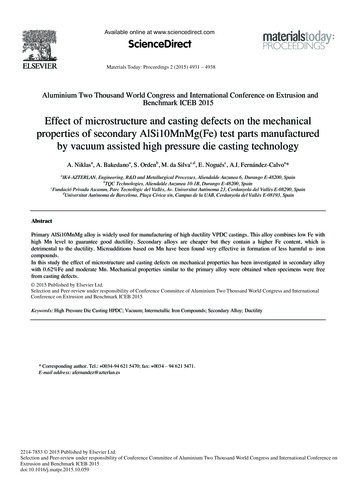
Analyze the data. An analysis of variance (ANOVA) table can be generated todetermine the statistical significance of the parameters. Response graphs can beplotted to determine the preferred levels for each parameter of the process. Decide optimum settings of the control parameters. Verify the optimum settingsresult in the predicted reduction in the casting defects.The pouring temperature and pouring time are very important parameters among theparameters affecting the casting quality. Experiments are, therefore, carried out tooptimize the pouring temperature and pouring time by experiments for different typesof casting. The data collected for one year from one of leading casting manufacture inMaharashtra. These data are related to the casting of crankcase. The Optimizedpouring temperature for crankcase is used for reduction of rejection level is as shown00in fig. 6. Rejection level is minimum for range of 1420 C – 1440 C.The pouring time can also be adjusted in same manner by DoE. The pouring time isoptimized for the Cast iron (FG 200) plate stiffener. The data collected from one ofleading casting foundry at Maharashtra (fig. 7). The rejection level for plate stiffener isminimum for pouring time of 5-6 sec.30.0025.00% Rejection20.0015.0010.005.000.002468Pouring Time , SecFigure 6: Pouring temperature v/s % Rejection for Crankcase10
ange of Pouring Temperature 0CFigure 7: Pouring time v/s % Rejection for Plate stiffenerDoE appears to be an important tool to satisfy the condition. In the majority of foundryplants, the data available on the number of castings poured, along with the number ofcastings being considered as accepted or rejected as defectives before and aftermachining, is usually recorded. This data is set under various types of defects foreach day, week and the month of a manufacturing casting product. This informationcan be obtained for each type of component. The statistical data for a selected periodfor any casting can be used as input to the design of experiments (DoE) for defectanalysis. It can be considered as full factorial design of experiments. Further, thisdata will be used to analyze casting defects.2.4 ANNAn artificial neural network is computational model of the human brain, whereinformation processing is distributed over some interconnected processing elements,called nodes (also called neurons). They are structured in some layers. These layersare called as input, output and hidden layers and they have been operated parallel toeach other. The outputs of the node in one layer are transmitted to nodes of otherlayer through connections. While transmitting outputs from one layer to another via
some connections, they may be amplified (if necessary) through weight factors. Thenet input to each node (other than input node) is net sum of the weighted output ofthe nodes feeding that node.Several researchers have attempted to use neural networks in analysis of castingprocess. Kulkarni et al. (1992) developed an expert system that could analyze castingdefects in steel castings. This defect analysis expert system was user friendly andasks a sequence of questions that require a “yes” or “no” answer. Eventually, theexpert system would draw a conclusion stating the nature of defect. It then lists allpossible causes and remedies for the defect. During the interrogation process, if theprogram reaches a dead-
So far, casting defect analysis has been carried out using techniques like cause-effect diagrams, design of experiments, if-then rules (expert systems), and artificial neural networks. Most of the previous work is focused on finding process-related causes for individual defects, and optimizing the parameter values to reduce the defects. This is not sufficient for completely eliminating the .