Transcription
Michigan TechFinancial OverviewA review from the University SenateDecember 2018
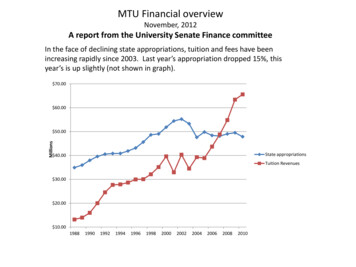
Michigan Tech Financial OverviewFacing the decline of state appropriations, tuition and feeshave increased dramatically since 2003.Driving factors for this increase: historical trends in compensation and benefits overall instructional costs overhead support functions building and long-term debt research expenditures
Michigan Tech Financial OverviewStateappropriationsNet Tuition& Fees*Net tuition and fee revenues were readjusted starting in FY2013 in the audited financialstatements. (e.g. FY2012 adjusted from 71M to 77M with the difference in auxiliaries.)
Undergraduate Tuition HistoryFull time in-state undergraduate tuition at Michigan 016-20172017-2018 12,615 13,095 13,470 14,040 14,286 14,664 15,074(Fact book)(Fact book)(Fact book)(Fact book)(Fact book)(Fact book)(Fact book)Average annual net price to undergraduate students, 2016-2017*Includes financial aid, discounting, etc.Midwestern Public UniversitiesMichigan TechUniversity of Michigan – AnnArborMichigan StateWestern MichiganNorthern MichiganUniversity of WisconsinUniversity of Illinois –Urbana - ChampaignUniversity of Minnesota – Twin CitiesUniversity of Minnesota – Duluth 17,139 16,408 16,684 15,219 14,005 15,910 16,638 16,808 16,381* Full-time beginning undergraduate students who paid the in-state or in-district tuition rate and were awarded grantor scholarship aid from federal, state or local governments, or the institution.Source: National Center for Education Statistics
Non-resident Graduate Tuition RatesSource - Financial aid officeCurrent Graduate tuition 20,574 2 semestersUndergraduate in-state 2017-2018Undergraduate out-of-state 2017-2018 15,074 2 semesters 33,426 2 semestersresident or non-residentRaising non-resident graduate tuition to peer average 1400/credit yields approximately 2M/year.GraduateSchool 1078GraduateSchoolUniversity of WisconsinUniversity of Michigan 2800Georgia Tech 1440Wayne StateMichigan State 1725 2140Virginia TechMinnesota -Duluth 1490 1440Western Michigan 1232 2200Texas A&M –CollegeStationUniversity of Illinois 1040University of Minnesota– Twin CitiesPurdue 2039Louisiana TechMichigan TechNon-resident cost percredit* (AY18)* Masters in engineering where applicable.Non-resident cost percredit (2018) 1410 1680 650ǂ per quarter basis
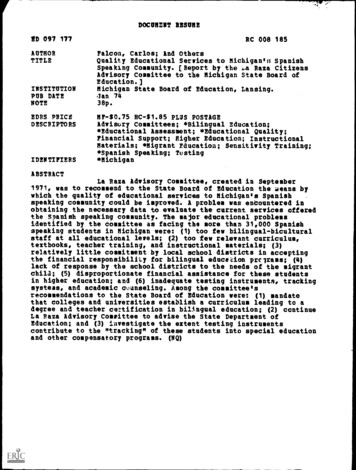
Employee/Faculty costs drive tuition increasesMichigan Tech’s retirement obligations MPSERS ( 10 percent of payroll) obligation Is about 70-75% of TIAA-CREF. Even with more plan participants, there is about a 10% combined decrease since2009. Source: audited financial statements2009 MPSER obligation 4.87 million 2009 TIAA-CREF/Fidelity2010 MPSER obligation 4.67 million 2010 TIAA-CREF/Fidelity2011 MPSER obligation 5.14 million 2011 TIAA-CREF/Fidelity2012 MPSER obligation 5.76 million 2012 TIAA-CREF/Fidelity2013 MPSER obligation 5.72 million 2013 TIAA-CREF/Fidelity2014 MPSER obligation 5.34 million 2014 TIAA-CREF/Fidelity2015 MPSER obligation 3.39 million* 2015 TIAA-CREF/Fidelity2016 MPSER obligation 3.43 million 2016 TIAA-CREF/Fidelity2017 MPSER obligation 4.87 million 2017 TIAA-CREF/Fidelity 7.92 million 7.17 million 5.96 million 6.15 million 5.56 million 5.74 million 6.00 million 6.35 million 6.63 million*On September 30, 2015, the University received 11,784,204 from the MichiganState plan for a plan error requiring excess contributions. The refund reduced theplan’s net position and will impact the University’s net pension liability as of June30, 2016.
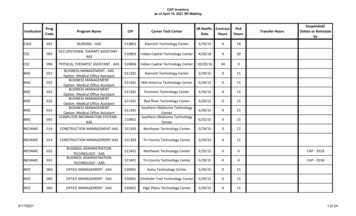
Medical Benefit Claimspaid by Michigan Tech since 2008Since 2012 there has been an actual 5% decrease (15% decrease CPI adjusted) ,even though the non-student employee headcount is up by 12% since 2008.All of the actual increase in healthcare costs have been paid by those covered.(FY basis- audited financial statements, net of employee 7Actual 13,875,743 13,980,633 14,310,670 14,748,919 15,735,827 14,377,991 12,498,807 14,475,538 13,333,124 14,691,242In 2008 13,875,743 14,339,530 14,302,470 14,503,570 15,034,420 13,521,240 11,571,370 13,413,780 12,188,150 13,101,000
Total Employee Benefit Costs to Michigan Techhave been flat for 10 yearsThe total is down 3% (CPI adjusted) since 2008, even though the non-studentemployee headcount is up by 12.5% over same ayments for benefits 35,802,819 35,859,251 34,709,950 35,124,359 37,803,478 36,133,364 34,132,400 36,256,688 36,428,782 38,852,584
Average Total Compensation and Benefitsper instructorIncreased 13% (actual dollars) since FY2006 (-10% CPI adjusted), due tosmall raises, benefit cuts, and lower cost structure (more junior faculty, lecturers, etc.)Current fund expenditures are up 72% (50% CPI adjusted) over the same period.Sources: audited financial statements, controller’s office & compendiumFYInstructionalCompensation 0162017 38,559,398 39,975,030 43,292,487 46,729,720 47,987,133 47,812,865 47,866,389 50,538,540 52,005,389 53,234,128 52,619,134 54,888,744General FundInstructionalExpendituresUnrestrictedcurrent fundexpenditures 44,317,174 45,879,482 49,316,020 53,425,533 54,767,561 54,713,867 55,128,119 57,426,523 58,577,540 59,629,464 59,030,724 62,395,040 140,827,244 151,679,361 166,313,946 179,326,092 187,242,616 191,434,074 198,550,847 199,634,657 208,232,321 216,148,343 223,413,537 242,473,404Tenure/Tenuretrack 348336339341337111048555758565657656870
Average Faculty SalariesMichigan and Regional UniversitiesOklahoma State Faculty Salary Survey and AAUP Faculty Salary Survey (2017-2018) in 1000’sInstitutionProfessorAssoc.ProfessorAsst. ProfessorMichigan Tech119 (4th)*97.4 (3rd)*80.8 (3rd)*U. of Michigan170.211395.6Michigan State154.6101.982.6Wayne State132.597.685.8U. of Wisconsin136.2102.189.5Ohio State150101.389.4Colorado School of Mines1329482Missouri Univ. of S & T125.883.176.6U. of Minnesota143.4100.589.0U. of Illinois150.5104.295.5Purdue142.4101.289.7National Engineering avg.15310586Midwest Engineering avg.16411193* National quintile
How about institutional costs?Bonded DebtTotal debt increased an order of magnitude under the last 2011201220132014201520162017 11,396,000 17,198,000 51,023,286 50,274,702 49,517,956 51,131,794 50,904,532 56,112,688 73,113,673 82,496,244 84,516,392 85,711,936 81,818,215 82,754,664 105,056,919 101,887,771*(Audited financial statements) This is a chiefly a result of bonded debt that hasbeen issued since 2002. Bond debt outstanding asof June 30, 2017 was 101.9 M. Last year MTU spent around 7.5 M in bondeddebt service; a portion of which may beassociated with revenue lines (e.g. residencehalls).* Principal only - 154M with interest included.Debt service over the above period is 60M for combined total debt outlays of 200M.
Costs of expanding and maintaining our physical plant(If you build it, they will come?)Increase of nearly 1 million sq. ft. over last 3 decades (@ 7/sq ft per year maintenance).Approximately 100 sq. ft. added per every person (students, staff, faculty) on campus.M&MDowRoszaLittle HuskiesForestry ExpansionLakeshore CenterMineral MuseumRehki buildingOpie LibraryHillside PlaceATDCGreat Lakes Research CenterBlizzard buildingAlternative Energy CenterKRC, Engineering Design CenterMiscellaneous (Chemistry, etc.)Total additional 00054,00075,00027,50049,50055,0004,00011,00017,600 910,000 square feet
Controlling Support CostsAcademic support*Academic support has grown from 10.7M in FY2006 to 23.1 M in FY2017.It includes:(1) Library operations,(2) Academic IT,(3) CTLF,(4) Marketing and Communications,(5) Corporate Relations and Intellectual Property,(6) Research Services,(7) The Graduate School,(8) Learning Centers.
Controlling Support CostsInstitutional support *Institutional support includes:(1) executive-level activities for management andlong-range planning of the entire institution, i.e.governing board, planning and programming, andlegal services;(2) fiscal operations, including the investment office;(3) administrative data processing;(4) space management;(5) employee personnel and records;(6) logistical activities that provide procurement,storerooms, safety, security, printing, andtransportation services to the institution;(7) support services to faculty and staff that are notoperated as auxiliary enterprises; and(8) activities concerned with community andalumni relations, including development andfund raising.FYInstitutional Support2007 20,858,7272008 24,364,2922009 28,393,0212010 27,429,4682011 29,045,6902012 32,570,6342013 16,022,5462014 17,450,4502015 19,350,7792016 20,377,4792017 25,583,897***In FY2013 there was a re-categorizing of overhead expenditures (e.g.- as academic support,student services, or operations instead of institutional support). Some support functions(e.g. library, IT) are more closely aligned with MTU’s core academic mission than others.**Academic Institutional support Operations were up over 8.3M from FY16 to FY17.
Can Research Dollars Help MTU’s Finances?CPI adjusted external research expenditures are essentially flat since 2008Table of internal and external research expenditures per FY (source: compendium & NSF)FY (NSF niversity (total) M University (internal) M 568.5330.2269.6130.872.5432.08University external M(CPI adjusted- 2008 )University (external) M nternal research expenditures are up 450% since 2002, now 45% of 937.28Internal research expenditures include: REF, IRAD, general fund salaries charged to research, start-up funds,cost share, Graduate Assistant Cost Share (GACS), Indirect costs (Facilities & Administrative F&A) on cost shareand waivers of indirects (F&A) on sponsor funds, research related gifts, use charges & SURF Fellowships.
Increasing Endowmentto the Level of our PeersThis table shows the list of universities thatCarnegie has picked as our peer institutions.This list ranks us third from the bottom intotal endowment (**).If one divides Endowment by Enrollment,only fourteen of 38 (37%) have lowerendowment/student values (*).There is obviously substantial room forgrowth (improvement) in InstitutionalEndowment.
HLC Composite Financial Index (CFI)The Higher Learning Commission (HLC) accredits degree grantingcolleges and universities. A CFI of 1.1 or higher adequate financialhealth and no HLC review. A CFI below 1.1 possible HLC review.Accreditation criteria include whether “resources are sufficient to fulfill itsmission, and respond to future challenges and opportunities”. An annualComposite Financial Index (CFI) is calculated annually to evaluate thesufficiency of institutional resources.Combination of 4 financial ratios, each weighted as follows:· Primary Reserve Ratio (35%) – Net assets/operating and non-operatingexpenses.· Viability Ratio (35%) – Net assets/Long term debt.· Return on Net Assets Ratio (20%) – Change in net assets/total assets.· Net Operating Revenues Ratio (10%) – Net operating income(loss)/total revenues.
Higher Learning CommissionMTU Composite Financial IndexFY17FY2016FY2015FY2014Primary reserve ratio0.430.380.380.40Viability ratio1.10.910.871.11Return on Net assetsratio1.63%1.34%0.38%2.41%Net operating posite financialindex
Conclusions - ExpensesThe aim of this analysis is to identify factors driving undergraduate tuitionincreases over the past 13 years based on an objective analysis of revenuesand expenditures. To limit tuition increases1. control of spending2. increased non-tuition revenuesSenate recommendations:1.Compensation and Benefits: We must stay competitive in our industry. Talent attractstalent. Total Compensation report summary “the importance of retirement programs,health and wellness benefits, family leave, childcare, and tuition reimbursementprograms should be recognized as ways of creating more attractive compensationpackages, while at the same time strengthening the University community. It shouldbe viewed holistically, with an aim to minimize the overall impact of rising costswhere possible while maximizing other benefits .”2.Long-term debt: Building come at big cost. The“If you build it they will come” is anincomplete solution. We need a more comprehensive, proactive plan to limitadditional long term debt while immediately driving revenue at project completion.
Conclusions - ExpensesSenate recommendations continued :3. Overhead spending: The support budgets (academic, instructional, and operations)have seen the largest increases ( 8M from FY16 to FY17 alone). The trend ofincreasing spending on overhead functions rather than revenue generation functions(e.g. teaching & research) must change.A. Implement system that creates financial rewards for revenue generation activitiesB. Increase the return of efforts of advancement units4. Truly strategic investments: Commit to invest only in valued and innovative educationalinitiatives, not just new courses, minors, or degrees.A. Seriously evaluate financials for new programs and reassess finances of programsadded over the past 10 years. Adding degrees for less than 10 new studentsdoesn’t help the big picture.B. Increase collaborative efforts with industry, non-profit, government partners increating educational initiatives focusing on current/future market needs.
Conclusion - Revenues1.Tuition revenues: The majority of revenue increases over the past 10 years have comefrom students in the form of tuition, fees, room & board, etc. ,consider more strategicoptions:A. Market price elasticity by program is uncertain & non-STEM degrees are underpressure.I. Create separate upper and lower division tuition.II. Set tuition by program & demand.III. Downsides include state restrictions on tuition increases and decreased goodwill.B. Increase student numbers (setting hard enrollment targets and meeting them).I. Student recruitment (add sought-after programs, effective branding/marketing)II. Improved retention.III. Enhance partnerships, 2 2 programs, work-for-credit, industry-driven programsIV. Satellite campuses to bring MTU to larger numbers of students including:a) Southeastern Michigan, Midland/Saginaw, and Traverse City areasb) The Fox valley area of Wisconsin, which has no similar engineeringprograms.V. Use summer semester more effectively and reward departments thatparticipate.D. Discounting is currently high, consider adjusting discounting to peer and regionallevels.E. Invest in on-line teaching resources and marketing, determine appropriate pricepoints, and create a reward structure for faculty willing to make the extra effort.
Conclusion - Revenues2. Charge market prices for graduate education: The current nonresident graduate tuition structure is based upon a model fromnearly 20 years ago, and a better price-point model is needed.A. Review graduate school tuition. Increasing graduate tuition toan average market price could net an additional 1-2M/year.3. Increase external research dollars: Over the past 10 years externalresearch expenditures are flat (CPI adjusted).A. Challenge:I.Most of the increase in total research expenditures is due tochanges in the accounting system to find more “internal”research expenditures.II.The number of research active tenure/tenure track faculty is flatover that period, and several top researchers have left ormoved into administrative roles.
Conclusion - RevenueB. Efforts needed to improve acquisition of external research dollars mustinclude:I. Hiring more research-active faculty (not just instructors) withsufficient resources to acquire large grants, develop center, andincrease external research dollars.II. Further enhance the center approach to research, especially viaregional partnerships and solicitation of development funds fromthe state.III. Break down academic silos and encourage collaborative Ph. D.programs initiatives similar to the Physical Therapy Ph. D.
Conclusions - Revenue4. Growing the endowment: The earlier comparison table shows we lagsignificantly behind our peers in endowment, a resource all universities areincreasingly dependent upon.A. Initiation of a major fundraising campaign in the near future is criticallyimportant, especially for funding new capital projects and enhancingboth undergraduate and graduate scholarships.B. Increasing the involvement of the academic departments in fundraisingcould enhance the reach of the advancement team and help in thediscovery of new prospects.5. State appropriations:These are just now approaching the state appropriation levels of 20 years ago. Anappeal to our legislature for a "one-time" bump in its investment in STEMeducation might be considered a long-shot, but is worth a try with newadministrations both in Lansing and at MTU. This might not only be in the form ofcapital requests, but also or research center development or matching funds forresearch and equipment. MSU and U. ofM. have been very successful at this game. Further enhancing Michigan Tech’svisibility/presence in Lansing and Washington is more important than ever withthe state‘s economy in recovery.
University of Michigan - Ann Arbor: 16,408. Michigan State: 16,684. Western Michigan: 15,219. Northern Michigan: 14,005. University of Wisconsin: 15,910. University of Illinois -Urbana - Champaign: . 2016 TIAA-CREF/Fidelity 6.35 million 2017 TIAA-CREF/Fidelity 6.63million *On September 30, 2015, the University received 11,784,204 .