Transcription
Retail Technology Sector UpdateH O U L I H A N L O K E Y T E C H N O L O G Y, M E D I A & T E L E C O M ( T M T ) G R O U PQ4 2020 UPDATE
Houlihan Lokey is the trusted advisor to more top decision-makersthan any other independent global investment bank. 1,500 Employees 1 Billion of Revenue 23 Offices Globally 5 Billion Market Cap2020 TMT Investment Bank of the YearCorporate FinanceFinancial Restructuring2020 M&A Advisory RankingsAll U.S. Transactions2020 Global Distressed Debt & BankruptcyRestructuring RankingsAdvisorDeals106Houlihan Lokey956PJT Partners Inc632JP Morgan8763Lazard503Duff & Phelps8021264Rothschild & Co464Morgan Stanley5991235Moelis & Co395BofA Securities Inc542DealsHoulihan Lokey2101Houlihan Lokey2Goldman Sachs & Co17223JP Morgan1324Evercore Partners5Morgan StanleyNo. 1 U.S. M&A AdvisorTop 5 Global M&A AdvisorLeading Capital MarketsAdvisor2001 to 2020 Global M&A FairnessAdvisory Rankings1Advisor1Source: Refinitiv (formerly known as Thomson Reuters)Financial and ValuationAdvisoryAdvisorDealsSource: Refinitiv (formerly known as Thomson Reuters)No. 1 Global RestructuringAdvisor1,400 TransactionsCompleted Valued at MoreThan 3.0 Trillion CollectivelyRefinitiv (formerly known as Thomson Reuters). Announcedor completed transactions.No. 1 Global M&A FairnessOpinion Advisor Over the Past20 Years1,000 Annual ValuationEngagementsTechnology, Media, andTelecom2018 to 2020 M&A Advisory RankingsU.S. Technology, Media, Entertainment &Telecom Transactions Under 5 Billion *AdvisorDeals1Houlihan Lokey1332Goldman Sachs & Co1233Raymond James Financial Inc1103Morgan Stanley1105JP Morgan108Source: Refinitiv (formerly known as Thomson Reuters)43 Completed Transactions in2020* Includes acquired firm transactions.2
Dedicated Team for All Aspects of Commerce Technology100 Years and 350 Billion of Combined TMT Industry Knowledge and Transaction ExperienceBobby WolfeDirector, TMTMiamiRob LouvGlobal Co-Head,Managing Director, TMTMiamiMark BradtDirector, TMTSan FranciscoErin DuffySenior Vice President,TMTSan FranciscoDan DresnerVice President, TMTBostonEnd-to-End Sector CoverageBusiness Intelligence and AnalyticsFulfilment SolutionsMaster Data ManagementCommerce PlatformIn-Store/Retail TechnologiesOnline Management/MarketplacesContent Management and DevelopmentInventory ManagementOrder Management SystemsCustomer EngagementLogistics/Supply Chain ManagementPersonalization/RecommendationCustomer ExperienceMarketing SoftwarePoint-of-Sale SolutionsProduct Information ManagementProduct Lifecycle Management3
Relevant Transaction Experience and Domain Expertisea portfolio company ofa portfolio company ofhas been acquired byhas been acquired byhas confirmed a “pre-packaged”has completedChapter11 Plana offinancingReorganizationconsisting ofhas received a significant growthinvestment fromhas been acquired byhas been acquired by 24,000,000Series DConvertible Preferred Stocka portfolio of companies owned byhas been acquired byFinancial AdvisorFinancial AdvisorSellside AdvisorSellside Advisorhas acquiredWilliams-Sonoma, Inc.RefinancingFirst Lien SteeringPlacement AgentCommittee AdvisorSellside Advisor 24,000,000Series DConvertible Preferred StockSellside Advisorhas received an equity investmentfromhas received an equity investmentfromhas been acquired byhas completed a financingconsisting ofFirst Lien Term LoanSecond Lien Term Loanhas been acquired byhas been acquired bya portfolio company ofSenior Secured Credit Facility 75,000,000Acquisition FinancingSellside AdvisorExclusive Placement Agent 33,000,000Series E Preferred Stock and Term LoanLed by:PlacementSellside AdvisorAgenthas been acquired byFinancial AdvisorSellside AdvisorFinancial AdvisorSeries E Convertible Preferred Stockhas been acquired byLed by:has been acquired byWith participation from:has been acquired byWith participation from existinginvestors:Apex Venture Partners, SSMPartners, Origin Ventures, RiverCities Capital Funds, and I2A Fund 30,000,000Placement AgentSellside AdvisorTombstones included herein represent transactions closed from 2014 forward.Sellside AdvisorSellside AdvisorPlacement AgentSellside Advisor4
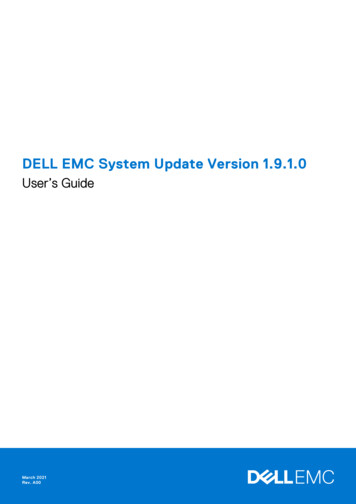
Retail Tech Outpaced the Market Despite Impact From COVID-19EV/NTM Revenue by IndexS&P 500Share Price Performance: Weighted by Market CapS&P 500 RetailingNASDAQRetail TechS&P 500S&P 500 RetailingNASDAQRetail ec-20Valuation Is Closely Tied to Revenue Growth(1)(40%)Jan-20Mar-20Jun-20Sep-20Dec-20Rule of 40: Premium on Growth 10%18.2x4.4x6.2x8.7x 20%(2)Retail Tech0-10%20.5x15.6x11.9x4.6x7.7x8.3x 40% 40%4.5x3.6x10-20%EV/2020E RevenueEV/2021E Revenue23.9x10-20%(3)SaaS 20% 40%Retail Tech(2)Source: S&P Capital IQ. Data as of 12/31/2020.1) Ranges shown indicate median through top-quartile EV/2021E revenue.2) Retail technology index comprises Amazon, Oracle, SAP, Adobe, Salesforce, PayPal, eBay, Square, Shopify, GoDaddy, Zebra Technologies, Wix, Yelp, SPS Commerce, Yext,Quotient Technology, BigCommerce, and ChannelAdvisor.3) SaaS index comprises a sample set of 39 publicly traded SaaS companies. 40%(3)SaaS5
A Robust M&A Market for Retail Tech Announced12/18/2020AcquirerTargetFinServ AcquisitionCorp.EV ( M)EV/RevenueTarget Description 994.010.8x12/3/2020 264.0NA12/1/2020 430.010.8x11/11/2020NANAProvides EDI software and SaaS for managing and processing transactions forbusinesses.10/30/2020 950.0NAProvides an online service that enables consumers to order meals for home delivery.11/5/2020 334.08.9xProvides web- and mobile-based POS payment acceptance and transaction processingSaaS, as well as related hardware, for retailers and restaurants.10/29/2020 450.0NAProvides a white-label mobile payments application for 0 575.08.7xProvides AI-enabled workforce management and business intelligence SaaS for retail,food service, hospitality, and banking sectors.6/30/2020NANAProvides online merchandising SaaS for brands and retailers. Software enablesconsumer awareness of online and in-store availability of goods.6/29/2020 500.0NAProvides subscription-based mirrored home fitness display systems for consumers.2/3/2020 9,948.82.9xProvides fixed, wireless and mobile point-of-sale (POS) retail systems, and relatedtransaction processing software for retailers and businesses globally.Sources: Company filings, S&P Capital IQ, Wall Street Research.Provides e-commerce POS purchase options for nonprime U.S. consumers.Provides buy-now-pay-later services in Canada.Provides restaurant POS systems and workforce and marketing management SaaS.Provides POS systems and online ordering and guest management SaaS forrestaurants.6
As Well As Significant Investment ActivityDateLead InvestorTargetTarget DescriptionRaise ( M)12/21/2020Developer of a checkout experience platform designed to drive revenue for e-commerce businesses. 75.012/7/2020Developer of a cloud-based logistics software designed to make shipping simple.22.011/19/2020Develops an automated fraud detection platform for e-commerce.125.010/27/2020Developer of an online ordering management platform designed to help restaurants manage onlineorders and other management operations.120.010/22/2020Provider of marketing services intended to transform the customer buying experience by bringingmarketing to e-commerce through the transaction moment.80.010/21/2020Developer of a visual search technology designed to transform the way people search and shop forfashion online.40.010/19/2020Operator of an AI technology company automating the world’s stores for retailers and brands.15.09/28/2020Tech-enabled 3PL that fulfills e-commerce orders for direct-to-consumer brands.68.09/24/2020Provides a mobile messaging platform for brands and organizations.230.09/23/2020Develops a commerce experience management platform.155.09/22/2020Developer of a marketplace platform designed to plug directly into an e-commerce tech ecosystem.300.09/9/2020Developer of an instant quoting platform intended to offer a marketplace for custom manufacturing.75.08/4/2020Provider of an e-commerce platform service designed to enable the transition from a brick-andmortar business model to e-commerce.83.07/16/2020Developer of retail customer experience platform with a focus on perfecting checkout.50.05/26/2020Developer of enterprise-focused augmented reality and mobile computer vision applications.80.04/21/2020Developer of enterprise e-commerce SaaS analytics platform.20.02/25/2020Provider of end-to-end cloud-commerce, payments, and marketing solutions.50.01/28/2020Provides a mobile messaging platform for brands and organizations.70.0Sources: Company filings, S&P Capital IQ, Wall Street Research.7
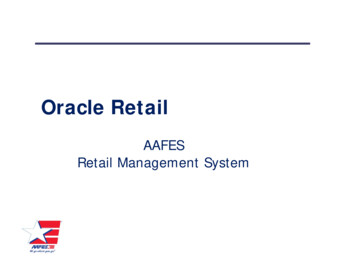
Commerce Technologies Are in DemandCommerce technology companies continue to outperform the rest of the market, while M&A activity accelerated in 2H 2020 as playerslooked to expand product offerings and capture market share.Customer Experience Management vs. Retail Tech vs. S&P IndexS&P 500CEMRetail TechRecent M&A ce: S&P Capital IQ.Note: Customer experience management (CEM) includes 8x8, Adobe, Five9, LivePerson, NICE, Pegasystems, Zendesk, Microsoft, SAP, Oracle, Salesforce, OpenText, Twilio, Medallia,eGain, Verint Systems, and SurveyMonkey; Retail Tech includes Amazon, Adobe, Salesforce, PayPal, Oracle, SAP, Shopify, Square, eBay, Zebra, GoDaddy, Wix, BigCommerce, SPSCommerce, Yext, Yelp, Quotient, and Channel Advisor.8
PriceSpiderClient Profilehas received a significant growthinvestment fromFinancial AdvisorFounded in 2004 and based in Irvine, California, PriceSpider is a leading retail analytics platform thatserves hundreds of brands across a broad base of consumer verticals such as electronics andappliances, computers and office products, health and beauty, home furnishings, food, games, toys,sporting goods, and others. The company’s SaaS platform gives brand manufacturers a unified view ofconsumer purchasing behavior throughout the online retail journey. PriceSpider’s real-time data connectsthe dots between brands, retailers, and shoppers providing brand manufacturers visibility into theirdistribution channels and rich consumer conversion intelligence. With actionable insights and practicalrecommendations, the company helps brands optimize the consumer’s path to purchase to increasesales.Our RoleHoulihan Lokey served as the exclusive financial advisor to PriceSpider and assisted in initiating,structuring, and negotiating the transaction on its behalf.Transaction SnapshotHoulihan Lokey worked closely with the PriceSpider management team to optimally position thecompany, manage deal execution, and maximize the speed and surety of closing a successfultransaction. Over the course of the process, the Houlihan Lokey team maximized value by generatingsignificant interest in the company, engaging in targeted negotiations, and streamlining diligence so thatthe management team and staff remained focused on operating and growing the business. Given therobust process led by Houlihan Lokey as well as PriceSpider’s momentum, superior product suite, andexperienced management team, the transaction yielded a highly successful outcome for the companyand its shareholders.9
Appendix
Trading MetricsRetail TechnologyEV/Revenue( in ceSPS CommerceYelpYextQuotientChannelAdvisorStock Price .98High 22.32% of 52-Week Cash and %98.8%90.3%78.3%39.5%97.3%87.1%75.2%85.7%71.6%Top QuartileMeanMedianEquityEnterpriseValueCY 2020ACY 2021EEV/EBITDAInvMkt Cap 87671,03621918760720922372 2857463 4.64.610.524.510.12.14.51.72.7CY 11.93.71.62.6CY 42.116.6NM20.012.0CY 7.011.4NM12.211.3CY 1.09.7NM11.710.0 7,9729,8692,431 181,883168,48527,565 g Automation( in tYextBrightcoveSharpSpring% of 52-Week Cash and STStock Price 52-Week High 500.1264.69222.53125.88396.4415.7218.4016.28 .2%97.7%78.2%79.3%94.3%75.2%95.0%88.3%Top QuartileMeanMedianInvEquityEnterpriseMkt CapValueEV/RevenueCY 2020ACY 2021EEV/EBITDACY 2022ECY 2020ACY 2021ECY 2022E 5,99238,6109,49213,8121,2512093728 239,917190,450203,714112,16618,1921,922732205 8.8NM 10,5728,6793,622 193,76695,91265,179 338.6x26.531.631.7x22.628.328.0x20.123.8Source: S&P Capital IQ.Notes: Stock price last updated 12/31/2020. NM if EV/EBITDA multiple is greater than 50 or EBITDA is negative or EBITDA margin is negative.11
Trading Metrics (cont.)CEEMEV/Revenue( in millions)% of 52-Week Cash and ioNICEZendeskOpenTextNuanceFive9PegasystemsVerint SystemsMedalliaLivePerson8x8SurveyMonkeyeGainStock Price 52-Week High 4644.09174.40133.2667.1833.2262.2334.4725.5511.81 .1%92.8%94.6%99.4%82.6%90.8%96.5%97.4%56.6%Top QuartileMeanMedianInvEquityMkt CapEnterpriseValueCY 2020ACY 2021EEV/EBITDACY 2022ECY 2020ACY 2021ECY 2022E 0446563165465414922454 ,634365 46.7NA 5,25411,404813 129,917145,86812,440 67.533.9x25.027.228.3x22.321.628.0x23.223.8Source: S&P Capital IQ.Notes: Stock price last updated 12/31/2020. NM if EV/EBITDA multiple is greater than 50 or EBITDA is negative or EBITDA margin is negative.12
Operating MetricsRetail TechnologyRevenue( in merceSPS CommerceYelpYextQuotientChannelAdvisorStock Price .98Top QuartileMeanMedianMkt CapEBITDARevenue GrowthEnterpriseValueCY 2020ACY 2021ECY 2022ECY 2020ACY 2021ECY 2022EEBITDA Margin2019–2020–2021–2020E2021E2022ECY 2020A CY 2021E CY 2022E 2857463 3842409 1424,3933,308976148310868352427143 ,9194,8293,6691,262176357974408493150 ,7875,1104,0541,5872133971,060493542160 99(27)85122(19)4234 88169(25)97178(7)6936 %0.8%13.3%25.5% 181,883168,48527,565 191,325171,94530,648 19,03230,0813,851 22,84834,9884,307 26,87440,4865,134 6,1696,195654 7,2447,262822 25.5%Marketing AutomationRevenue( in tYextBrightcoveSharpSpringStock Price 500.1264.69222.53125.88396.4415.7218.4016.28Top QuartileMeanMedianEquityEnterpriseMkt CapValueCY 2020ACY 2021EEBITDACY 2022ECY 2020A 239,917190,450203,714112,16618,1921,922732205 238,633223,458200,445167,08417,7951,843720204 12,80839,38921,10773,91186835219329 15,19140,56925,42074,7181,06140821335 17,35541,33830,04775,8161,30149323639 6,17719,4336,34415,177102(19)18(3) 193,76695,91265,179 206,198106,27392,440 25,67718,5826,838 29,20719,7028,126 32,87020,8289,328 8,5525,9043,140CY 2021ERevenue GrowthCY 2022E 7,53220,2957,08719,036127(7)22(1) 10,4086,7613,607Source: S&P Capital IQ.Notes: Stock price last updated 12/31/2020. NM if EV/EBITDA multiple is greater than 50 or EBITDA is negative or EBITDA margin is negative. 8,52620,7248,42418,694171425(0) 11,0687,0714,297EBITDA Margin2019–2020–2021–2020A2021E2022ECY 2020A CY 2021E CY 2%24.7%13
Operating Metrics (cont.)CEEMRevenue( in ystemsVerint SystemsMedalliaLivePerson8x8SurveyMonkeyeGainStock Price op QuartileMeanMedianMkt CapEBITDARevenue GrowthEnterpriseValueCY 2020ACY 2021ECY 2022ECY 2020ACY 2021ECY 2022EEBITDA Margin2019–2020–2021–2020A2021E2022ECY 2020A CY 2021E CY 2022E ,634365 ,726315 51,3994221,0341,28047436450537575 71,3804991,2121,34755444858545181 5135891,4451,45265855268654496 323530(12)419 48434119545 %NM28.7%13.4%NM17.7%
Placement Agent has been acquired by SellsideAdvisor has been acquired by SellsideAdvisor has been acquired by SellsideAdvisor 33,000,000 Series E Preferred Stock and Term Loan Led by: With participation from: Placement Agent t rom or t rom a of or y or f 0 D ck Agent y or y er ty g Agent