Transcription
Determining Optimum Operating Room UtilizationDonald C. Tyler,MD, MBA*,Caroline A. Pasquariello,MD*,and Chun-Hung Chen,PhD†*Department of Anesthesiology and Critical Care Medicine, The Children’s Hospital of Philadelphia, Philadelphia,Pennsylvania; and †Department of Systems Engineering & Operations Research, George Mason University,Fairfax, VirginiaEconomic considerations suggest that it is desirable tokeep operating rooms fully used when staffed, but theoptimum utilization of an operating room (OR) is notknown. We created a simulation of an OR to define optimum utilization. We set operational goals of havingcases start within 15 min of the scheduled time and ofhaving the cases end no more than 15 min past theExtensive operating room (OR) utilization is a goalof OR directors and hospital administrators. Unfortunately, the optimum level of utilization isnot well defined, nor is it clear what tradeoffs arerequired to achieve optimum utilization. We sought toidentify those factors that influence optimum utilization. The purpose of this article is to use a simple ORsimulation to enumerate the important factors thatmust be considered in determining optimumutilization.The classic definition of OR utilization is the sum ofthe time it takes to perform each surgical procedure(including preparation of the patient in the OR, anesthesia induction, and emergence) plus the total turnover time, divided by the time available (1,2). As anexample, if the average “patient in to patient out” timefor a herniorrhaphy is 45 min and the average turnover time is 15 min, then 10 herniorrhaphy cases canbe performed in a 10-h period in that OR, for an ORutilization of 100%. With this definition, if cases extend beyond the scheduled end of the day, the timeused after the scheduled end of the day is counted asutilization, even though the hospital may be payingovertime to provide the staffing.Strum et al. (1) defined the concepts “overutilization” and “underutilization.” Underutilization is defined as time during the scheduled hours of operationAccepted for publication November 19, 2002.Address correspondence to Donald C. Tyler, MD, MBA, Department of Anesthesiology and Critical Care Medicine, Children’s Hospital of Philadelphia, 34th St. and Civic Center Blvd., Philadelphia,PA 19104. Address e-mail to Tyler@email.chop.edu. Reprints willnot be available from the authors.DOI: 10.1213/01.ANE.0000050561.41552.A61114Anesth Analg 2003;96:1114–21scheduled end of the day. Within these goals, a utilization of 85% to 90% is the highest that can be achievedwithout delay or running late. Increasing the variabilityof case duration decreases the utilization that can beachieved within these targets.(Anesth Analg 2003;96:1114 –21)that is not used, and overutilization is defined as thetime used by scheduled cases past the end of thescheduled time. With these concepts we can estimatethe economic efficiency of an OR suite, as described inMethods.The standard definition produces the actual utilization—the time that is actually used. Because it is necessary to know the actual case times to perform thecalculation, utilization can never be known in advance. In this analysis, we also refer to the scheduledutilization, that is, the predicted utilization obtainedwhen cases are scheduled.To define what happens when utilization becomesexcessive, consider one OR that is currently scheduledwith inadequate utilization. We are asked to scheduleadditional cases, even if “overbooking” is necessary.As additional cases are added, a point is reached atwhich the expected case times go beyond the scheduled end of the day, thereby exceeding the allowedutilization. To schedule more cases, either the schedule can be allowed to extend beyond the end of theday, or the expected duration of each case can bearbitrarily shortened and more cases squeezed into theallotted time. Although these manipulations may result in maximum scheduled and actual utilization, theschedule may run late, and some cases may start laterthan scheduled. The ability to increase utilization,therefore, appears to be limited ultimately by the degree to which the schedule is allowed to extend beyond the end of day and by the delay that patients areasked to assume.Other factors may also affect utilization. One is caseduration. It is easy to see that shorter cases are easierto fit into a schedule than longer cases, because the 2003 by the International Anesthesia Research Society0003-2999/03
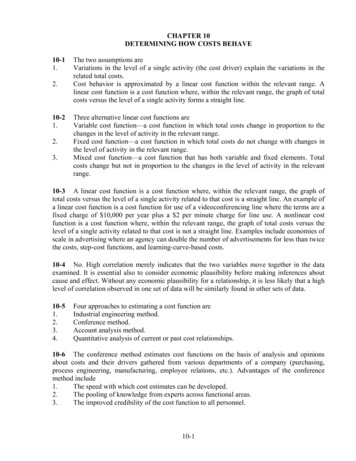
ANESTH ANALG2003;96:1114 –21ECONOMICS, EDUCATION, AND HEALTH SYSTEMS RESEARCHTYLER ET AL.OR UTILIZATIONremaining time available for scheduling may not accommodate a longer case. If 1 h remains unbookedand a 2-h case needs to be scheduled, either the casemust be allowed to run over by 1 h or the 1 h is leftempty. Dexter et al. (3,4) have discussed strategies toensure maximum scheduled utilization.Variability of case duration also makes it difficult topredict actual utilization. Even for straightforward,common operations, actual case time is uncertain.Each patient is different, and the actual time for agiven operation cannot be predicted. This fact meansthat in a series of cases that are scheduled to follow,the actual start time of cases after the first case cannotbe determined in advance.To examine how factors such as case duration andthe variability of case duration affect actual OR utilization, we created a computer simulation of a simpleOR. Within this simulation, operational goals can bedefined and the effect of case variables examined. Toappeal to surgeons and patients, the OR has to run ontime, and to keep costs down, it has to be efficient,with maximum utilization and few overtime salarycosts. Thus, we defined the goals of this simulated ORto be that cases should start within 15 min of thescheduled start time and that the last case shouldfinish within 15 min of the scheduled end of the day.MethodsWe started with the simplest situation: one OR performing the same procedure repeatedly. In developing the simulation, we made several assumptions. TheOR has defined hours of operation, from 7:15 am until5:30 pm, and there are no emergencies. Case durationvaries from case to case and is described as a probability distribution. The scheduled start time of eachcase is limited by patient arrival; therefore, cases cannot start earlier than scheduled.To create the model, we used data from the ORs ofthe Children’s Hospital of Philadelphia. The times forall cases of adenoidectomy with or without tonsillectomy (T&A) for the period January 1 to June 30 1999were collected. A software program (Arena; RockwellAutomation, Milwaukee WI) was used to find a theoretical distribution that could best fit the collectedreal data. More specifically, Arena is able to identify astatistical distribution and its variables so that thesquare error value of the distribution and histogram,which is a measure of the quality of the distribution’smatch to the data, is minimized. The best fitted distribution is a log-normal distribution with a mean caseduration of 48 min and an sd of 15 min. To take intoaccount the size of the sd in relation to the magnitudeof the case times, we used the coefficient of variation,which is defined as the sd of the case time divided bythe mean.1115Using these case times, we created an OR simulation. Cases in the simulated OR were scheduled on thebasis of a mean case time of 48 min with a turnovertime of 20 min; that is, the next case was scheduled tostart 20 min after the previous one finished. Initiallywe studied days with a utilization of approximately50% and determined the start time for each case afterthe first one for the day. We determined “delay” foreach case, which was calculated by subtracting thescheduled start time from the actual start time. Wealso determined “late,” which was determined by subtracting 5:30 pm from the end time of the last case ofthe day if the time was past 5:30. For each situationstudied, cases were assigned to the room, and thesimulation was run 50,000 times to determine meanstart and finish times.After data were obtained with the baseline utilization, another case was added to the schedule, and thesimulation was repeated. Thus, the number of casesperformed for the day was increased to achieve increased utilization. Additional cases were added untilthe scheduled utilization exceeded 100%.To investigate how the variability of case times affects the ability to achieve maximum utilization, additional simulations were run in the same way, exceptthat smaller and larger coefficients of variation of caseduration were used. We also performed an analysis byusing the concepts of overutilization and underutilization. To generate data, we used a simulation basedon an Excel (Microsoft, Redmond, WA) spreadsheet.The simulation was run, and downtime (unused timeduring scheduled hours) and late time (time after theend of the day) were calculated. The inefficiency ofutilization was calculated by using minutes as thequantitative measure of inefficiency. We assumed thatovertime pay is 1.5 times regular pay and that it is 1.5times as expensive to run the OR with overtime. Theinefficiency factor was calculated by adding unusedtime during the day to 1.5 times the time used after theend of the day. The minutes of inefficiency were plotted against actual utilization for cases with differentcoefficients of variation.To examine the effect of our assumption that casescannot start early because patients have not arrived,we allowed cases to start up to 30 min early andrepeated the simulation. To simplify data presentationin this exercise, we determined the number of 48 15 min cases that could be performed without exceeding the goals of a 15-min delay and 15 min late.We then examined the effect of turnover time. Simulations were run with turnover times of 0, 10, and30 min, and the results were compared with thosewith a turnover time of 20 min. We also simulated arandomly selected turnover time of 20 10 min.Our hospital recently opened an ambulatory surgery center (ASU), staffed only by attending physicians. We created a simulation that demonstrated the
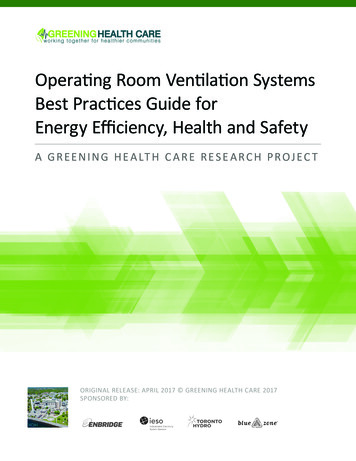
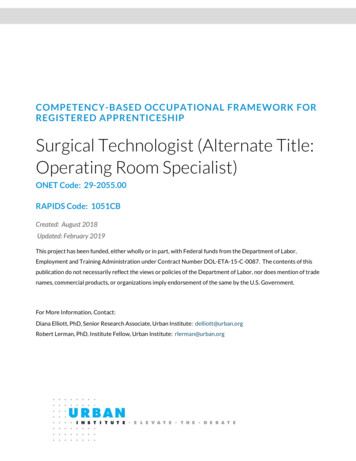
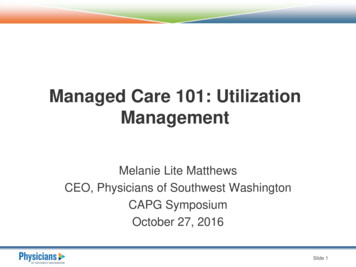
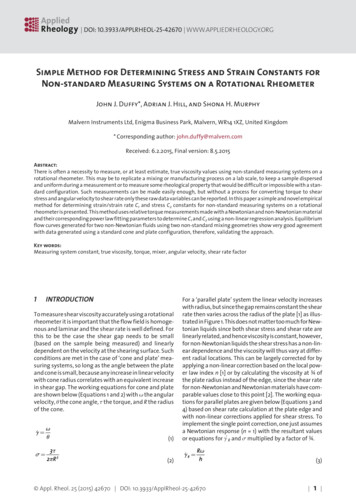
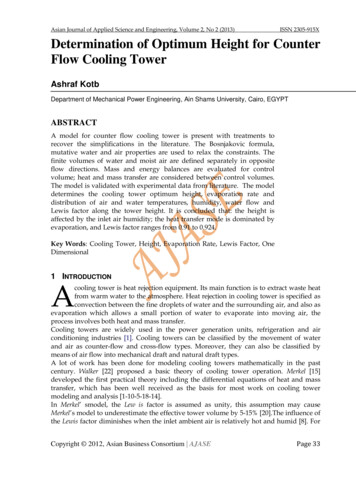
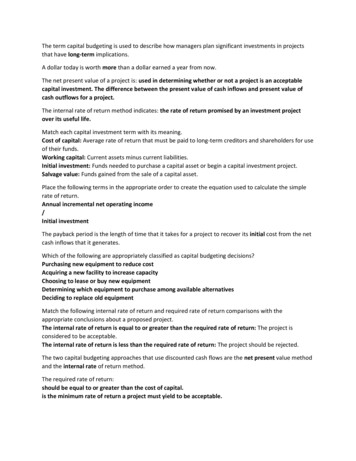
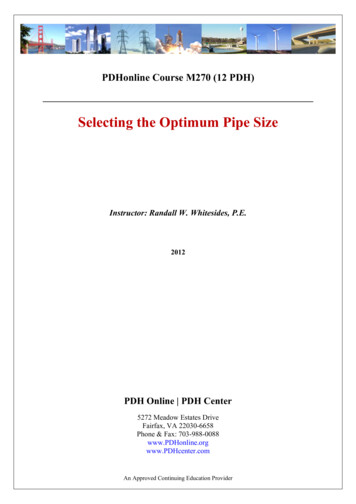
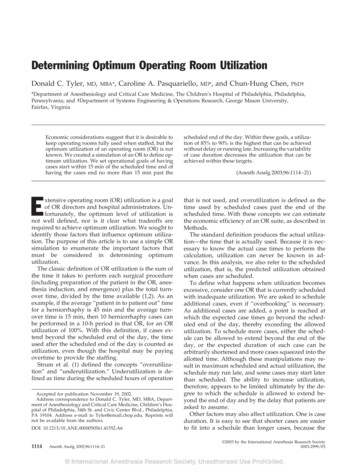
1116ECONOMICS, EDUCATION, AND HEALTH SYSTEMS RESEARCHOR UTILIZATIONTYLER ET AL.ANESTH ANALG2003;96:1114 –21Figure 1. Distribution of case timesfor adenoidectomy and adenoidectomy with tonsillectomy.effect of moving to a different venue healthy patientswith procedures performed by experienced practitioners. With these patients moved to the ASU, the mainOR was left with sicker patients whose procedureswere performed by the same practitioners but with theaddition of residents and fellows. For all simulations,we created an OR that performed five cases of myringotomy and tubes (BMT) and five cases of T&A, witha scheduled utilization of approximately 90%. For thebaseline situation, the mean and sd of the case times ofthe total group of cases were used. We then used themean and sd of case times from the ASU and from themain OR without the ASU patients for the additionalsimulations. Scheduling was based on mean casetimes for the procedures lumped together. In eachsimulation, we measured delay, late time, and overand underutilization.To evaluate a more complex situation, we simulatedan OR performing four cases of varying length,namely, 1, 2, 3, and 3 h. Turnover time was 20 min. Foreach case, we used a coefficient of variation equal tothat of our original data, namely, 0.31, thus resultingin a moderate degree of variability of case times. Thesimulation was run with a scheduled utilization of100%, performing the shorter cases first. To vary utilization, we eliminated first the 1-h case, then the 2-hcase, for scheduled utilizations of approximately 87%and 77%. Simulations were run in each of these levelsof utilization. We also performed the simulation for allfour cases, performing the longer cases first.ResultsThere were 1162 cases with a duration of 48 15 (sd)min. The coefficient of variation was 0.31. The bestfitted distribution was a log-normal distribution (Fig.1). When utilization increased more than approximately 90%–95%, both late minutes and delay increased beyond the target of 15 min (Fig. 2).Figure 3 shows the effect of changing the coefficientof variation, that is, increasing or decreasing the variability of case duration, on late minutes and on average delay. Decreasing the coefficient of variation(smaller sd of case duration) allows increased utilization without exceeding the target for late minutes (Fig.3A). Increasing the variability of case duration, however, decreases the utilization possible within the target for late minutes. A smaller variability of durationallows increased utilization, whereas increased variability allows less utilization within the target for patient delay (Fig. 3B). Efficiency increases as the coefficient of variation decreases, and overall the OR is mostefficient with a utilization between 85% and 95% (Fig.4).When cases were allowed to start up to 30 minbefore their scheduled start time, the effect was toincrease the utilization possible while staying withinthe guidelines for late times and delay of cases (datanot shown). The change was enough that nine casesinstead of eight could be performed in a day withoutviolating the targets for late and delay minutes.As turnover time changes, there is a difference inthe number of cases that can be performed within theguidelines for late and delay minutes. With a 10-minturnover, nine cases could be performed; with a 20min turnover, eight cases could be performed; andwith a 30-min turnover, only seven cases could beperformed (Table 1). When turnover was randomlychosen from a distribution of 20 10 min, seven casescould be performed; this was limited by the degree towhich patient start time was delayed.For the simulation of the effects of opening theASUs, the case time for BMT for the combined group
ANESTH ANALG2003;96:1114 –21ECONOMICS, EDUCATION, AND HEALTH SYSTEMS RESEARCHTYLER ET AL.OR UTILIZATION1117Figure 2. Late and delaytimes with increasingutilization.was 15.4 11.6 min, and for T&A it was 43.8 12.3 min. After the ASUs opened, BMT time was 19.0 15.9 min and 12.7 5.6 min at the main hospital andthe ASU, respectively, whereas the times for T&Awere 48.3 14.6 min and 40.7 11.1 min, respectively. Before the ASU patients were removed fromthe schedule, the main hospital was able to performfive BMTs and five T&As with a utilization of 89%within the guidelines for late and delay minutes (Table 2). When the ASU patients were removed from theschedule, the main hospital was not able to performthe same number of cases in a day, whereas the ASUwas able to finish within the guidelines.When longer cases were mixed with shorter ones,the maximum utilization that could be achievedwithin the guidelines was approximately 85% (Table3). Performing the shortest cases first resulted in lesspatient delay compared with performing the longerones first.DiscussionThe use of simulation allows for the evaluation ofvarious factors that affect OR utilization without thenecessity of gathering data over a long period of time.In addition, simulation allows for the manipulation ofone factor at a time in a way that would not bepossible in a real-life situation. We started with thesimplest possible situation— one procedure being performed repeatedly in one OR, with a constant, shortmean case duration. Although the real-life situation ismuch more complicated, some conclusions can bedrawn to help define the optimum utilization of anOR.To approach an answer to the question of what isthe optimum utilization of an OR, we need to definecertain operational variables. In this model, we defined goals for average patient delay and an acceptable time past the end of the day. To avoid havingpatients arrive early and wait a long time, we definedan average patient wait of 15 minutes as the goal. Wealso wanted to avoid using overtime, so we definedthe goal of finishing the schedule within 15 minutes ofthe scheduled end of the day. With these criteria, inthe simple situation described, optimum utilizationwas approximately 90%. Increased utilization resultedin increased patient delay and overtime beyond ourdefined limits.If case times could be predicted accurately, it wouldbe relatively easy to schedule an OR, but the actualcase duration is not known in advance. The variabilityof case times, as measured by the coefficient of variation, is thus a major factor to be considered if onewishes to achieve maximum utilization. Decreasingthe variability of case times allows increased utilization to be achieved. As seen in our model, when thevariability increases, the predictable optimum utilization decreases. As the variability of case times increases, it is more difficult to schedule times accurately and more difficult to achieve maximumutilization without making patients wait or having theschedule extend past the end of the day.Because the simulation selects the case durationfrom a probability distribution for each run, the nature
1118ECONOMICS, EDUCATION, AND HEALTH SYSTEMS RESEARCHOR UTILIZATIONTYLER ET AL.ANESTH ANALG2003;96:1114 –21Figure 3. A, Late minutes with different coefficients of variation of case duration. B, Average minutes of delay for individual patients withchanging coefficients of variation of case duration.of the distribution used is important. We used actualtimes from a large number of cases to determine thedistribution. As in previous studies (5,6), the distribution was log normal. This sort of distribution does nothave negative numbers and is skewed toward largervalues, a situation that makes sense for an OR.In most ORs, cases are scheduled on the basis ofmean case times. One might expect the shorter andlonger case times to average out, but this is not thecase. Because patients are assigned an arrival time andare not available before their scheduled start time, if acase finishes early, the subsequent patient may not beavailable, and the case cannot start.We also examined optimum utilization from an economic perspective by evaluating the relative efficiencyof the OR in terms of staffing costs. For this we usedthe concept of overutilization and underutilization described by Strum et al. (1). We concluded that optimum utilization is between 85% and 90%, dependingto a large extent on the variability of case duration.The classic definition of utilization considers the timepast the end of the day the same as time duringscheduled hours. This is undesirable because there is acost to going past the end of the day. Overtime costsmay be incurred, and repeatedly running late is hardon staff morale and may make recruiting and retainingscarce staff more difficult. Using the concept of overutilization and underutilization allows us to put a costto running late and to quantitate the quality of ORscheduling.
ANESTH ANALG2003;96:1114 –21ECONOMICS, EDUCATION, AND HEALTH SYSTEMS RESEARCHTYLER ET AL.OR UTILIZATION1119Figure 4. Efficiency of operatingroom utilization with changing coefficients of variation.Table 1. Effect of Varying Turnover Time on Late Minutes, Delay Minutes, and InefficiencyCasesTurnover iciencyfactor 03030303020 1020 1020 1020 1020 12932131448273170Case length was 48 15 min. Turnover time was as indicated except in the last group, where turnover time was a random number selected from a log-normaldistribution: 20 10 min.We were able to increase the number of short casesthat could be performed within the guidelines by allowing cases to start up to 30 minutes before thescheduled time. We would argue, however, that toensure that patients are available up to 30 mi
A software program (Arena; Rockwell Automation, Milwaukee WI) was used to find a the-oretical distribution that could best fit the collected real data. More specifically, Arena is able to identify a statistical distribution and its variables so that the