Transcription
1Summer 2014/Volume 11, No. 2Table of ContentsBoard of Editors . . . . . . . . . . . . . . . . . . . . . . . . . . . . . . . . . . . . . . . . . . . . . . . . . . . . . . . . . . . . . . . . . . 2Sponsorship . . . . . . . . . . . . . . . . . . . . . . . . . . . . . . . . . . . . . . . . . . . . . . . . . . . . . . . . . . . . . . . . . . . . . . 3Research ArticlesFaculty Mobility and Its Influence on New Jersey High School Proficiency Assessment Scores . . . . . . 4Dana Graziano, EdD and Gerald Babo, EdDThe Advanced Placement Opportunity Gap in Arizona: Access, Participation, and Success . . . . . . . . 20Jesus Cisneros, MS; Jessica Holloway-Libell, MEd; Laura M. Gomez, MA;Kathleen M. Corley, MA; and Jeanne M. Powers, PhDCommentaryEducation Reform As a “Weapon of Mass (Education) Destruction” Versus Artful ResistanceAs a “Weapon of Mass Creation” . . . . . . . . . . . . . . . . . . . . . . . . . . . . . . . . . . . . . . . . . . . . . . . . . . . . . 34Morna McDermott McNulty, PhDMission and Scope, Copyright, Privacy, Ethics, Upcoming Themes,Author Guidelines & Publication Timeline . . . . . . . . . . . . . . . . . . . . . . . . . . . . . . . . . . . . . . . . . . . 45AASA Resources . . . . . . . . . . . . . . . . . . . . . . . . . . . . . . . . . . . . . . . . . . . . . . . . . . . . . . . . . . . . . . . . . 49Vol. 11, No. 2 Summer 2014AASA Journal of Scholarship and Practice
2Board of EditorsAASA Journal of Scholarship and Practice2012-2014EditorChristopher H. Tienken, Seton Hall UniversityAssociate EditorsBarbara Dean, American Association of School AdministratorsMarie Gioiosa, Seton Hall UniversityEditorial Review BoardAlbert T. Azinger, Illinois State UniversitySidney Brown, Auburn University, MontgomeryBrad Colwell, Bowling Green UniversitySandra Chistolini, Universita degli Studi Roma Tre, RomeMichael Cohen, Denver Public SchoolsBetty Cox, University of Tennessee, MartinTheodore B. Creighton, Virginia Polytechnic Institute and State UniversityGene Davis, Idaho State University, EmeritusJohn Decman, University of Houston, Clear LakeDavid Dunaway, University of North Carolina, CharlotteDaniel Gutmore, Seton Hall UniversityGregory Hauser, Roosevelt University, ChicagoJane Irons, Lamar UniversityThomas Jandris, Concordia University, ChicagoZach Kelehear, University of South CarolinaTheodore J. Kowalski, University of DaytonNelson Maylone, Eastern Michigan UniversityRobert S. McCord, University of Nevada, Las VegasSue Mutchler, Texas Women's UniversityMargaret Orr, Bank Street CollegeDavid J. Parks, Virginia Polytechnic Institute and State UniversityGeorge E. Pawlas, University of Central FloridaDereck H. Rhoads, Beaufort County School DistrictPaul M. Terry, University of South FloridaThomas C. Valesky, Florida Gulf Coast UniversityPublished by theAmerican Association of School Administrators1615 Duke StreetAlexandria, VA 22314Available at www.aasa.org/jsp.aspxISSN 1931-6569Vol. 11, No. 2 Summer 2014AASA Journal of Scholarship and Practice
3SponsorshipThe AASA Journal of Scholarship and Practice would like to thank the American Association ofSchool Administrators, in particular the AASA Leadership Development Office, for its ongoingsponsorship of the Journal.We also would like to offer special thanks to Seton Hall University, in particular the College ofEducation and Human Services.We appreciate this unique relationship between research and practice, recognizing the mutual benefitto those educators who conduct the research and seek out evidence-based practice and those educatorswhose responsibility it is to carry out the mission of school districts in the education of children.Without the support of AASA and Seton Hall University, the AASA Journal of Scholarship andPractice would not be possible.Vol. 11, No. 2 Summer 2014AASA Journal of Scholarship and Practice
4Research ArticleFaculty Mobility and Its Influence on New Jersey High SchoolProficiency Assessment ScoresDana Graziano, EdDPlainfield Public SchoolsPlainfield, NJGerard Babo, EdDAssistant ProfessorDepartment of Education Leadership, Management, and PolicySeton Hall UniversitySouth Orange, NJAbstractThis paper presents results from an examination of the relationships between high school (HS) facultymobility and 2009-2010 New Jersey High School Proficiency Assessment (HSPA) Math and LanguageArts Literacy test results. Variables found to have an influence on standardized test scores in the extantliterature were evaluated and reported. Hierarchical regression models were used to determine thestrength of the predictive influence of these variables, specifically faculty mobility, on both HS Mathand Language Arts Literacy student performance. Mixed results indicated that faculty mobility doesnot have a significant influence on HS LAL achievement but it does significantly contribute to theexplained variance in HS Math achievement. Implications for practicing administrators are discussed.Key Wordsfaculty mobility, high school student performance, working conditionsVol. 11, No. 2 Summer 2014AASA Journal of Scholarship and Practice
5IntroductionProblemThere are many reasons for the mobility ofA report from The National Commission onTeaching and America’s Future (2011) reportedthat about 33% of the country’s new teachersleave teaching sometime during their first threeyears on the job, asserting that teaching hasbecome “a revolving door occupation” (Terry& Kristonis, 2008, p. 3). Nationwide, 46% ofteachers quit before their fifth year (NationalCommission on Teaching and America’sFuture, 2011).faculty. Teachers cite a lack of support andpoor working conditions as the primary factors(Alliance for Excellent Education, 2005) forleaving a school or the profession. In a poll of40,000 teachers regarding their job satisfaction,the majority agreed that supportive leadership,time for collaboration, access to high qualitycurriculum and resources, clean and safebuildings, and relevant professionaldevelopment were more important than highersalaries (Smollin, 2011).General reasons for faculty mobility inhigh poverty schools include family or personalreasons, retirement, lack of administrativesupport, or pursuit of another job (Ingersoll,2000). However, for mathematics (and science)teachers, the most cited reason for leaving theirjobs is inadequate administrative support(Sterling, 2004; Haberman & Richards, 1990;The Alliance for Excellent Education, 2005; theUnited States Department of Education, 2001;Ingersoll, 2003; Darling-Hammond & Sykes,2003).In education, the attrition of teachersand other staff members, includingadministrators, counselors, support staff, etc., iscommonly referred to as “faculty mobility.”Ingersoll (2001) reports that faculty mobilityimpacts the school organization regardless ofwhether those departing are moved to a similarjob at another site in the district or leave theoccupation altogether. The conceptual premisefor this study is based upon Ingersoll’sperspective, which views all faculty mobility asequally consequential.According to Terry & Kristonis (2008),the annual mobility rate of beginning teachersis 14%. Although no schools are immune tofaculty mobility, the turnover in high-povertyurban schools is about twice that of lowpoverty schools each year (Johnson et al.,2005). As a result, many urban schools functionwith greater rates of new and inexperiencedteachers (Darling-Hammond, 2003).Guin (2004) found that, in addition tohiring under-qualified and inexperienced staff,faculty mobility renders other consequences forschools and districts such as school instability,budgetary burden, and a decrease in studentachievement. Additionally, a significantnegative correlation exists between studentperformance and faculty mobility.Schools with higher mobility rates hadfewer students meeting standards on statewideassessments in both reading and math (Guin,2004). The New York City Board of Education(1992) investigated teacher mobility and itsrelationship to student performance on thestate’s annual Regents tests and discovered thatVol. 11, No. 2 Summer 2014AASA Journal of Scholarship and Practice
6teacher mobility had a weak but statisticallysignificant relationship to student outcomes.Researchers concur that the quality of astudent’s teacher is an important factor indetermining his or her performance (Alliancefor Excellent Education, 2005; Ingersoll, 2003;Darling-Hammond & Sykes, 2003). Therefore,it is critical for America’s public schools tofocus their efforts on both recruiting andretaining high-quality teachers (Alliance forExcellent Education, 2005; Ingersoll, 2003;Darling-Hammond & Sykes, 2003).The existing literature on the influenceof faculty mobility on results from statewidetests is limited (Boyd, Goldhaber, Lankford, &Wyckoff, 2007; Rivkin, Hanushek, & Kain,2005; Terry & Kritsonis, 2008). We attemptedto provide an in-depth analysis of the relationand possible influence of school, staff, andstudent mutable variables on high schoolstudent achievement with a focus on facultymobility for an appropriate sample ofsecondary schools in the State of New Jersey.PurposeOur purpose for this study was to explain howmuch variance, if any, faculty mobilitycontributes to the aggregate studentperformance of New Jersey high schools,on HSPA Mathematics and Language Arts.We used multiple regression analyses toexamine the school, staff, and student variablesthat potentially influence school-wideperformance on the NJ HSPA Language Artsand Math.MethodologyThe State of New Jersey defines facultymobility as “the rate at which faculty come andgo during the school year” (New JerseyDepartment of Education, 2010, para. 44).New Jersey calculates faculty mobility by usingthe number of faculty who entered or leftemployment in the school after October 15 ofthat academic year divided by the total numberof faculty reported as of that date (New JerseyDepartment of Education, New Jersey SchoolReport Card, 2010). However, New Jersey’sdefinition of faculty mobility is all inclusiveand does not differentiate between teachers,administrators, counselors, or other facultymembers, nor does it differentiate betweenreasons for faculty departure.The sample for the study was selectedpurposefully to represent only New Jersey’spublic, comprehensive, and academicsecondary schools that reported all requiredinformation related to school, staff, and studentvariables to the New Jersey Department ofEducation (NJDOE).Of the 441 public secondary schools inNew Jersey, 336 were included in the sample.Vocational schools, special services schooldistricts/special education schools, jointures,and charter schools were excluded from thestudy to ensure all results obtained from theanalysis could be attributed to a typical districtor regional New Jersey public high school.The association between New JerseySchool Report Card variables, in particularfaculty mobility, and 2009-2010 New JerseyHigh School Proficiency Assessment (HSPA)Math and Language Arts Literacy test scoreswere evaluated and reported in this study.The HSPA is used to determine studentachievement in reading, writing, andmathematics as specified in the New JerseyCore Curriculum Content Standards in Grade11. The NJ HSPA scores are scaled to fit intothe 100-300 range of possible points available,where 200 is Passing/Proficient. The NJDOEmakes results of the state assessments availableVol. 11, No. 2 Summer 2014AASA Journal of Scholarship and Practice
7to the public via online School Report Cards(NJDOE, 2010), which allows for immediatecomparisons of schools and districts.The primary statistical method ofanalysis was multiple regression analyses. Allregression analyses first utilized a“simultaneous” entry method model followedby a series of hierarchical regression modelsinformed by the “simultaneous” outcomes(Witte & Witte, 2007). The block hierarchicalmodel construction allowed the determinationof the amount of change between models aspredictor variables (i.e., staff, school, studentmutable) were entered into the regressionanalysis. Their specific contribution to HSPALAL and Math performance was examinedthereafter. The results reported focus on thoseresults obtained from the hierarchical modelsdeveloped and run in SPSS (see Table 1).Vol. 11, No. 2 Summer 2014AASA Journal of Scholarship and Practice
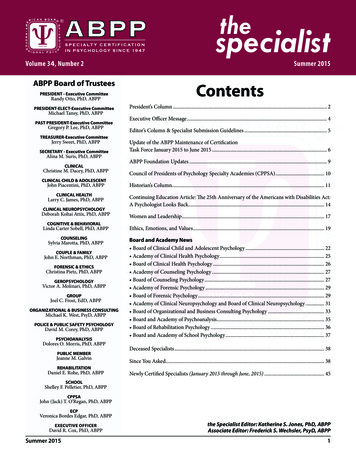
8Table 1Models Analyzed in the StudyHierarchical Regression ModelsLALMODELSStep 1 Student Mobility RateStudent Attendance RateStep 2 Student Mobility RateStudent Attendance RatePercentage of Limited English Proficient Students (LEP)Percentage of Students with Disabilities (SPE)Socioeconomic Status (SES)School SizeStep 3 Student Mobility RateStudent Attendance RatePercentage of Limited English Proficient Students (LEP)Percentage of Students with Disabilities (SPE)Socioeconomic Status (SES)School SizeFaculty MobilityMATHMODELSStep 1 Student Mobility RateStudent Attendance RateStep 2 Student Mobility RateStudent Attendance RatePercentage of Students with Disabilities (SPE)Percentage of Limited English Proficient Students (LEP)School SizeSocioeconomic Status (SES)Step 3 Student Mobility RateStudent Attendance RatePercentage of Students with Disabilities (SPE)Percentage of Limited English Proficient Students (LEP)School SizeSocioeconomic Status (SES)MA Faculty MobilityVol. 11, No. 2 Summer 2014AASA Journal of Scholarship and Practice
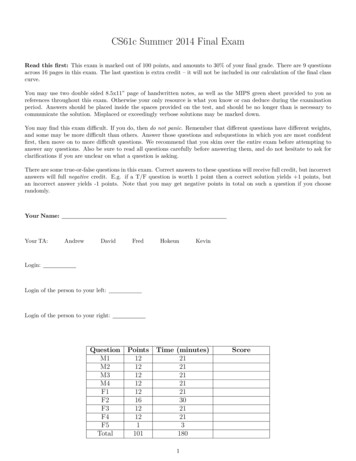
9ResultsThe sample consisted of 336 public secondaryschools in New Jersey that reported all requiredinformation relating to school, staff, andstudent variables to the New Jersey Departmentof Education. The average school size in thesample was approximately 1,150 students. Theaverage percentage of students on free andreduced lunch was 31%. The averagepercentage of Limited English Proficient (LEP)students was 3.7%, while the average ofSpecial Education (SPE) students was 16%.The average student attendance rate was93%, and student mobility approached 9%.The average faculty attendance rate was 95%,and faculty mobility exceeded 4%.Approximately half of all faculty (50%) earneda master’s degree or higher, and 99% weredeemed highly qualified by New Jerseystandards. The mean percentage of studentswho scored Proficient in HSPA LAL acrossNew Jersey was 86%, with a standard deviationof 16%. In Math, the mean percentage ofstudents who scored Proficient across NewJersey was 72%, with a standard deviation of21%. The mean percentage of GeneralEducation students who scored Proficient inHSPA LAL across New Jersey was 92%, witha standard deviation of 15%. In Math, themean of General Education students whoscored Proficient across New Jersey was 79%,with a standard deviation of 21%.As previously mentioned, Table 1displays the variable entry method for eachhierarchical regression model where HSperformance on both the 2009-2010 NJ HSPALAL and Math assessments served as thedependent/outcome variables. The method ofvariable entry was determined by the initialsimultaneous regression models run that werepart of the larger study. It should be mentionedhere that multi-collinearity was checked for allsimultaneous entry model variables. In onlytwo cases was there determined to be an issueat which time those variables were droppedfrom the models. Table 2 displays the resultsfor the hierarchical multiple regression analysisfor New Jersey high school performance resultson the 2009-2010 NJ HSPA Language ArtsLiteracy (LAL) assessment.Vol. 11, No. 2 Summer 2014AASA Journal of Scholarship and Practice
10Table 2Hierarchical Multiple Regression Analysis for NJ HS Performance on the 2009-2010 NJ HSPA LALVariableStep 1StudentAttendanceStudentMobilityStep 2StudentAttendanceStudentMobilityLEPSPESESSchool SizeStep 3StudentAttendanceStudentMobilityLEPSPESESSchool ***-.25***-.11***-.19***-.08**.08**-.05R2.67Adj. R2.67.74.73.74.73*p .05; **p .01; ***p .001When student attendance and studentmobility were entered in Step 1 of theregression, it significantly predicted LALachievement, F (2, 333) 338.41, p .001,adjusted R2 .67, indicating that 67% of thevariance in NJ HSPA LAL school performancecan be explained by the Step 1 model or thesetwo variables, respectively.The negative beta value for studentmobility indicated that schools with a lowerrate of student mobility performed better on the2009-2010 NJ HSPA LAL, accounting for9.6% of the variance in performance. Studentattendance accounted for 35% of the variance,favoring schools with better attendance rates.When student attendance, studentmobility, LEP, SPE, SES, and school size wereentered in Step 2 of the model, the regressionmodel’s predictive power was improved, asevidenced by an R2 change .07, F (4, 329) 20.92, p .001, adjusted R2 .73. Fourvariables, student attendance, student mobility,LEP, and SPE were significant at p .001 andtwo, SES and school size, at p .01. NegativeVol. 11, No. 2 Summer 2014AASA Journal of Scholarship and Practice
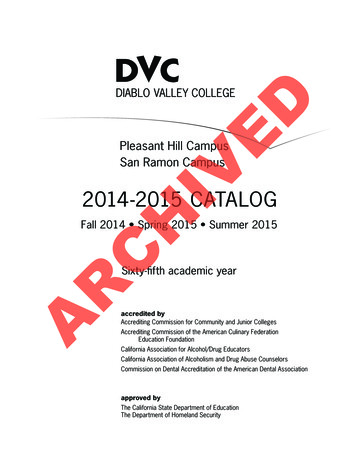
11betas indicated that schools with studentpopulations demonstrating lower studentmobility, fewer LEP and SPE studentpopulations, and a fewer number of students onfree and reduced lunch performed better on the2009-2010 NJ HSPA LAL, whereas larger highschools performed better.The strongest predictor variable in themodel was student attendance, accounting for35% of the variance in school performance onthe NJ HSPA LAL. The second strongestpredictor in the Step 2 model was studentmobility, accounting for 6.3% of the overallmodel.Step 3 of the model included all of theprevious variables entered, with the addition offaculty mobility to determine what amount ofthe variance of school performance on the2009-2010 NJ HSPA LAL, if any, could beexplained by the inclusion of the variable ofinterest. When faculty mobility was includedin the Step 3 model, R2 change .003, F (1,328) 3.53, p .05. The inclusion of facultymobility in Step 3 of the model did notsignificantly improve the overall predictivepower of the final model, F (7, 328) 133.29,p .001, as is evidenced by no change in theadjusted R2 .73.Consequently, both the Step 2 and Step3 models accounted for 73% of the variance inHigh School performance on the 2009-2010 NJHSPA LAL with all variables, except facultymobility, significantly contributing to themodels’ predictive power.The Step 3 model indicates that studentattendance contributed the most explainedvariance to overall HS performance on the2009-2010 NJ HSPA LAL, accounting for35%; student mobility contributed 6.3%; LEP,1.2%; SPE, 3.7%; SES, .7%; and school size,.65%. Faculty mobility was not found to be asignificant predictor variable to HSperformance on the 2009-2010 NJ HSPA LALwhen controlling for student and schoolmutable variables.Table 3 displays the results for thehierarchical multiple regression analysis forNew Jersey high school performance results onthe NJ 2009-2010 HSPA Mathematics (Math)assessment.Vol. 11, No. 2 Summer 2014AASA Journal of Scholarship and Practice
12Table 3Hierarchical Multiple Regression Analysis for NJ HS Performance on the 2009-2010 NJ HSPA MathVariableStep 1StudentAttendanceStudentMobilityStep 2StudentAttendanceStudentMobilityLEPSPESESSchool SizeStep 3StudentAttendanceStudentMobilityLEPSPESESSchool SizeMA -.07*R2.64Adj. R2.64.72.71.73.72*p .05; **p .01; ***p .001When student attendance and studentmobility were entered in Step 1 of theregression, it significantly predicted 2009-2010NJ HSPA Math achievement, F (2, 333) 298.72, p .001, adjusted R2 .64, indicatingthat 64% of the variance in NJ HSPA Math HSschool performance can be explained by theStep 1 mo
Lamar University. Thomas Jandris, Concordia University, Chicago. Zach Kelehear, . We also would like to offer special thanks to Seton Hall University, in particular the College of . EdD . Assistant Professor . Department of Education Leadership, Management, and Policy .