Transcription
Financial Analysis ofWright State UniversityHoward BunsisProfessor of Accounting, Eastern Michigan UniversityFebruary 1, 20181
Roadmap1. Overall financial condition of WSU: A significant decline2. Timing of proposed cuts – these negotiations have no effect onthe ability to stay off of Fiscal Watch3. Administration Response for staying off Fiscal Watch and howcurrent changes already meet the SB 6 benchmark4. Reasons for the declining performance: Examination of tuitionrevenue, enrollment, state SSI, WSU Administration legal issuesand administrative spending, Athletics5. Faculty Salaries Under the Administration Proposal6. Health Care Analysis: Faculty out of pocket costs2
1.Overall Financial Conditionof Wright State University:A Significant Decline3
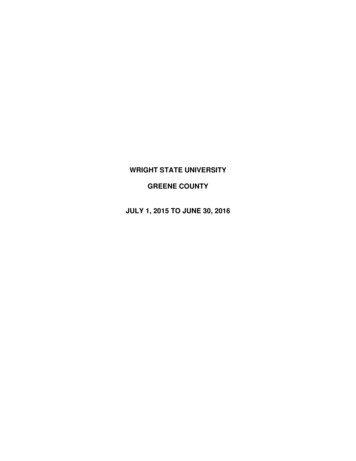
Wright State Balance SheetSource: Audited Financial Statements, Adjusted for GASB 68 (Pensions)Total AssetsTotal Net AssetsTotal Liabilities 600,000,000 500,000,000 400,000,000 300,000,000 200,000,000 100,000,000 02002 2003 2004 2005 2006 2007 2008 2009 2010 2011 2012 2013 2014 2015 2016 20174
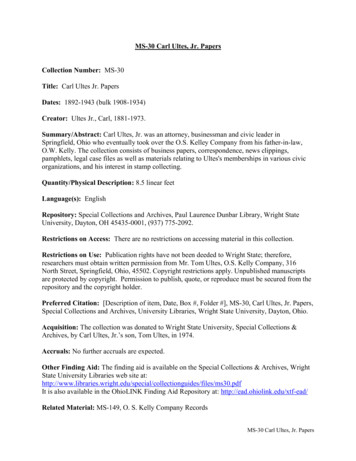
Wright State Revenue Distribution Over TimeSource: Audited Financial Statements200250%39% 39%40%30%27%2012201741%23%26%22%26% 25%20%10% 11% 9%10%0%TuitionStateAppropriationGrants andContractsAll other5
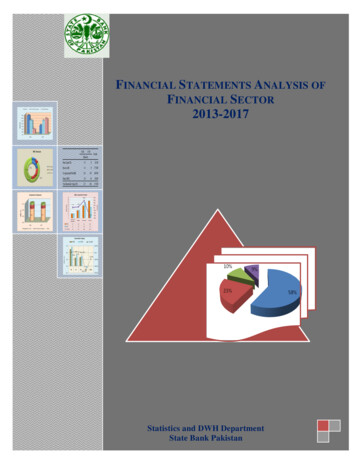
Ratios to Define University PerformanceNumeratorDenominatorSB 6Weight in FormulaF-BViabilityTotal Reserves30.0%22.5%35.0%Primary Reserve50.0%45.0%35.0%20.0%12.5%20.0%Cash FlowTotal ReservesChange in NetAssetsOperating CashFlowsTotal .0%0.0%Net AssetChange in NetAssets Before OtherItemsTotalRevenues0.0%0.0%10.0%RatioNet IncomeCFI6
Ratio ScoresViabilityPrimary ReserveNet IncomeCash FlowNet AssetLowScore of 0 to 1Less than 30%Less than 5%Less than 0%Less than 0%Less than 0%MediumScore of 2 to 330% to 100%5% to 25%0% to 3%0% to 3%0% to 3%HighScore of 4 to 5Over 100%Over 25%Over 3%Over 3%Over 3%7
Ratio Data for Wright State Over time2002 2003 2004 2005 2006 2007 2008 2009 2010 2011 2012 2013 2014 2015 2016 2017Viability RatioPrimary Reserve RatioCash Flow RatioNet Asset Ratio613% 436% 551% 234% 278% 313% 297% 295% 269% 425% 156% 112% 112% 89% 45% 20%31% 33% 35% 40% 41% 38% 32% 27% 29% 39% 36% 34% 32% 23% 10%4%5.2% 5.8% 6.5% 3.3% 5.5% 2.1% 1.3% 3.1% 4.1% 7.7% 0.9% -6.8% -2.5% -3.3% -6.5% -2.5%4.9% 4.0% 3.8% 4.7% 8.9% 4.4% 1.1% -1.0% 3.1% 10.1% -2.5% -2.3% -0.9% -6.0% -9.9% -13.0%Viability ScorePrimary Reserve ScoreCash Flow ScoreNet Asset .441.000.00Fichtenbaum-BunsisComposite ScoreSB 6 Composite 938
Total Reserves Over TimeRestricted ExpendableUnrestricted Net 20062005200420032002 160,000,000 140,000,000 120,000,000 100,000,000 80,000,000 60,000,000 40,000,000 20,000,000 09
Cash Flow Ratio Over .0%-6.0%-8.0%10
Composite Ratio Scores Graphically Over TimeFichtenbaum-Bunsis Composite ScoreSB 6 Composite 0082009201020112012201320142015201620170.0011
WSU SB 6 Score Compared to Other Ohio PublicsSource: Wright StateAverage of 1.000.500.0012
Wright State Bond RatingMoody's Downgrades Wright State University to Baa2 from A2;Outlook Negative: May 2, 2017The downgrade is driven by WSU's severe financial deterioration in a short period of time, with significantoperating deficits in FY 2016 and projected for FY 2017 resulting in substantial reduction in liquidity.Management is implementing a comprehensive expense reduction plan to restore fiscal balance in FY 2018.However, with a relatively inflexible expense base, realizing adequate savings to align with revenues will provechallenging. Should the university not accomplish its expense realignment plan, it will continue to have deficitoperations and potential further draw downs on liquidity, which could trigger additional downward ratingpressure.The Baa2 favorably incorporates WSU's regionally important role as a low-cost public university serving theDayton region, with good scale, solid fundraising, diverse revenue, and a predictable debt structure.It also incorporates the university's relationship with the State of Ohio (Aa1 stable), which hasimplemented enhanced monitoring of the university's financial condition.13
Wright State Moody’s Ratings Over s RatingA2A2A1A1A2Baa2Rank (out of 21)6th highest6th highest5th highest5th highest6th highest9th highestThough there are 21 categories, the lowest 11are referred to as Speculative Grade14
2.These Negotiations WillNot Affect The 2018 SB6Score and Fiscal Watch15
Fiscal Watch Timing and Fact-FindingSource: pdfIn order to stay off of fiscal watch, the SB 6 compositeratio score must be 1.90 for FISCAL 2018, which endson June 30, 2018Fact Finding Hearing EndsFact Finding ReportVotePosting of resultsFeburary 1At least 14 daysAt least 7 days30 days16
Issues in Practice Assuming no delays or unusual issues, the fact-finding process will end towardsthe end of March Even if the draconian health care changes are implemented, the most timethese could affect fiscal 2018 is for one month of the academic year Bargaining unit salaries for 2017-2018 are already set – at 0% Any changes being negotiated in this process will not fully take effect until thefall of 2018, well after the fiscal year ends on June 30, 2018 Bottom line: These negotiations will not affect WSU’s ability or inability toreach the SB 6 benchmark that avoids fiscal watch17
3.Administration Plan toPrevent Fiscal Watch:Simulation Proves theProposed AdministrativeCuts are Too Deep18
SB 6 Simulation: Raw Data to Compute SB 6 RatiosSource: uploads/2017/Nov/meeting/FAI2 FY17%20Financial%20Presentation.pdfTotal RevenuesTotal ExpensesChange in Net Assets2016 Actual 375,171,743 410,143,494( 34,971,751)2017 Actual 365,710,390 392,675,459( 26,965,069)2018 RealisticProjections 348,144,293 345,004,658 3,139,635Expendable Net AssetsPlant Debt 41,703,870 88,747,614 16,907,992 81,865,276 20,047,627 74,982,938 21,956,772 74,982,938Viability RatioPrimary Reserve RatioNet Asset ability ScorePrimary Reserve ScoreNet Asset Score2301101232232.100.801.902.20SB 6 Composite Score2018 WSU AdminProjections 345,891,079 340,842,298 5,048,78019
Revenue Forecasts Behind the SimulationSource: uploads/2018/Jan/meeting/FAI8 017.pdfStep 1: Use WSU Budgetto determine grosstuition revenue change:Step 2: Use WSUBudget to determineother revenue changeper budget:Step 3: Convert Budget toActual Financial StatementBasis (How SB 6 ratios aredetermined): Use 2.5%Decline for other revenueinstead of -3.5%Budgeted Tuition & FeesGross Tuition & Fees(December)Gross Tuition & Fees(earlier forecast)Budgeted RevenueTuition (Gross)Other RevenueTotal RevenueNet TuitionScholarshipsGross TuitionOther RevenueTotal Revenue2017 ActualBudgetReforcast FY18 Change% Change 187,954,000 172,007,000( 15,947,000)-8.5% 187,954,000 173,707,000( 14,247,000)-7.6%Budget2017 Actual Reforcast FY18 Change 187,954,000 172,007,000 ( 15,947,000) 117,993,000 113,850,000 ( 4,143,000) 305,947,000 285,857,000 ( 20,090,000)% Change-8.5%-3.5%-6.6%2018 RealisticProjection 128,455,895 43,324,335 171,780,230 219,688,398 348,144,293% Change-8.5%-8.5%-8.5%-2.5%-4.8%2017 Actual 140,388,956 47,349,000 187,737,956 225,321,434 365,710,390 Change( 11,933,061)( 4,024,665)( 15,957,726)( 5,633,036)( 17,566,097)20
Why -2.5% Is More Realistic than -3.5% for Other Revenue The most important reason is what is forecast to happen with SSI in 2018: SSI is the 2nd largest revenue source, at 26% of total revenue Per the Ohio Board of Higher Education, SSI for Wright State in 2018 isforecast to decline only 0.5% When the administration forecast total revenue in their budget documents,they are only forecasting 84% of the total actual revenues, and it is actualrevenues that are used for SB 6 The administration is forecasting the following declines in large revenue items: 20% decline in gifts, contributions and other revenues 17% decline in grants and contracts 3% decline in sales and service For these reasons, a predicted 2.5% is much more realistic, and even thisdecline is very conservative21
Final Revenue ProjectionsRealisticNet TuitionScholarshipsGross TuitionOther RevenueTotal Revenue2017 Actual 140,388,956 47,349,000 187,737,956 225,321,434 365,710,3902018 Projection 128,455,895 43,324,335 171,780,230 219,688,398 348,144,293 Change( 11,933,061)( 4,024,665)( 15,957,726)( 5,633,036)( 17,566,097)% Change-8.5%-8.5%-8.5%-2.5%-4.8%WSU AdministrtionNet TuitionScholarshipsGross TuitionOther RevenueTotal Revenue2017 Actual 140,388,956 47,349,000 187,737,956 225,321,434 365,710,3902018 Projection 128,455,895 43,324,335 171,780,230 217,435,184 345,891,079 Change( 11,933,061)( 4,024,665)( 15,957,726)( 7,886,250)( 19,819,311)% Change-8.5%-8.5%-8.5%-3.5%-5.4%DifferenceNet TuitionScholarshipsGross TuitionOther RevenueTotal Revenue Change 0 0 0 2,253,214 2,253,21422
Expense ProjectionsTotal Expenses2017 Actual 392,675,459Expense CutExpense Cut Needed to get toSB 6 score of 1.90Expense Cut Proposed byWSU administrationExtra Expense Cuts that areNot Necessary2018 RealisticProjections 345,004,6582018 WSU AdminProjections 340,842,298(47,670,801)(51,833,161)DollarsPercent Cut- 47,670,801-12.14%- 51,833,161-13.20% 4,162,36023
Summary of SB 6 Simulation Using budgeted and actual projections, a total revenue decline of 4.8% is morerealistic than a 5.4% decline. This will lead to a lower revenue decline by 2.2million In order to arrive at an SB 6 composite score of 1.90, given the revenue declineabove, an expense reduction of only 47.7 million is needed. The WSUadministration believes that a 51.8 million reduction is necessary A steep but realistic revenue decline of 4.8% combined with an expense declineof 51.8 million will lead to an SB 6 composite score of 2.20, which is well abovethe 1.90 needed. However, an expense decline of only 47.7 million will still allow WSU to avoidfiscal watch. Therefore, the WSU administration is proposing unnecessary cuts of 4.1million ( 51.8 million less 47.7 million). This difference alone is enough tonegate the need for the health care increases being proposed24
4.Reasons for thedeclining performance:How Did We Get Here?25
Enrollment: Is There Really an Enrollment Crisis?2018 Fall 2017Source: g/files/uploads/data/statistical-profiles/ph rpt 2017 master .0%-5.0%-10.0%-15.0%-20.0%-25.0%Annual Percentage Change in EnrollmentInternational StudentsDomestic StudentsTotal Enrollment2008 to2009Domestic StudentsInternational StudentsTotal Enrollment2009 to2010200716,30860516,9132010 to2011200817,02363917,6622011 to20122012 to2013200918,15463218,7862013 to2014201019,16363019,7932014 to2015201118,81278819,6002015 to20162016 to2017201216,7291,06017,7892017 1,11017,10826
Change in WSU Enrollment from 2015 to 2018Percent Change in Enrollment 2015 to ic StudentsInternational StudentsTotal Enrollment98% of the total international student decline between 2016 and 2017 wasdue to declines in Kuwaiti, Saudi, and Indian student enrollmentSource: WSU BOT presentation, April 7, 201727
Change in WSU Enrollment vs. Other Ohio Public InstitutionsSource: g/files/uploads/data/statistical-profiles/ph rpt 2017 master 0.pdfPercent Change in Enrollment Fall 2012 to Fall 5.2% Peer Average: -6.3% 7 institutions had declineslarger than OhioStmiMiaCincinnati-22.9% -23.1%28
Tuition Revenue vs. the State AppropriationSource: WSU Audited financial statementsTuitionState Appropriation 160,000,000 140,000,000 120,000,000 100,000,000 80,000,000 201220132014201520162017 40,000,00029
Annual Percentage Change in the Total State 0.0%-2.2% 8%-4.4%-1.9%-17.6%2002 2003 2004 2005 2006 2007 2008 2010 2011 2012 2013 2014 2015 2016totototototototototototototo2003 2004 2005 2006 2007 2008 2009 2011 2012 2013 2014 2015 2016 201730
Long-Term Percentage Changes in the State 0%2002 to 20122012 to 201731
Spending on Instructional Salaries and Benefits (all but medical faculty)No Changes in the Last Four YearsInstruction Salaries and Benefits as a % of Total WSU CompensationInstruction Salaries and Benefits as % of Total Education and General ExpensesInstruction Salaries and Benefits as a % of Total WSU 6%19.0%201621.5%19.2%201732
Salaries and Benefits of Bargaining Unit Faculty Only201320142015201620172018SalariesBenefits 47,162,596 48,920,544 51,102,770 53,392,142 54,039,024 50,797,096Total Compensation 59,000,408 62,813,978 64,900,518 67,380,883 68,791,678 64,207,529Benefit ation 11,837,812 13,893,434 13,797,748 13,988,741 14,752,654 13,410,43325.1%28.4%27.0%26.2%27.3%26.4%2013 to20143.7%17.4%2014 to20154.5%-0.7%2015 to20164.5%1.4%2016 to20171.2%5.5%2017 to2018-6.0%-9.1%6.5%3.3%3.8%2.1%-6.7%33
Long Term % Changes in Bargaining Unit CompensationSalaries20%15%BenefitsTotal -4.9%-4.1%-4.7%-10%2013 to 20162016 to 20182013 to 201834
Cash Spent by WSU on Pensions: Decline from 2016 to 2017Source: Audited Financial StatementsOPERSSTRSARPARP OPERSARP STRSTOTAL20132014201520162017 8,534,584 10,064,517 6,384,440 152,637 1,250,936 26,387,114 8,712,371 10,202,409 6,117,266 163,962 1,573,660 26,769,668 9,045,674 10,756,852 6,905,431 184,076 1,693,514 28,585,547 9,034,533 10,739,476 7,501,937 212,870 1,809,017 29,297,833 8,315,454 10,531,111 7,466,023 208,607 1,817,177 28,338,372Totals:2013 to 14 Changes% Changes 382,554 1,815,8791.4%6.8%2014 to 152015 to 16 712,2862.5%2013 to2016 to 172017( 959,461) 1,951,258-3.3%7%35
Administrative Salaries as a % of Education & General SpendingSource: tive%20Productivity%20Measure.pdfOhio StateWright StateYoungstown StateCincinnatiCentral StateKent StateWSUOhio AverageCleveland StateBowling Green28%22%Reduction in Admin spending ifWSU spent the Ohio AverageOhio( 15,896,825)MiamiToledoShawnee StateAkron0%5%10%15%20%25%30%35%40%36
Number of Administrators per Student FTE;Lower Ratio Means More Admins per StudentSource: Ohio Board of EducationNumber of FTE Students per AdministratorOhio StateCentral StateWright StateCincinnatiMiamiBowling GreenKent StateToledoOhioYoungstown StateCleveland StateAkronShawnee State12.41,215Peer Average# of WSU Admins# of WSU Admins if WSU hadaverage ratio# of Excess WSU administrators% of Excess Administrators0246810121416182092029524%2237
Athletics: Direct Revenues and ExpensesSources: USA Today Database and NCAA Management 20132014201520162017Direct Athletic Revenues 1,519,053 1,394,407 1,532,853 1,472,579 1,482,930 1,567,790 2,124,742 1,704,061 1,992,545 2,269,897 2,167,897 2,447,164 2,292,806 2,288,955 2,245,361 2,344,421Athletic Expenses 6,388,184 6,623,679 7,638,381 7,889,692 8,760,851 9,402,842 10,393,436 10,279,886 9,914,670 9,914,670 10,226,716 10,852,077 11,236,512 11,663,355 12,279,662 12,756,674Athletic Deficit( 4,869,131)( 5,229,272)( 6,105,528)( 6,417,113)( 7,277,921)( 7,835,052)( 8,268,694)( 8,575,825)( 7,922,125)( 7,644,773)( 8,058,819)( 8,404,913)( 8,943,706)( 9,374,400)( 10,034,301)( 10,412,253)From 2013 to 2017: Revenues down 4% Expenses up 18%38
Athletic Revenues and Expenses GraphicallyDirect Athletic RevenuesAthletic ExpensesAthletic Deficit 14,000,000 12,000,000 10,000,000 8,000,000 6,000,000 4,000,000 2,000,000 0( 2,000,000)( 4,000,000)( 6,000,000)( 8,000,000)( 10,000,000)( 12,000,000)2002 2003 2004 2005 2006 2007 2008 2009 2010 2011 2012 2013 2014 2015 2016 201739
Subsidy in Dollar and Percentage TermsYearSchool FundsIncome(Deficit)Total AthleticSubsidyAthleticExpenses2002 4,877,263 8,132 4,869,131 6,388,1842003 5,749,098 519,826 5,229,272 6,623,6792004 5,831,043( 274,485) 6,105,528 7,638,3812005 6,251,300( 165,813) 6,417,113 7,889,6922006 7,556,678 278,757 7,277,921 8,760,8512007 6,981,631( 853,421) 7,835,052 9,402,8422008 7,127,079( 1,141,615) 8,268,694 10,393,4362009 7,083,386( 1,492,439) 8,575,825 10,279,8862010 7,410,823( 511,302) 7,922,125 9,914,6702011 7,463,552( 181,221) 7,644,773 9,914,6702012 7,774,722( 284,097) 8,058,819 10,226,7162013 7,726,762( 678,151) 8,404,913 10,852,0772014 8,417,787( 525,919) 8,943,706 11,236,5122015 8,388,880( 985,520) 9,374,400 11,663,3552016 8,622,393( 1,411,908) 10,034,301 12,279,6622017 8,577,655( 1,834,598) 10,412,253 12,756,674% of 80%77%79%77%80%80%82%82%40
Subsidy of Other Ohio InstitutionsCleveland StateWright StateKent StateMiamiAkronYoungstownOhio UBGSUToledoCincyOSUSubsidy in 10,391,350 10,034,301 19,288,226 23,771,560 23,813,277 10,209,516 20,263,483 12,528,362 14,759,749 24,892,123 0Subsidy %86%82%74%71%69%68%64%55%53%42%0%Ohio Average 15,991,76558%41
Subsidy of Other Horizon League InstitutionsNorthern KentuckyCleveland StateIUPUIWright StateWisconsin MilwaukeeOaklandUICYoungstownWisconsin Green BaySubsidy in 11,617,644 10,391,350 7,948,430 10,034,301 10,805,090 12,913,602 14,182,940 10,209,516 5,032,782Subsidy %89%86%84%82%81%81%80%68%56%Horizon League Average 10,387,66978%42
WSU Athletic Revenues and Athletic SubsidyTicket SalesLicensing, Rights, ContributionsAcademic Support 14,000,000 12,000,000 10,000,000 8,000,000 6,000,000 4,000,000 2,000,000 02002 2003 2004 2005 2006 2007 2008 2009 2010 2011 2012 2013 2014 2015 2016 201743
Individual Athletic eSalariesOtherExpensesAthleticStudent AidTotalExpenses 1,202,482 1,287,275 1,474,124 1,388,350 1,248,718 1,623,687 1,911,441 1,910,381 1,803,727 1,863,477 1,940,660 1,959,127 2,044,520 2,065,369 2,320,509 2,616,344 1,197,191 1,238,696 1,362,868 1,469,124 1,621,111 1,804,584 1,843,709 1,944,440 1,990,161 1,798,238 1,921,791 2,026,466 2,195,016 2,275,340 2,429,471 2,395,105 2,284,728 2,267,849 2,790,207 2,864,182 3,580,638 3,426,017 3,946,299 3,742,633 3,322,590 3,636,247 3,722,231 4,248,985 4,298,618 4,446,128 4,446,128 4,792,445 1,703,783 1,829,
Wright State University Howard Bunsis Professor of Accounting, Eastern Michigan University February 1, 2018 1. Roadmap 1. Overall financial condition of WSU: A significant decline 2. Timing of proposed cuts –these negotiations have no effect on the ability to stay off of FiscalWatch 3. Ad