Transcription
Data and Questions of MacroeconomicsKey Macroeconomic Variables National Income Unemployment Inflation Stock market index Interest rates Exchange rates Government budget balance Trade balanceFor each of these questions we want to address the following questions: What would we like these variables to measure? How, in fact, are they measured? How have they performed historically? Why do we care about these data?For now, we will look at just the first three.1
National Income What would we like it to measure?Our standard of living How, in fact, is it measured?Bureau of Economic Analysis is responsible for construction and maintenance of national income and product accounts (NIPA).Measurement began in the 1930s due to frustration of Roosevelt andHoover trying to design policies to combat the Great Depression. SimonKuznets (Nobel laureate) was commissioned to develop initial methodology and estimates. In 1947, the process became much more consistent.Methodologies have frequently been changed (improved?) as a result ofadvances in economics, accounting, and data collection. Past data arethen revised to reflect new definitions.2
There are two main measures of national income:Gross domestic product (GDP) and Gross national product (GNP)GDP is an attempt to measure production in the countryGNP is an attempt to measure income accruing to a country’s residents.Relation of GNP to GDP in the US, 1990GNP 5,465 bnMinus Income earned by citizens from workconducted or capital owned abroad 137.4 bnPlus: Income earned by non-citizens fromwork conducted or capital owned in theU.S. 95.7 bn GDP 5,423 bnNotes:1. Data quality for GDP are better.2. Difference between GDP and GNP is small, 1% for the US. However,the difference can be bigger for other countries, especially small ones.3
The BEA collects data from numerous sources: IRS, surveys, customs, etc. Using these data, there are three ways to construct GDP data:1.The expenditure method.2. Income method.3. Value added method.The expenditure methodGDP consumption investment govt. purchases net exportsNew durable goodsSpending by firms onplant, equipment (fixedinvestment) and building up inventories.Non-durable goodsServicesNote: Fixed investmentdivided intoSpending by householdson:residential and nonresidential.All new housing goes here,whether bought by firms,households or the government.Government spendingon goods and services.Note: Not equal to totalspending, because itdoes not include transferpayments (e.g. welfare).Note that we do NOT include firmspending on materials (including intermediate processed goods sold to itby other firms) or labor. Doing so,would involve double counting, because these expenditures will alsoshow up in consumer spending ongoods that embody these intermediate inputs. exports ofgoods and services minusimports4
The income methodThe method attempts to add up the net income of all employees and business, before taxes.Composition of National Income, 1995, billionsWages and salaries4,209Owner’s income478Rental income122Corporate profits589Net interest earned401National Incomelabor’s share, 73%Profit’s share, 27%5,799These shares are quite stable over time.5
Value added method The value added by a firm is the difference between the revenue a firmearns by selling its products and the amount it pays for the products of otherfirms it uses as intermediate goods. Example: A firms buys 1,000 of wheat, mills and bakes it using 1,000 oflabor. The firm sells the bread for 2,500, making 500 profit. The valueadded is 1,500. The details of how the government calculates these measures of nationalincome are pretty tedious. In theory all three measures should give the same value for GDP. But inpractice they can differ because of methodological complications (e.g. thetreatment of taxes) and problems with data collection (e.g. some activity isnot observed because of tax evasion). This can create difficulties for governments trying to work out the state of the economy, and therefore the sortsof policies they should implement.(online reading: “Statistical Discrepancies in GDP”) The important feature of the measures is that they avoid double counting.Q. If I buy a computer in Pittsburgh for 3,000, and sell it to mycousin in Arkansas for 10,000, what is the contribution to nationalincome?A. 10,000, consisting of 3,000 of computer equipment, and 7,000transportation services.6
Real versus Nominal GDP To add apples to oranges we need a common unit: their value works quitenicely. In practice, the BEA collects data on total revenues for each type of good,surveys the prices of those goods, and then infers the quantities producedfrom these data.price of good BSo GDP is estimated byY p A y A pB yB ,(1)but both quantities are inferredfrom(2)RyA A ,pARyB B .pBquantity of good Brevenues: totalvalue of sales ofgood BNote what equation (1) means for the growth rate of income. Differentiate(1) with respect to time:Y& p& A y A p A y& A p& B y B p B y& B .We can write this as a growth rate:Y& ( p& A y A p A y& A ) ( p& B y B p B y& B ), Yp A y A pB yBx& dxdtDenominator is totalrevenue, RA RB.7
which, in turn, can be written in the following form:Y& R A Y R A RB p& A RB p A R A RB p& B R A p B R A R Bweighted sum of individualprice growth rates, with weightsequal to the share of the good intotal sales.NOMINALGDPGROWTHRATE INFLATION RATE y& A RB y A R A RB y& B yB weighted sum of individualoutput growth rates, withweights equal to the share of thegood in total sales. REAL GDP GROWTHThis is what the BEAobserves So, as we are really interested in real GDP growth, we need to beable to measure accurately the rate of inflation. Problems measuringinflation also imply problems in measuring real national incomegrowth.8
What GDP Does Not Measure Assume for the moment that inflation is measured accurately, and thatrevenues are observed without problem. Then, by assumption, we have an accurate measure of GDP growth . . . . . . . but this is still a poor measure of the standard of living.GDP Omits: The value of leisure time. Non-marketed household production. Environmental damage. Non-economic values: peace, security, happiness, schadenfreude, etc.And on top of this, GDP figures do not measure GDP all that well becausethere are problems in measuring revenues accurately measuring inflation well.So, unsurprisingly, GDP is the best measure of our national standard of living that we have.9
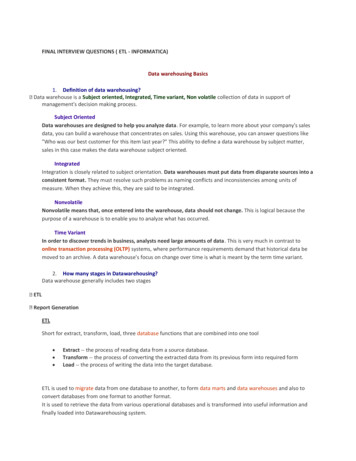
Real Gross Domestic ProductUnited States, 1870-1995Main features of real GDP performance: A more or less constant rate of growth, over a period of 120 years, shownby the exponential trend line. Fluctuations around this trend, notably Recessions: the Great Depression (1930-39); the recessions of1973-75 and 1981-82 associated with the oil-price increases; the1990-91 recession for reasons we will explore later. Booms: periods of rapidly growing or above-trend output, notablein the two world wars, the late 1960s, and the 1990s.10
These features of GDP growth leads to two distinct questions: What determines the long-run average trend rate of growth? What determines the frequency and amplitude of booms and recessions?Economists have almost invariably attacked these two questions separately. Imagine a world with no cycles, so that the trend can be studied. Thisis the study of economic growth. Imagine a world with no trend, so that the cycle can be studied. This isbusiness cycle analysis.11
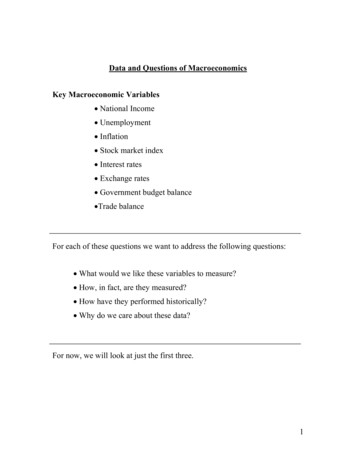
InflationNote absence of periodsof deflation after WWII.12
US Inflation Rate, 1801-200030.0Civil WarNote how periods of price deflationvanished after the war.25.0WWI20.015.0War of 1812Oil 119811991Nixon pricecontrols-10.0Great Depression-15.0-20.0Source: Handbook of Labor Statistics, U.S. Department of Labor, Bureau of Labor Statistics.13
The consumer price index is a weighted sum of the prices of individualgoods. The weights are equal to the relative importance of each good in consumption (the consumption share). The CPI has been under investigation in recent years (Boskin Commission). It has been concluded that, for many years, the CPI has overstated increase in the cost of living. Getting the inflation rate wrong has important consequences:1. We don’t really know what is going on with real income growth:and without reliable data on GDP growth, it is hard to know whatpolicies work and what policies do not.2. We get the adjustment to individual index welfare payments wrong. Because we have been overstating the rise in the cost of living, our measurement problems imply:1. Real GDP growth has been understated.2. The Federal government has been increasing expenditure on welfare andother transfer payments too rapidly, and making recipients better off than weintended at the cost of an increased budget deficit.14
Why the CPI overstates inflationThere are a number of reasons, among them:1. Subsitution BiasThe CPI has traditionally studied the cost of buying a fixed basket of goods.But individuals can offset part of the effect of rising prices by changing thegoods they buy. The CPI is the answer to the question: how much money do I need tobuy exactly what I bought last year? A true cost of living index is the answer to the question: how muchmoney do I need to be exactly as well off as I was last year?These are distinct questions.15
An extreme example of the substitution bias: I am indifferent between chips and Doritos, but I like a bit of variety. I always eat 3 units, and I buy two of the cheaper one and one of the more expensive one.Year20012002ChipsDoritosPrice per unit50100Quantity purchased211005012Price per unitQuantity purchased In 2001, I spent 100 on chips and 100 on Doritos for a total of 200, andbought 3 units in total. In 2002, I spent 100 on chips and 100 on Doritos, for a total of 200, andbought 3 units in total. The CPI asks: how much do I need in 2002 to buy exactly what I bought in2001? The answer is:200 to buy the 2 units of chips I had bought in 2001 but which now cost100 each, PLUS 50 to buy the 1 unit of Doritos I had bought, which nowcost 50.Total expenditure required: 250, which is 25% more than I spent in 2001. Sothe CPI says inflation was 25%. However, given my preferences, I can keep myself exactly as well off asbefore without raising my expenditure at all. The true cost of living saysinflation was 0%.16
2. Quality changeThe CPI does not do a good job of tracking improvements in quality, and introduction of new goods. For example, the best desktop computer today is about 3,000. Thebest desktop in 1988 was 3,000. Are we really claiming that computershave not declined in price? In the computer case, we need to find something measurable that proxies for what we care about. For example, more clock speed allows us todo more things better, so we could use clock speed as a measure forquality. Doing this, we find that the cost of computer services (measuredas cost per instruction per second) has declined at about 9% per year for20 years. Computers are such egregious example of the quality problem that theBEA has actually gone and adjusted its data on computer prices. But it has done so for very few other things: measuring quality is inmost cases very hard and time-consuming to do. Jerry Hausman has studied the “quality improvement” caused bythe proliferation of breakfast cereal brands. He concludes that wehave overstated price inflation in the breakfast cereal sector by about25 a year for over 15 years.17
Data and Questions of Macroeconomics Key Macroeconomic Variables National Income Unemployment Inflation Stock market index Interest rates . advances in economics, accounting, and data collection.