Transcription
Comparison of Newer Intraocular Lens PowerCalculation Methods for Eyes after CornealRefractive SurgeryLi Wang, MD, PhD,1 Maolong Tang, PhD,2 David Huang, MD, PhD,2 Mitchell P. Weikert, MD,1Douglas D. Koch, MD1Purpose: To compare the newer formulae, the optical coherence tomography (OCT)-based intraocular lens(IOL) power formula (OCT formula) and the Barrett True-K formula (True-K), with the methods on the AmericanSociety of Cataract and Refractive Surgery (ASCRS) calculator in eyes with previous myopic LASIK/photorefractive keratectomy (PRK).Design: Prospective case series.Participants: A total of 104 eyes of 80 patients who had previous myopic LASIK/PRK and subsequentcataract surgery and IOL implantation.Methods: By using the actual refraction after cataract surgery as target refraction, predicted IOL power foreach method was calculated. The IOL prediction error (PE) was obtained by subtracting the predicted IOL powerfrom the power of the IOL implanted.Main Outcome Measures: Arithmetic IOL PEs, variances of mean arithmetic IOL PE, median refractive PE,and percent of eyes within 0.5 diopters (D) and 1.0 D of refractive PE.Results: Optical coherence tomography produced smaller variance of IOL PE than did Wang-Koch-Maloney(WKM) and Shammas (P 0.05). With the OCT, True-K No History, WKM, Shammas, Haigis-L, and Average ofthese 5 formulas, the median refractive PEs were 0.35 D, 0.42 D, 0.51 D, 0.48 D, 0.39 D, and 0.35 D, respectively,the percentage of eyes within 0.5 D of refractive PE were 68.3%, 58.7%, 50.0%, 52.9%, 55.8%, and 67.3%,respectively, and the percentage of eyes within 1.0 D of refractive PE were 92.3%, 90.4%, 86.9%, 88.5%, 90.4%,and 94.2%, respectively. The OCT formula had smaller refractive PE compared with the WKM and Shammas, andthe Average approach produced significantly smaller refractive PE than all methods except OCT (all P 0.05).Conclusions: The OCT and True-K No History are promising formulas. The ASCRS IOL calculator has beenupdated to include the OCT and Barrett True K formulas. Trial registration: Intraocular Lens Power Calculation AfterLaser Refractive Surgery Based on Optical Coherence Tomography (OCT IOL); Identifier: NCT00532051;www.ClinicalTrials.gov. Ophthalmology 2015;122:2443-2449 ª 2015 by the American Academy of Ophthalmology.Although corneal refractive surgery produces excellent visual outcomes, it creates difficulties in accurately calculatingintraocular lens (IOL) power.1e3 There are 2 major causesof error in IOL calculations in these eyes: (1) incorrectcorneal refractive power estimation obtained from standardkeratometers or corneal topographers because of incorrectmeasurements of anterior corneal curvature and change inthe effective refractive index of the cornea after LASIK/photorefractive keratectomy (PRK), which is in turn causedby the alteration in the ratio of the anterior to posteriorradius of curvature; and (2) incorrect estimation of effectivelens position (ELP) as calculated by many IOL powercalculation formulas.4,5The internet-based IOL power calculator at the AmericanSociety of Cataract and Refractive Surgery (ASCRS) website (www.ascrs.org) has 3 modules for eyes with priormyopic LASIK or excimer laser PRK, hyperopic LASIK/PRK, or radial keratotomy. Another internet-based IOLpower calculator is the Barrett True-K formula (True-K) andcan be accessed from the Asia-Pacific Association of 2015 by the American Academy of OphthalmologyPublished by Elsevier Inc.Cataract & Refractive Surgeons (www.apacrs.org) andASCRS (www.ascrs.org) websites.Optical coherence tomography (OCT) is a noncontactimaging technology that can measure both anterior andposterior corneal powers with high axial resolution. By using the RTVue (Optovue Inc., Fremont, CA), Tang et al6developed an OCT-based IOL calculation formula. Promising results for the OCT-based IOL formula were reportedby Tang et al6,7 and Huang et al.8The purpose of this study was to compare the newerformulae, the OCT formula, and the True-K formula with themethods on the ASCRS calculator in a large case series ofeyes with previous myopic LASIK/PRK from 2 study centers.MethodsPatientsThis is a study sponsored by the National Eye Institute and isregistered with www.ClinicalTrials.gov (Identifier: 15.08.037ISSN 0161-6420/152443
Ophthalmology Volume 122, Number 12, December 2015This prospective observational study was conducted at 2 academiceye centers (Cullen Eye Institute and Casey Eye Institute). Institutional Review Board approval was obtained for this study, and thestudy adhered to the tenets of the Declaration of Helsinki.Prospectively, we enrolled patients who had previously undergone LASIK or PRK for myopia and underwent cataract surgery from November 2010 to January 2015. Inclusion criteria wereeyes that (1) had no complications during or after the cataractsurgery, (2) had manifest refraction performed at 3 weeks or laterafter the cataract surgery, and (3) had best spectacle-corrected visual acuity of 20/32 or better after cataract surgery.Ocular biometry was measured using the partial coherenceinterferometer (IOLMaster, V.7.5, Carl Zeiss Meditec, Inc., Dublin, CA). The OCT scans were obtained using the RTVue device(Version 6, 8, 0, 27). In addition, corneal curvatures were measuredusing the Atlas (Zeiss, Oberkochen, Germany) and the EyeSys(EyeSys Vision, Houston, TX) devices at 1 center (Baylor Collegeof Medicine, Houston, TX). All cataract surgeries were performedby 2 surgeons (D.H. and D.D.K.) using a temporal clear cornealincision, phacoemulsification, and implantation of IOLs in thecapsular bag. Preoperatively, various methods were used forcorneal power estimation and IOL power calculation. The surgeonselected the IOL power to be implanted depending on hisjudgment.Intraocular Power Calculation MethodsOptical Coherence TomographyeBased Intraocular PowerCalculation Formula. With the use of the RTVue device, 3 OCTscans were performed in each eye. Two scans were used in theOCT formula for IOL power calculation. The OCT formula uses 5preoperative biometric measurements: axial length and anteriorchamber depth (distance from the corneal epithelium to the crystalline lens) from the partial coherence interferometer, and netcorneal power, posterior corneal power, and central cornealthickness from the OCT. On the basis of the anterior and posteriorcorneal powers and the central corneal thickness, net corneal powerwas calculated using the Gaussian thick lens formula. Then, forIOL power calculation, the net corneal power was converted to aneffective corneal power based on linear regression analysis8:effective corneal power in post-myopic LASIK/PRK ¼ 1.0208 net corneal power 1.6622.The OCT IOL formula is based on an optical vergence model ofthe eye, that is, the paraxial approximation of Gaussian optics wasused. The ELP was predicted using a regression-derived formulabased on anterior chamber depth constant, posterior corneal power,and axial length of the eye.8Barrett True-K Formula. The Barrett True-K formula wasdeveloped recently. There are 2 versions of the formula: one isbased on knowing the refractive change induced by the refractivesurgery (“True K”), and the other version relies only on data acquired at the time that the patient presents for cataract surgery (nohistorical data are required) (“True-K No History”). For IOL powercalculation, the Universal II formula is used, which is a modifiedversion of original universal theoretic formula.9,10 Detailsregarding the design of the True-K and Universal II formulas arenot published.American Society of Cataract and Refractive Surgery Calculator. Depending on the use of historical data, the IOL calculatorfor eyes with prior myopic LASIK/PRK categorizes variousmethods into 3 groups: (1) methods using pre-LASIK/PRK keratometry (Ks) and change in manifest refraction (DMR) induced byLASIK/PRK, (2) methods using DMR and corneal measurementsat the time of cataract surgery, and (3) methods using no prior data.Because of reduced accuracy of IOL power prediction withmethods using pre-LASIK/PRK Ks and DMR,11 we did not2444evaluate methods in this group. In this study, 3 methods usingno prior data were evaluated: the Wang-Koch-Maloney (WKM),Shammas,12 and Haigis-L.13 In a subgroup of 28 eyes with DMRdata available, 4 additional methods using DMR were alsoassessed: Adjusted effective refractive power (EffRP),14 AdjustedAtlas 0e3,15 Masket,16 and Modified Masket. Details regardingthese methods were described in a previous study.11Method Using Average Intraocular Lens Power. We alsoevaluated the method of averaging IOL powers predicted usingvarious formulas and compared its performance with the singleformula.Intraocular Lens Prediction ErrorThe manifest refraction after cataract surgery was obtained at themost recent examination (range, 3 weeks to 3 months). By usingthe optimized lens constant in normal eyes for each surgeon andtargeting the actual refraction after cataract surgery, the predictedIOL power for each formula was calculated. Then, the IOL prediction error (PE) was obtained by subtracting the predicted IOLpower from the power of the IOL implanted. Thus, a positive valueindicates that method predicts an IOL of lower power than thepower of the implanted IOL; this would leave the patient hyperopic. Mean arithmetic IOL PE was calculated. Variance of themean arithmetic IOL PE was assessed. A smaller variance indicatesbetter consistency of the IOL prediction with that method; byadjusting to correct for the mean IOL PE, a better refractiveoutcome might be expected.Refractive Prediction ErrorBy using the assumption that 1 diopter (D) of IOL PE produces 0.7D of refractive error at spectacle plane,17 the refractive PE wascalculated on the basis of the IOL PE with each formula for eacheye. Before calculating the refractive PE, the mean IOL PE maybe compensated by adjusting the systemic error to zero oroptimizing the lens constant for each IOL type. In this study, wedid not adjust the mean IOL PE to zero for 2 reasons: (1) Themagnitude of mean numeric IOL PE was small ( 0.67 D),equivalent to a refractive PE of 0.5 D; and (2) these datarepresent the normal clinical scenario in which surgeonsroutinely use their lens constants in patients with normal cataractand do not have specific optimized lens constants for eyes afterLASIK/PRK.The median absolute refractive PE was calculated. The percentage of eyes within refractive PE of 0.50 D (IOL PE 0.71D), 1.00 D (IOL PE 1.43 D), and 2.00 D (IOL PE 2.86 D)was computed for each method.Statistical AnalysisFor sample size, we want to detect a difference of one third of thestandard deviation of differences between 2 groups. With a significance level of 5% and a test power of 80%, 88 eyes are requiredin each group. In this study, we enrolled 104 eyes.To assess if the mean arithmetic IOL PEs produced by variousmethods were significantly different from zero, 1-sample t test orWilcoxon 1-sample signed-rank test was used depending on thedata distribution. The variances of mean arithmetic IOL PEs weretested using the F-test for variances to assess the consistency of theprediction performance by different methods. Nonparametricmethod Wilcoxon test was used to compare the absolute refractivePEs using different formulas. McNemar test was performed tocompare percentage of eyes within 0.5 D, 1.0 D, and 2.0 D ofrefractive PEs. The Bonferroni correction was applied for multipletests. The SPSS 15.0 for Windows (SPSS Inc., Chicago, IL) was
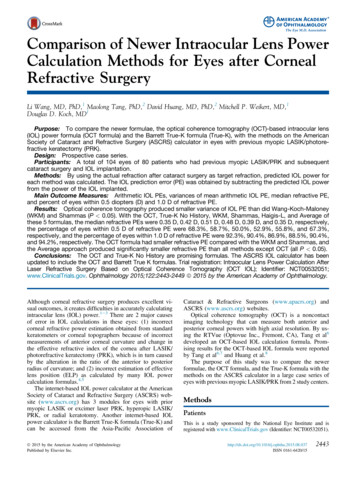
Wang et al IOL Using OCT, True-K, and ASCRS CalculatorTable 1. Demographic Summary of 104 Eyes of 80 /PRKMRSEAxial lengthIOL powerimplantedPost-cataractMRSE80 subjects28 eyesMean SD63 7 yrs 5.04 2.56 D46e79 yrs 11.38 to 1.50 DRange28 eyes 0.27 0.57 D 1.38 to þ0.50 D104 eyes104 eyes25.46 1.30 mm20.89 1.89 D22.59e28.67 mm17.0e25.50 D104 eyes 0.71 0.84 D 2.75 to 0.88 DD ¼ diopters; IOL ¼ intraocular lens; MRSE ¼ manifest refractivespherical equivalent; PRK ¼ photorefractive keratectomy; SD ¼ standarddeviation.used for statistical analysis, and a probability of less than 5% (P 0.05) was considered statistically significant.ResultsPatients’ demographic data are shown in Table 1. A total of 104eyes of 80 patients were included. The mean age was 63 7years. Of the 104 eyes, 28 eyes had before and after LASIK/PRK manifest refraction data available.Whole Group with Methods Using No Prior DataThe mean IOL PEs ranged from 0.34 D to 0.07 D (Table 2, Fig1). The OCT and Shammas formulas produced slightly myopicIOL PEs (P 0.05).Variances of IOL PE were 0.53 diopter squared (D2), 0.77 D2,0.79 D2, 0.89 D2, and 0.91 D2 for the OCT, Haigis-L, True-K NoHistory, Shammas, and WKM formulas, respectively. There wereno significant differences among the first 3 formulas. The variancesfor the Shammas and WKM formulas were significantly greaterthan that of the OCT formula (P 0.05) (Table 2).Median absolute refractive PEs were 0.35 D, 0.39 D, 0.42 D,0.48 D, and 0.51 D for the OCT, Haigis-L, True-K No History,Shammas, and WKM formulas, respectively (Table 3). There wereno significant differences among the first 3 formulas, but theShammas and WKM had significantly greater median absoluterefractive PEs than did OCT (P 0.05) and a significantlysmaller percentage of eyes within 1.0 D of refractive PE thandid OCT (P 0.05).Averaging IOL powers predicted from all 5 formulas using noprior data produced a variance of IOL PE of 0.60 D2 and medianabsolute refractive PE of 0.35 D, which was significantly smallerthan the median absolute refractive PE using all formulas exceptOCT (P 0.05). Averaging IOL powers predicted from the 3 bestformulas (OCT, Haigis-L, and True-K No History) further reducedthe variance to 0.55 D2 with a range of IOL PEs within 2.0 D andthe median absolute refractive PE to 0.31 D, which was significantly smaller than the median absolute refractive PE using allformulas except OCT (P 0.05).Subgroup with Methods Using Change in ManifestRefraction and No Prior DataThe mean IOL PEs ranged from 0.67 D to þ0.21 D with methodsusing DMR and from 0.51 D to 0.06 D with methods using noprior data (Table 4). With methods using DMR, variances of IOLPE were 0.97 D2 for True-K, 1.15 D2 for Masket, and 1.32 D2 forModified Masket; there were no significant differences amongformulas using DMR. With methods using no prior data, variancesof IOL PE were 0.56 D2 for OCT, 0.82 D2 for WKM, 0.85 D2 forHaigis-L, and 0.91 D2 for True-K No History; there were no significant differences among formulas using no prior data.With methods using DMR, the median absolute refractive PEswere 0.30 D, 0.32 D, 0.33 D, 0.66 D, and 0.70 D for the ModifiedMasket, Masket, True-K, Adjusted EffRP, and Adjusted Atlas0e3, respectively; there were no significant differences among thefirst 3 formulas (Table 5). Adjusted Atlas 0e3 had significantlygreater median absolute refractive PE than the Modified Masket,Masket, and True-K formulas (all P 0.05). With methods using no prior data, median absolute refractive PEs were 0.39 D, 0.44D, 0.47 D, 0.60 D, and 0.65 D for the OCT, Haigis-L, True-K NoHistory, WKM, and Shammas formulas, respectively; there wereno significant differences among formulas using no prior data.There were no significant differences among formulas usingDMR and no prior data. Averaging IOL powers predicted from allformulas using DMR and no prior data produced a variance of IOLPE of 0.74 D2 with all IOL PEs within 2.0 D and median absoluterefractive PE of 0.45 D.DiscussionReduced accuracy of IOL power calculation in eyes withprevious corneal refractive surgery is a clinical challenge.Table 2. Methods Using No Prior Data, Mean Arithmetic Intraocular Lens Prediction Error (Implanted Intraocular Lens Power ePredicted Intraocular Lens Power), and Variances of Arithmetic Intraocular Lens Prediction Errors (diopter squared)MethodsNo. of EyesMean SD (D)OCTTrue-K No HistoryWKMShammasHaigis-LAverage using no prior dataAverage OCT, Haigis-L, and True-K No History10410484104104104104 0.20 0.73* 0.07 0.89 0.19 0.95 0.34 0.94* 0.07 0.88 0.17 0.77 0.11 0.74Range (D) 2.10 1.86 2.17 2.09 2.15 1.93 ances (D2)0.53y0.790.91y0.89y0.770.600.55D ¼ diopter; D2 ¼ diopter squared; OCT ¼ optical coherence tomography; SD ¼ standard deviation; WKM ¼ Wang-Koch-Maloney.*Significantly different from zero.ySignificant different in variances of IOL PEs (all P 0.05 with Bonferroni correction).2445
Ophthalmology Volume 122, Number 12, December 2015Figure 1. Box-plot of intraocular lens (IOL) power prediction errors (PEs)with optical coherence tomography (OCT)-based IOL formula (OCT),True K No History (True-K), Wang-Koch-Maloney (WKM), Shammas,Haigis-L, Average of the 5 formulas (Avg5), and Average of 3 formulas(OCT, Haigis-L, and True-K No History) (n ¼ 104 eyes). D ¼ diopters.Newly introduced formulas include the OCT-based IOLformula and the Barrett True-K formula. In this study, wecompared the performance of these 2 newly introducedformulas with methods on the ASCRS calculator in a caseseries of 104 eyes.Our results showed that the OCT formula produced thesmallest variance of IOL PE and smallest median absoluterefractive PE, followed by the Haigis-L and the True-K NoHistory formulas, although there were no significant differences among these 3 formulas. Compared with the WKMand Shammas formulas, the OCT had significantly smallervariances of IOL PE and refractive PE. Similar findingswere observed in the subgroup with DMR data available.By using the Holladay IOL Consultant Program (Holladay Consulting, Bellaire, TX) and the ASCRS IOL powercalculator, Yang et al18 compared the accuracy of IOLpower calculation methods for patients after myopicexcimer laser surgery without previous refractive surgerydata. They reported that no statistically significantdifferences were observed among formulas using no priordata on the ASCRS calculator, specifically the WKM,Shammas No-History, Haigis-L, and ASCRS-Average,with mean absolute refractive PEs ranging from 0.79 D to0.92 D. In our study, the median absolute refractive errorsfor these formulas tend to be lower with ranges from 0.35 Dto 0.51 D.We also evaluated the performance of averaging IOLpowers predicted by various methods. Averaging IOLpowers predicted by the OCT, True-K No History, WKM,Shammas, and Haigis-L produced a refractive PE that wassignificantly smaller than all methods using no prior dataexcept OCT. Averaging IOL power predicted by the 3 bestformulas (OCT, Haigis-L, and True-K No History) reducedthe refractive PE further.In 46 eyes with previous myopic LASIK/PRK, Huanget al8 reported that the predictive accuracy of OCT was betterthan the Haigis-L and Shammas-PL formulas, with meanabsolute refractive errors of 0.49 D for OCT, 0.65 D forHaigis-L (P ¼ 0.031), and 0.62 D for Shammas-PL (P ¼0.044). In 39 eyes with previous LASIK/PRK, Fram et al19compared the accuracy of intraoperative aberrometrytechnology (ORA; Alcon Labs, Fort Worth, TX) and theOCT and Haigis-L. The mean absolute refractive PEs were0.34 D for ORA, 0.39 D for OCT, and 0.37 D for Haigis-L. Inour study with a larger number of cases (104 eyes), we found amedian absolute refractive PE of 0.35 D for OCT, 0.39 D forHaigis-L, and 0.48 D for Shammas; as did Fram et al,19 wefound no significant difference in outcomes between theOCT and the Haigis-L formula. Ianchulev et al20 reported amedian absolute refractive error of 0.42 D for ORA, 0.53 Dfor Haigis-L, and 0.51 D for Shammas.The Barrett True-K formula is based on measuredkeratometry and DMR induced by the refractive surgery.9,10 The True-K No History formula can be used whendata for DMR are not available. We are unaware of studiesTable 3. Methods Using No Prior Data, Median Absolute Refractive Prediction Error, and Percentage of Eyes within 0.5 D, 1.0 D, and 2.0D of Refractive Prediction Error by Assuming tha
The internet-based IOL power calculator at the American Society of Cataract and Refractive Surgery (ASCRS) web-site (www.ascrs.org) has 3 modules for eyes with prior myopic LASIK or excimer laser PRK, hyperopic LASIK/ PRK, or radial keratotomy. Another internet-based IOL power calcu