Transcription
Comparison of Zernike and FourierWavefront Reconstruction Algorithms inRepresenting Corneal Aberration of Normaland Abnormal EyesGeunyoung Yoon, PhD; Seth Pantanelli, MS; Scott MacRae, MDABSTRACTPURPOSE: To investigate the accuracy of Zernike andFourier reconstruction algorithms in describing simulated wavefront data from corneal topography of normaland abnormal eyes.METHODS: Corneal topography (Orbscan IIz) was collected on 87 normal, 27 keratoconus, 9 penetratingkeratoplasty (PKP), and 20 postoperative LASIK symptomatic eyes over a 6-mm pupil. Raw data from slit imageswere converted into elevation maps, which were then resampled at resolutions of 100, 300, and 500 µm. Differences in elevation between adjacent pixels were used togenerate simulated wavefront slope data. Both conventional Zernike and iterative Fourier algorithms were usedto reconstruct the elevation map from the same slopeinformation. The difference between the reconstructedand original maps was used to evaluate reconstructionperformance, quantified by the residual root-meansquare (RMS) error.RESULTS: When using the Zernike-based method, residual RMS error decreased substantially as the numberof modes used in the reconstruction increased up to approximately the 10th order. Both Zernike and Fourier algorithms performed best when reconstructing simulatedwavefronts from normal eyes and worst with PKP eyes.Using a large number of Zernike modes to reconstructsimulated wavefronts of low spatial resolution lead toinaccurate reconstructions. The Fourier method hadbetter reconstruction reliability in the center of the pupilthan peripherally. Only 2nd through 5th order Zernikemodes were required to produce less residual RMS errorthan the Fourier method.CONCLUSIONS: For all conditions tested, the Zernikemethod outperformed the Fourier method when representing simulated wavefront data from topography maps.Even 2nd through 5th order Zernike polynomials wereenough to outperform the Fourier method in all populations. Up to 9th order Zernike modes may be requiredto accurately describe the simulated wavefronts in someabnormal eyes. [J Refract Surg. 2008;24:582-590.]For nearly 30 years, the eye’s wavefront aberration hasbeen objectively measured using a number of differentaberrometry techniques.1-4 To facilitate application ofthe technology clinically, it has become necessary to express theeye’s aberration mathematically. The Zernike polynomials, anorthogonal base function used to describe optical systems withcircular pupils, have thus far fulfilled this need.5 In 2001, Porteret al6 showed through a principal components analysis that theZernike polynomials efficiently described the eye’s wavefrontaberration. Although they demonstrated that the Zernike fittingmethod was not perfect and that it resulted in residual rootmean-square (RMS) error, the amount of error was undefinedand uncorrelated to the number of modes used.Despite previous acceptance of the Zernike polynomials,there has been recent scrutiny concerning the accuracy withwhich they can represent the total ocular wave aberration,especially in abnormal eyes such as those having keratoconus, penetrating keratoplasty, or severe trauma.7-10 In 2003,Smolek and Klyce9 showed that the corneal fit error of theZernike polynomials strongly correlated with visual acuity.They concluded from this that the polynomials did not fullycharacterize the surface features that affect vision. They alsoobserved an unpredictable increase in wavefront error whenusing a larger expansion series (10th order) to represent thecorneal aberration. In 2004, Klyce et al10 reiterated their concern with respect to using Zernike polynomials in surgicalor pathological eyes. They found that using Zernike polynomials in normal eyes was acceptable, but that large amountsof higher order aberration present in pathologic eyes causeFrom the Department of Ophthalmology (Yoon, MacRae), School of Medicineand Dentistry (Yoon, Pantanelli), University of Rochester, Rochester, NY.This research was funded by grants from the NIH (R01-EY014999) andResearch to Prevent Blindness Inc, New York, NY.The authors have no proprietary interest in the materials presented herein.Correspondence: Seth Pantanelli, MS, 261 Meliora Hall, Center for VisualScience, University of Rochester, Rochester, NY 14627. Tel: 203.948.3443;Fax: 585.271.3043; E-mail: seth pantanelli@urmc.rochester.eduReceived: January 24, 2007Accepted: June 15, 2007Posted online: December 28, 2007582journalofrefractivesurgery.com
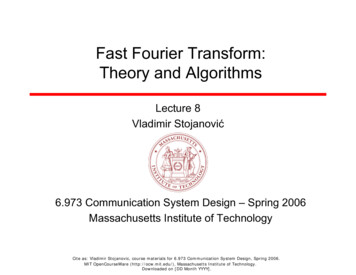
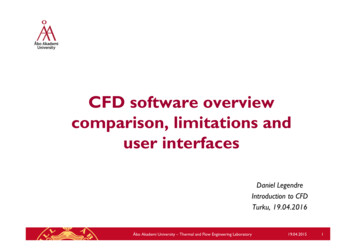
Zernike vs Fourier Wavefront Reconstruction/Yoon et alFigure 1. Method for reconstruction of elevation data. First the original corneal topographyelevation map was resampled at 100, 300,and 500 µm. For each of the three sampledelevation maps, the x- and y-slopes werecalculated across the entire pupil by comparing differences in elevation between adjacentpixels. Zernike and Fourier reconstructionalgorithms were applied to reconstruct theoriginal, sampled wavefront from wavefrontslope data. Subtraction of the reconstructedmap from the originally sampled one resultedin an objective measure of reconstructionaccuracy, expressed as residual root-meansquare (RMS). In this equation, x is definedas the elevation of a single data point withinthe given pupil, µ is the ideal elevation of asingle data point (zero), and n is the numberof sampling points.significant fit error and an underestimation of the totalhigher order corneal aberration present.10Other methods including zonal reconstruction usingbi-cubic splines and use of a Fourier series have beensuggested as alternatives for representation of the waveaberration in eyes.11,12 Of these, the Fourier series hasbecome of particular interest recently. Similar to theZernike polynomials, the Fourier series is an infiniteexpansion that can be used to represent any complexshape (including a wave aberration) by breaking it intoits frequency components. Previous studies by Smolekand Klyce that used a Fourier-based algorithm workedby directly fitting the surface of the cornea.9 However,most commercially available ophthalmic wavefrontsensors use a different method, namely wavefrontslope fitting. Therefore, their results may not be directly applicable to most scientific and clinical studiesinvolving wavefront sensors.More recently, Dai13 published the first studycomparing Fourier and Zernike reconstruction algorithms using the wavefront slope fitting method. Heconcluded that the Fourier algorithm outperformedthe Zernike algorithm on highly aberrated wavefrontshapes, but the study made several assumptions thatmay compromise objectivity and clinical applicability. For example, his choice of randomly regeneratedZernike coefficients up to the 15th order as a goldstandard makes it difficult to correlate performanceof these algorithms to wavefront shapes similar tothose found in normal and abnormal eyes. Perhapsmore importantly, Dai started with a 10-mm pupil butbased reconstruction performance on only the centralJournal of Refractive Surgery Volume 24 June 20086 mm. Because it is impractical to measure wavefrontslope over a 10-mm pupil clinically, true reconstruction performance should be based on a smaller reference pupil size. These shortcomings are outlined ingreater detail in the discussion.The purpose of this study was to investigate therelative accuracy with which the Zernike polynomials and Fourier series can represent the corneal surfaceaberration in both normal and abnormal eyes.MATERIALS AND METHODSZERNIKE AND FOURIER RECONSTRUCTIONSBecause no gold standard exists to represent the total ocular aberration perfectly, corneal topography datawere used as a reference. Using an Orbscan IIz (Bausch& Lomb, Rochester, NY) videokeratographer, cornealtopography maps were acquired on 87 normal, 27 keratoconic, 9 penetrating keratoplasty, and 20 postoperative LASIK symptomatic eyes. Careful attention wasgiven to ensuring that no data points were missing within a 6.0-mm pupil before proceeding. Sampling resolution of the topography measurements was 100 µm. Foreach measurement, raw data from the slit images wereconverted to an elevation matrix by subtracting eachdata point from a best fit sphere as calculated by themanufacturer’s software. All further processing wasbased on the difference from sphere elevation matrix.Data points outside a 6.0-mm pupil were forced to zero.The processing method is illustrated in Figure 1. Foreach map, the elevation matrix was first resampled at100-, 300-, and 500-µm resolutions by averaging the583
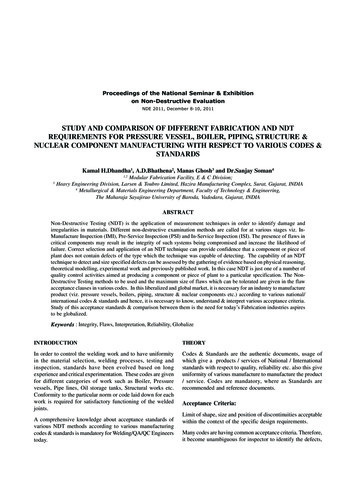
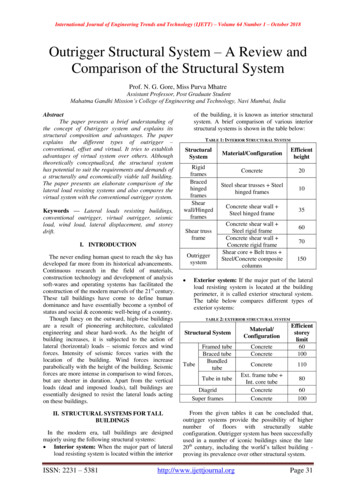
Zernike vs Fourier Wavefront Reconstruction/Yoon et alWavefront Height (µm)Figure 2. Validation of the Fourier reconstruction algorithm. The input function wasprimary spherical aberration, representedby a solid line. The reconstructed waveformis represented by a dashed line. Originaland reconstructed waveforms differ slightlyperipherally, however, results actually outperform the original algorithm presented byRoddier in 1991.12Pixel Valueelevation across adjacent pixels. This was done to simulate the sampling that would typically be observedfrom Shack-Hartmann wavefront sensors with comparable lenslet spacings. Two matrices of x- and y-slopeswere generated from the elevation matrix by usingMATLAB’s (The MathWorks Inc, Natick, Mass) “gradient” function, which calculates slope based on the firstorder central difference. The wavefront slopes werecomputed from the elevation matrix for each lensletsize before applying the two reconstruction methods.Therefore, both algorithms used the exact same wavefront slope data as a starting point.A conventional Zernike reconstruction algorithm thatworks from wavefront slopes3 was applied to each pairof x- and y-slope matrices to produce a reconstructedmap with the same resolution as the originally sampledelevation map. This was first done using only 1 Zernikemode, then 2, 3, etc. In each successive reconstruction, one additional Zernike mode was used until 130Zernike modes (15th order) were used to reconstructthe wavefront. Each new wavefront map generated wasdirectly compared to the originally sampled wavefrontand the residual root-mean-square (RMS) error betweenthe original and reconstructed map was recorded. Whenthe 300- and 500-µm resolution reconstructed wavefront maps were generated, the RMS error calculationwas based on the number of data points in those maps,and not on the number present in the original wavefrontmap. Ultimately, for each eye the Zernike analysis resulted in three plots (one at each simulated lenslet spacing—100, 300, and 500 µm) of RMS difference betweenoriginal and reconstructed wavefronts versus the number of Zernike modes used. The residual RMS error as584a function of the number of Zernike modes used wasaveraged across each population.An iterative Fourier algorithm that works fromwavefront slope data12 was also used to reconstructeach sampled elevation map from the exact same pairof x- and y-slope matrices used for the Zernike reconstruction. First, a discrete Fourier transform was takenover a 6-mm pupil containing the x- and y-slope dataso that they were expressed as functions of u and v,respectively. The variables u and v are defined as thehorizontal and vertical frequency components of thespatially defined arrays. The Fourier transform of thex-slope was multiplied by u and that of the y-slope byv. After adding the results, the inverse Fourier transform was computed to produce a wavefront estimate.For simplicity, this process was iterated six times foreach eye to ensure convergence and minimize error(a separate test showed that more iterations did notsignificantly decrease error any further). Because nomodes are present in the Fourier algorithm, only onereconstruction per patient was required. Each reconstructed elevation map consisted of the same numberof sampling points as the original sampled elevationmap, which may also be thought of as the number oflenslets within a given pupil diameter. The reconstructed elevation map was subtracted from the originally sampled elevation map and the residual RMSerror was measured.VALIDATION OF FOURIER RECONSTRUCTION ALGORITHMIn 1991, Roddier and Roddier12 published a methodof reconstructing wavefronts based on iterative Fouriertransforms (discussed further below). Data from theirjournalofrefractivesurgery.com
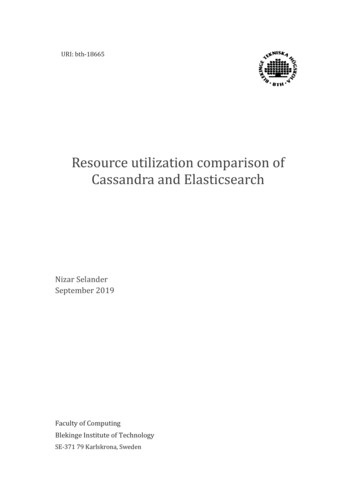
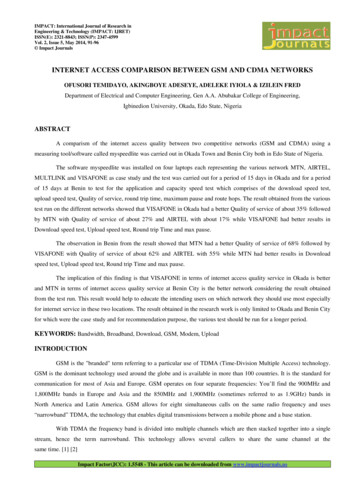
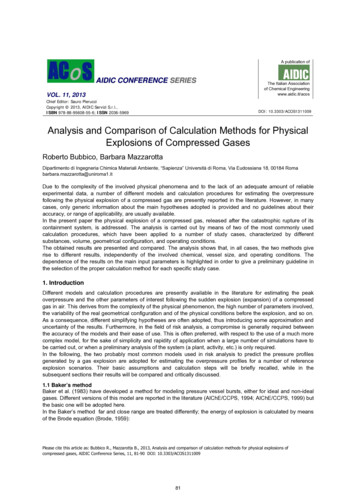
Zernike vs Fourier Wavefront Reconstruction/Yoon et alwork was used to validate our own implementation. Intheir paper, primary spherical aberration was used asthe input function. The same exact test was used in ourstudy, and the results are shown in Figure 2. Althoughthe input function and the reconstructed waveformdiffered slightly peripherally (discussed later), our algorithm appeared to perform as well or better than theoriginal Roddier simulation from 1991.CONDITION NUMBER CALCULATIONAs described elsewhere,3,14 calculation of theZernike coefficients from wavefront aberrometer datarequires solving the following equation:s D c(1)where c is the vector of Zernike coefficients to be calculated, D is a rectangular matrix consisting of 1st derivatives of each Zernike polynomial with respect to xand y at each lenslet position, and s is the vector of spotdisplacements (x- and y-slopes) measured with the wavefront sensor. Because D is a rectangular matrix, its inversecannot be calculated directly. To solve Eq.(1), a methodcalled singular value decomposition (SVD)15 can be used.Inaccuracies in calculating the SVD result in error calculating the Zernike coefficients, which in turn leads towavefront reconstruction error. The condition numbercan be used to quantify the reliability of this calculation.The condition number is the ratio of the absolute values of the largest to smallest singular values. Conditionnumbers near 1 indicate a well-conditioned matrix. Asthe condition number increases, the SVD calculation becomes less reliable and more sensitive to a small error inthe measured wavefront slopes, which in turn causes anincrease in reconstruction error.Given a fixed number of sampling points, the condition number will increase with the increasing numberof Zernike polynomials chosen to represent the wavefront. It is important to note that this relationship is notlinear and will not be identical for every patient becauseerror in reconstructed wavefronts depends on the individual’s amount of aberration. In other words, no constant relationship exists between the absolute value ofthe condition number and reconstruction accuracy.To evaluate the SVD calculation, four conditionswere tested: 277, 145, 89, and 61 sampling points, whichcorresponded to sampling resolutions of 300, 400, 500,and 600 µm over a 6.0-mm pupil, respectively. For eachfixed number of sampling points, the condition numberof the matrix was calculated using varying numbers ofZernike modes (from 45 to 140). A plot was constructedto illustrate the relationship between condition numberand number of Zernike modes used (Fig 3).Journal of Refractive Surgery Volume 24 June 2008Figure 3. Condition number versus number of Zernike modes used inreconstruction. The condition number is a mathematical quantification ofthe accuracy of matrix conversion; accurate matrix conversion, in turn,leads to reliable reconstruction with the Zernike polynomials. If the number of Zernike modes used during reconstruction is too many relative tothe number of sampling points (lenslets), the condition number will beexponentially large, and reconstruction accuracy will be poor.RESULTSThe results from studying reliability of the Zernikereconstruction algorithm are displayed in Figure 4. Forall four of the populations studied, the residual RMSerror in reconstruction decreased logarithmically as thenumber of Zernike modes used in the reconstructionincreased. This was especially true when the wavefront was sampled at resolutions of 100 and 300 µm.The Zernike reconstruction algorithm was more efficient (obtained good representation with fewer modes)in its ability to reconstruct wavefronts from normaleyes than abnormal eyes. For both 100- and 300-µmresolution wavefront maps, the Zernike method wasmost efficient in reconstructing eyes from the normalpopulation and least accurate with regards to PKPeyes. For wavefront reconstructions at a resolution of500 µm, the trend was less consistent. Although the reconstruction error decreased initially with increasingZernike modes, the trend destabilized and eventuallybegan to increase as the number of Zernike modes usedfor the reconstruction became greater than 70 modes.Interestingly, the only population that did not destabilize at this resolution of 500 µm was the symptomaticpostoperative LASIK group.Resolution used with the Fourier method was notmanipulated and was directly determined by the sampling resolution. The sampling resolutions used withthe Fourier method may be thought of as three different lenslet sizes (100, 300, and 500 µm). Results fromstudying reliability of the Fourier reconstruction algorithm are shown in Figure 5. The residual RMS error585
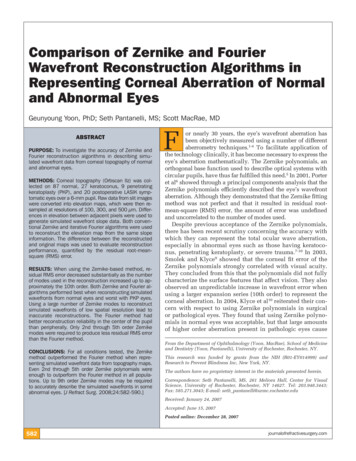
Zernike vs Fourier Wavefront Reconstruction/Yoon et alFigure 4. Residual root-mean-square (RMS) reconstruction error as a function of number of Zernike modes used (100-, 300-, and 500-µm cases). Forboth 100- and 300-µm lenslet spacings, reconstruction accuracy increased and residual RMS error decreased logarithmically as more Zernike modeswere used (up to 130). The Zernike reconstruction algorithm consistently performed best on normal eyes and worst on penetrating keratoplasty (PKP)eyes. When a resolution of 500 µm was used, residual RMS error initially decreased logarithmically as the number of modes used in the reconstructionincreased; however, when a large number of modes were used, residual RMS error actually began to increase for three of the four populations (not forthe postoperative LASIK complaint). The result emphasizes that trying to use too many Zernike modes when sampling resolution is relatively low leadsto greater reconstruction error.Figure 5. Zernike versus Fourier comparison of reconstruction performance. As thenumber of sampling points decreased, theZernike reconstruction algorithm performedmore poorly; however, the Fourier methodactually improved slightly in accuracy as thenumber of sampling points decreased. Whenperforming optimally, the Zernike reconstruction algorithm appeared to outperform theiterative Fourier method for all populationsand conditions tested. KC keratoconic,PKP penetrating keratoplastyfrom the Fourier reconstruction is compared to the error resulting from the Zernike method when it was performing at its best (ie, the lowest stable residual RMSerror for each population and resolution was chosen torepresent the performance of the Zernike algorithm ateach of the tested conditions). For the Zernike method,the residual RMS reconstruction error decreased asthe sampling resolution of the original elevation mapincreased. This trend was statistically significant forthe normal population (P .01), but not for any of the586others. For the Fourier method, as the sampling resolution became less fine, reconstruction error actuallydecreased; however, the observation was not statistically significant. Both methods were best at representing wavefronts from the normal population whereasabnormal eyes had significantly larger errors. Regardless of the resolution used or population measured, theZernike reconstruction algorithm appeared to outperform the Fourier method (P .01). In fact, only up to the5th order Zernike modes (20 terms excluding piston)journalofrefractivesurgery.com
Zernike vs Fourier Wavefront Reconstruction/Yoon et alwere required to outperform the Fourier method at every condition tested; more Zernike modes resulted ineven greater accuracy.DISCUSSIONIn this study, we used simulated wavefront slopedata to reconstruct corneal shapes using both Zernikeand iterative Fourier algorithms. The algorithms werecompared by determining what conditions minimizedresidual RMS
keratoplasty (PKP), and 20 postoperative LASIK symp-tomatic eyes over a 6-mm pupil. Raw data from slit images were converted into elevation maps, which were then re-sampled at resolutions of 100, 300, and 500 µm. Differ-ences in elevation between adjacent pixels were used to generate simulated wavefront slope data. Both conven-