Transcription
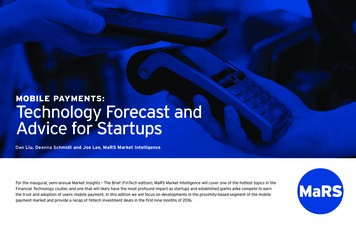
MOBILE PAYMENTS:Technology Forecast andAdvice for StartupsDan Liu, Deanna Schmidt and Joe Lee, MaRS Market IntelligenceFor the inaugural, semi-annual Market Insights – The Brief (FinTech edition), MaRS Market Intelligence will cover one of the hottest topics in theFinancial Technology cluster, and one that will likely have the most profound impact as startups and established giants alike compete to earnthe trust and adoption of users: mobile payment. In this edition we will focus on developments in the proximity-based segment of the mobilepayment market and provide a recap of fintech investment deals in the first nine months of 2016.
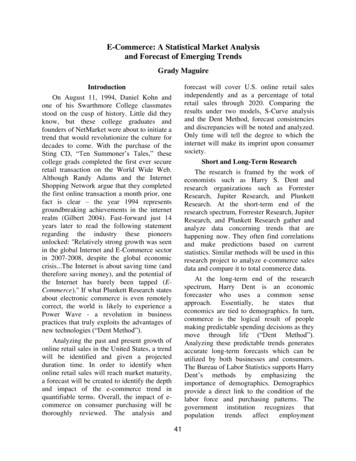
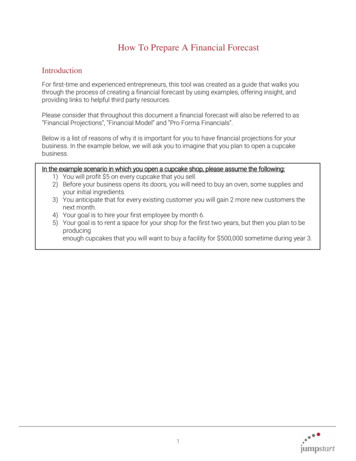
EXPONENTIAL GROWTH IN MOBILE PAYMENTSThe rise of mobile payments marks asharp disruption to traditional banking,demanding new technology developmentthat integrates with existing, establishedpayment systems.With so many players contributing to the end-user experience inpayments—including payment software developers, merchants, paymentnetworks, mobile device manufacturers, mobile network operators andbanks—creating a seamless mobile payment experience for customersis a complex undertaking. The majority of mobile payments can becategorized as either remote based or proximity based. Analysts warnedas recently as 2015 that many banks across the world will struggle totackle this challenge and to compete with Apple and Alphabet/Google,which have successfully brought mobile payment options to market.1IDC predicts that, by 2020, total worldwide consumer mobile paymentswill reach 3.814 trillion annually.2FIGURE 1: IDC FORECAST OF WORLDWIDE CONSUMER MOBILE PAYMENTS, 2014 TO 2020(IN US 016Remote2017201820192020ProximitySources: IDC Financial Insights' 2014 Consumer Payments Survey; IDC's New Media Market Model, 20151 Robert Smythe, Lars Goransson, Sanjay Khanna. (2015). Perspective: Banks Not Positioned to Deliver Mobile Payments’ Core Functions. IDC Financial Insights.2 James Wester. (2015). Business Strategy: Worldwide Consumer Mobile Payments Forecast, 2015–2020. IDC Financial Insights.FinTech Mobile Payment Report02
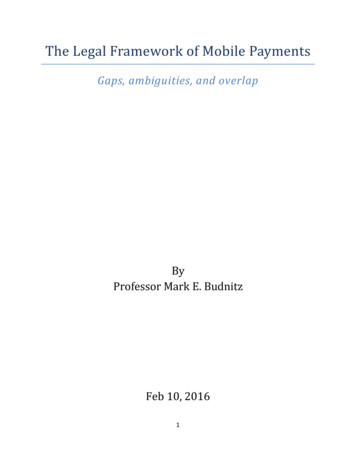
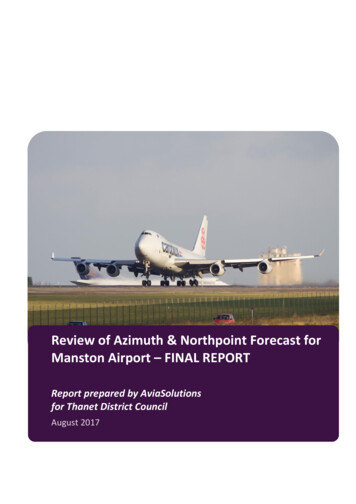
THE CUSTOMER EXPERIENCE IMPERATIVE IN MOBILE PAYMENTUsers’ full adoption and use of the technology is currently citedas one of the most prominent roadblocks to the advancement ofmobile payments at point of sale.According to IDC research associates Robert Smythe andLars Goransson, consumer demand is simply not there:“The transition to mobile payments will only take place whenconsumers see that using mobile devices for payments providesthem with added value and convenience beyond plastic cards.” 3Perceived value and convenience are the main aspects of theoverall user experience, and are therefore fundamental elementsof the advancement of mobile payments. IDC cites Appleand Starbucks as examples of the value of focusing on userexperience within digital payment platforms.“consumer cash on its apps and gift cards. This begs the question:how can financial institutions similarly capture this success? 5Banks currently face the challenge of providing a compellingdigital experience that will draw—and keep—consumers:“Competing to win customers with better digital customerexperiences than the traditional banking experience, thesedigital banks are embracing mobile and social technologies,using digital platforms to offer simple, convenient customerexperiences combined with relevant guidance and advice.”6Achieving perceived convenience in the eye of the customerrequires seamless coordination between different partners, aquality that is not yet prominent in the relatively new market ofmobile payments: “Most of the mobile payment participants arecurrently proceeding with independent, uncoordinated initiatives.This is reminiscent of the initial implementation of ATM servicesthat ultimately led to the formation of Interac in Canada.”7FIGURE 2: COMPARISON OF DEPOSITS AT PAYPAL, STARBUCKS AND OTHER NORTH AMERICAN FINANCIALINSTITUTIONS (IN US BILLIONS) 28.9430Starbucks has become the leader indemonstrating how mobile paymentsand loyalty features can be integratedinto the overall purchasing process todeliver superior client service. This typeof integration has to be the goal of allmobile payment solutions providers.”The Seattle-based coffee brand has made a name for itselfwithin digital payments, with six million mobile orders and paytransitions processed per month in 2016, and 1.2 billion in252015 13.02105 2.68 1.24 6.5 4.55 0.560StarbucksPayPalSVBFinancialThe Bancorp Green DotInc.Corp. 1.03LibroCreditUnionMeridianCreditUnionAll Ontariocredit unionsSource: Marketwatch,WSJ, S&P Global MarketIntelligence, Starbucks,Libro Credit Union,Merdian Credit Union,DICONote: All Canadianfinancial institutiondeposit figures wereconverted from CA toUS on November 11,2016.3 Robert Smythe and Lars Goransson. (2016). Business Strategy: Mobile Payments in Canada – 2016 Status Update. IDC Financial Insights.4 Smythe and Goransson. (2016).5 Tonya Garcia. (2016, June). Starbucks has more customer money on cards than many banks have in deposits. Retrieved November 1, 2016 from MarketWatch: deposits-2016-06-096 Alyson Clarke et al. (2016). Trends 2016: North American Digital Banking. Forrester.7 Smythe and Goransson. (2016).FinTech Mobile Payment Report03
CANADIAN MOBILE PAYMENT LANDSCAPE IN 2017While PayPal, Starbucks and Apple are the currentmobile payment leaders in Canada, new challengersare coming soon. The net effect could be an increasein mobile payment adoption.“Once Samsung Pay and Android Pay launch inCanada to compete with Apple Pay, you will have moreusage and ubiquity among mobile (NFC) contactlesstransactions at the point of sale and online. Apple,Samsung and Alphabet (Google) will be the threedistinct contenders,” states Dinaro Ly, director offinancial technology at MaRS Discovery District.According to the Canadian Payments Forecast 2016by Technology Strategies International, the valueof contactless payments made by consumers inCanada more than doubled in 2015, increasing byabout 30 billion (Canadian dollars) through 1.2 billiontransactions.Under that scenario, retailers and merchants will haveto ask themselves some hard questions about theacceptance of Apple Pay, Samsung Pay or Android Pay.Ly believes that “business owners must continue to tryand balance costs associated with [accepting mobilepayment] with providing more choices for consumersto pay.”The arrival of Android Pay in Canada could be thetipping point that turns Canada into a more mobilepayments–centric country in 2017.FinTech Mobile Payment ReportSamsung Pay and Android“ OncePay launch in Canada to competewith Apple Pay, you will have moreusage and ubiquity among mobile(NFC) contactless transactions atthe point of sale and online. Apple,Samsung and Alphabet (Google) willbe the three distinct contenders”Dinaro Ly, director of financial technology,MaRS Discovery DistrictMOBILEPAYMENTLEADERSIN CANADAMOBILE PAYMENT APPS USED BY MOBILE PAYMENTUSERS IN CANADA IN 2016 BY GENERATIONMILLENNIALS(18-35)NONMILLENNIALS(36 OR OVER)TOTALPayPal67%72%70%Starbucks49%35%42%Apple Pay26%25%26%Source: eMarketer, Catalyst Canada, “2016 Canadian Smartphone Landscape”sponsored by WPP and GroupM and conducted by Toluna, June 9, 201604
COMMUNICATION TECHNOLOGIES FOR PROXIMITY-BASEDMOBILE PAYMENTS: NFC VERSUS BLEWhile consumers in general are quite familiar with payingremotely through online checkouts (like PayPal) and peer-topeer payments (like Interac e-Transfer), they are just gettingused to proximity-based mobile payment options at a retaillocation. Regardless of the proximity-based solution, it will likelybe based on either near field communication (NFC) or Bluetoothlow energy (BLE) in five years.COMMUNICATIONTECHNOLOGIESIN MOBILE PAYMENTSNEAR FIELD COMMUNICATION (NFC)BLUETOOTH LOW ENERGY (BLE)How it worksNFC-enabled smart devices with proper userinterface connecting to NFC payment system(including tags, control readers, etc.)BLE-enabled smart devices with proper userinterface connecting to BLE beaconsFor example, IDC predicts that NFC payments will rise from 50.7billion in 2016 to 292.8 billion in 2020. (We are omitting 2Dbarcode-based payment technologies from this analysis.) Thefollowing is a quick summary of the key features and differencesbetween the two technologies.Device y 20 cm (practically 10 cm or less)About 1 m to 70 mCommunicationsprotocolsBased on existing RFID standardsPart of the Bluetooth 4.0 core specificationWhile BLE beacons are more versatile than NFC, the adoptionof beacons has been slower than expected. In fact, it has beenargued that the adoption of beacons has failed to materialize.8According to the 2016 Future of Retail Study by Walker SandsCommunications, security and privacy concerns are barriers tomobile payment services, and they are largely issues tied strictlyto beacons.9 This leaves NFC as the current leader in the battlefor proximity-based mobile payments.AccuracyVery high (especially when within practical range)High, but interference is possibleSecurityMinimal security risks (data communication shouldbe secured in payments by default)Security risks around how an app engages withbeaconsPrivacyLess intrusive with the potential to monitor onlywhen NFC is engagedMore intrusive with the potential tocontinuously monitor devicesPopular device/service examplesAndroid Pay; Apple Pay; Samsung PayiBeacon (Apple); Eddystone (Google); AltBeacon(Radius Network)Companies adopted/trialed technologyCanadian Tire; Chapters/Indigo; Starbucks; TimHortons; UberAmerican Eagle Outfitters; Hudson’s BayCompany (Lord and Taylor)Sources: Beaconstac; EDN Europe; International Telecommunication Union; Lighthouse.io; Mobile Payments Today; Safari Books8 Joshua Brustein. (2015). Apple’s Failed Retail Revolution: Beacons Still Won’t be Big on Black Friday. Bloomberg Technology. Available online: -t-be-big-on-black-friday9 (2016). Reinventing Retail: Four Predictions for 2016 and Beyond. Walker Sands Future of Retail 2016. Available online: fFinTech Mobile Payment Report05
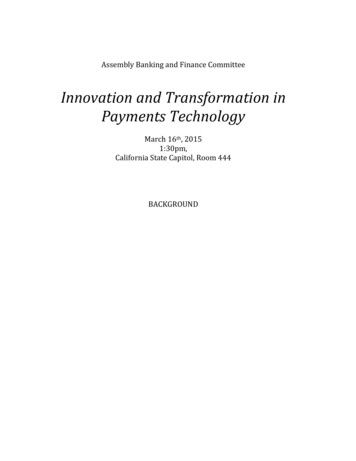
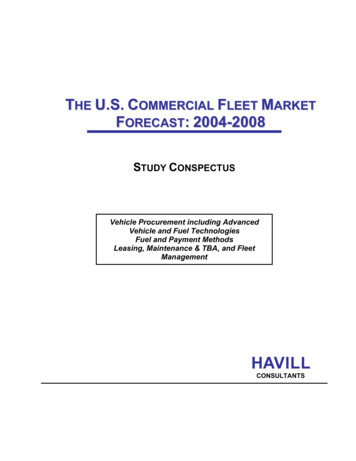
APPLE PAY’S GLOBAL AMBITIONDuring its announcement of the next generation of iPhoneand Apple Watch products in September, Apple confirmed theinclusion of FeliCa technology in its newest hardware.FeliCa is a contactless payment standard developed by Sonyin Japan. Initially, FeliCa “smart cards” allowed users to storetickets and passes for accessing public transit as well ase-money, an electronic form of currency. E-money eventuallybecame a prevalent payment option that was acceptedeverywhere, from convenience stores to cafés to vendingmachines. Mobile FeliCa, commonly called Osaifu-Keitai(which translates to “wallet-cellphone”), was later developed asa hybrid technology for smartphones in partnership with NTTDoCoMo, a leading cellular provider in Japan.According to the Bank of Japan, there are 1.9 millionFeliCa-enabled payment terminals in the country, whichhandled transactions totalling 4.6 trillion yen ( 46 billion) lastyear (Bloomberg).10 Comparatively, it was reported that therewere 1.3 million NFC terminals in the United States and 320,000in the United Kingdom last year. Therefore, Japan representsa significant market for Apple Pay’s revenue opportunity.Working closely with transit operators, Apple launchedFeliCa-enabled Apple Pay services in October 2016 forcommuters. Unfortunately, the launch did not go as smoothlyas the company had hoped, as users experienced disruptionslasting several hours.11 The problem was a higher than expectedvolume of usage that caused server overload.According to Jennifer Bailey, the head of Apple Pay, the servicehas enrolled one million users in just six weeks after launch.12Apple’s plan to use transit payment as a gateway for users tobecome more comfortable in adopting Apple Pay service in Japanseems to be paying off. Elsewhere, Apple continues to expandits payments service beyond proximity. According to paymentsanalytics from SimilarTech, Apple Pay is now the fourth mostpopular payment technology among the top 10,000 sites.During Apple CEO Tim Cook’s recentvisit to Japan he told a reporterthat he would like [Apple] “to bea catalyst for taking cash out ofthe system.” This is a particularlyambitious goal, as Japan’s economy,like many others in Asia, is still verymuch driven by cash transactions.13FIGURE 3: TOP PAYMENT TECHNOLOGIES AMONG TOP 10K SITES (AS OF DECEMBER 12, 2016)3.5%1.4%PayPalGrowing pains with any new products or services can certainlybe expected, even with 26%0.17%0.12%Apple PayBraintreeSkrillMasterPassKlarnaSource: SimilarTech10111213Mark Gurman and Gareth Allan. (2016). Apple Plans iPhone for Japan with Tap-to-Pay for Subways. Bloomberg Technology. Available online: y-for-subwaysPavel Alpeyev and Gareth Allan. (2016). Apple Pay Has Rocky Debut in Japan as Commuters Hit Snags. Bloomberg Technology. Available online: muters-struggleMikey Campbell (2016). Apple Pay now accepted at 35% of US merchants, coming to Gap and more in 2017. Available online: -and-more-in-2017Waichi Sekiguchi. (2016). Apple CEO says iPhone’s future is in AI. Nikkei. Available online: O-says-iPhone-s-future-is-in-AIFinTech Mobile Payment Report06
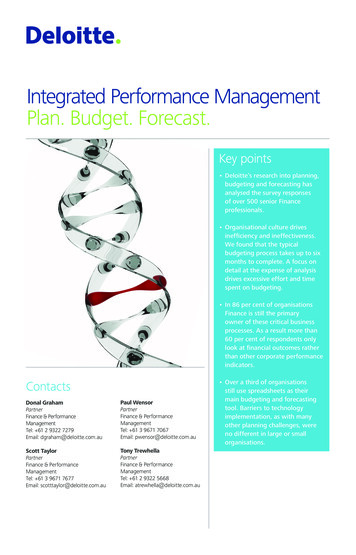
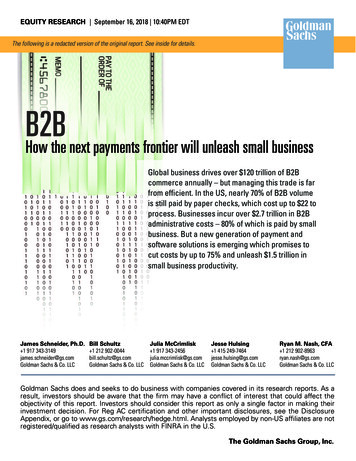
IT’S YOUR MOVE, CANADIAN FINTECH STARTUPSAccording to IDC’s Business Strategy: Mobile Payments inCanada – 2016 Status Update, new entrants can find successby focusing on the following three key themes: understanding and accessing the Canadian paymentsecosystem through innovative thinking and ability; looking to payment networks for assistance in offeringpayment services; and adding value to merchants through payment, loyalty andmerchandising solutions.Additional opportunities might be present for mobile paymenttechnologies to partner with smartphone companies (that arelagging on their mobile payment/wallet initiatives) to address themutual focus on user experience and, by extension, with banksand other emerging technologies such as biometric companies.The smartphone market within Canada has, for example,reached maturity and continues to see modest growth thatis driven by consumers transitioning to new devices uponsigning new contracts.14 Such crowded markets demand newapproaches to product development and marketing: “Vendorsneed to pay closer attention to points of differentiation andvalue, and they need to start crafting marketing campaignsthat break through the clutter and elevate their products inCanadian consumers’ minds.”15This will not be a solely Canadian phenomenon as many parts ofthe world reach the throes of the once-in-a-lifetime smartphoneboom. Aside from smartphone leaders like Apple and Samsung,tech unicorn Xiaomi announced Mi Pay in September 2016 in anattempt to further differentiate itself from the pack.14151617That said, Ly thinks that it will be a difficult task for startups toprofit from cash displacement, even though the trend is firmlyin place. According to the Canadian Payments Association,cash is the only payment method in decline in the point-ofsale environments since 2008. Recent Moneris research foundthat, by 2030, only 10% of money spent in Canada will be cashpurchases. To avoid direct competition with tech giants likeApple, Samsung or Google, startups should focus on finding aniche and differentiating their products/services.“Startups need to pick a few of those themes and really punchabove their weight to differentiate themselves from the giants.For example, Mobeewave and SelfPay are two startups that areactually helping to drive the displacement of cash in Canada,”advises Ly.SUMMARY OF VC-BACKED FINTECH ACTIVITIESIN CANADA AND NORTH AMERICAThe Canadian fintech scene is not immune to a potentialslowdown in global fintech investment activities due to economicor political uncertainties and concerns with valuation.16 Forresteranalyst Oliwia Berdak concluded recently that not many fintechunicorns can live up to their inflated valuations.17 However, while2016 Canadian fintech venture capital (VC) investment activitiesdecreased on a quarter-to-quarter basis (from Q1 to Q2 and fromQ2 to Q3), the first half of 2016 was the best six-month stretchover the past two years. There were 11 VC deals in Canada,totalling 88.8 million, with more than 55% of investmentoccurring in the first quarter of this year. This translates intoapproximately 4% of total fintech investment in North America(US and Canada). North American fintech ventures raised 3.04billion through 209 deals in the first half of 2016.unicorns have proliferated.“ FintechNow investors are asking how manyof these firms can live up to theirinflated valuations. Their conclusion:not many. As a result, markdowns andstock-price collapses have begun.Oliwia Berdak, Senior Analyst at Forrester Research”FIGURE 4: POINT-OF-SALE TRANSACTIONVOLUME BY PAYMENT METHOD, 2008 TO 2014(IN 2011Prepaid Cards2014Credit CardsCashSource: Canadian Payments AssociationSanjay Khanna et al. (2015). IDC. Canadian Mobile Device Forecast 2015–2019.Khanna. (2015).KPMG. (2016). The Pulse of Fintech, Q2 2016. Oliwia Berdak. (2016). The Wounded Unicorns of Fintech. Forrester.FinTech Mobile Payment Report07
FIGURE 5:CANADIAN FINTECHDEALFLOW, 2014 Q4TO 2016 Q3(IN US MILLIONS) 205M-7.74%19-26.92%Funding in last yearYOY funding growthDeals in last yearYOY deal growth6 Q1’16Q4’14Avg deals per quarterAvg funding per quarterBiggest quarter( Funding)Biggest quarter(# of deals)53.4MFunding(Canadian fintech)894.0877673.31Deals(Canadian fintech)73.7655551.4549.7543.89223.702014 Q4Source: CB Insights2015 Q117.312015 Q22015 Q32015 Q42016 Q12016 Q22016 Q3COMPANYSTAGEAMOUNT RAISEDTOTAL FUNDING RECEIVEDBlockstream (blockstream.com)Series A 55M 76MLEAGUE (league.com)Series A 25M 29MeSentire (esentire.com)Series D 19.5M 40.9MBench Accounting (bench.co)Series B 16M 26.2MLendful (lendful.ca)Series A 10.66M 10.7MOverbond (overbond.com)Seed 7.5M 7.5MWave (waveapps.com)Series C - III 6.7M 47.5MLemonStand eCommerce (lemonstand.com)Seed VC 1.25M 1.26M
FIGURE 6:NORTH AMERICANFINTECHDEALFLOW, 2014Q4 TO 2016 Q3(IN US MILLIONS) 5.06bn-39.19%343-17.75%Funding in last yearYOY funding growthDeals in last yearYOY deal growth95 Q3’15Q2’15Avg deals per quarterAvg funding per quarterBiggest quarter( Funding)Biggest quarter(# of deals)1.67bn112109Funding(VC-backed fintech– North America)1112587.698Deals(VC-backed fintech– North 132.4262719.592014 Q4Source: CB Insights2015 Q12015 Q22015 Q32015 Q42016 Q12016 Q22016 Q3COMPANYSTAGEAMOUNT RAISEDTOTAL FUNDING RECEIVEDVALUATIONOscar Health Insurance Co. (hioscar.com)Series C 400M 727.5M 2.7bnClover Health (cloverhealth.com)Series C 160M 295MAffirm (affirm.com)Series C 100M 425M 700M - 800MBetterment (betterment.com)Series E 100M 205M 700MBright Health (brighthealthplan.com)Series A 80M 80MPersonal Capital (personalcapital.com)Series E 75M 182M 500MCircle Internet Financial (circle.com)Series D 60M 136M 400MDigital Asset Holdings (digitalasset.com)Series A 60M 67.1M 100M
TOP VENTURE CAPITALISTS IN FINTECH IN 2015The following list, compiled by MaRS Market Intelligence, provides an overview of the m
payment systems. With so many players contributing to the end-user experience in payments—including payment software developers, merchants, payment networks, mobile device manufacturers, mobile network operators and banks—creating a seamless mobile payment experience for customers is a co