Transcription
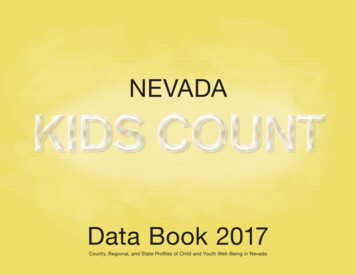
NEVADAData Book 2017County, Regional, and State Profiles of Child and Youth Well-Being in Nevada
This Data Book is dedicated to the children of Nevada.Nevada KIDS COUNT thanks the following individuals and organizations fortheir assistance in providing key information for this publication:NEVADA DEPARTMENT OF EDUCATIONGunes Kaplan, Ph.D., Education Programs Professional, Assessment, ProgramAccountability & CurriculumNEVADA DEPARTMENT OF HEALTH AND HUMAN SERVICESDoug Banghart, RN, MSPH, Health Resource Analyst, Office of AnalyticsAlexia Benshoof, Management Analyst III, Division of Child and Family Services DCFS Data TeamLeslie Bittleston, MSQA, Juvenile Justice Chief, Juvenile Justice Programs OfficeLatisha Brown, MSW, Child Care Licensing Program Manager, Health Care Qualityand Compliance, Division of Public and Behavioral HealthEsmilsen (Millie) Cady, Social Services Specialist II, Nevada Department of Healthand Human Services, Division of Welfare and Supportive ServicesStephen Dotter, Management Analyst I, Data Team, Division of Child and FamilyServicesKatie Higday, Management Analyst, State Public Charter School AuthorityPandora Lewis, Social Services Program Specialist III, Child Care and DevelopmentProgram, Division of Welfare and Supportive ServicesAmy Lucas, Health Resource Analyst, Division of Public and Behavioral Health,Office of AnalyticsDanielle Loomis, Social Services Program Specialist III, Child Support EnforcementProgram, Division of Welfare and Supportive Service*Katherine Mayhew, Clinical Program Planner III, DCFS Planning and EvaluationUnit, Division of Child and Family ServicesRobert A. Moore, MIS, Management Analyst III, Supervisor, MMIS and MedicaidAnalytics, Nevada Division of Health Care Financing and Policy, Nevada MedicaidKyra Morgan, Chief Biostatistician, Nevada Division of Public and BehavioralHealth, Office of Public Health Informatics and EpidemiologyKelly Nichols, Management Analyst III, Coordinator of Research and Statistics,Division of Welfare & Supportive ServicesJoseph Rand, Health Resource Analyst, Division of Public and Behavioral Health,Office of Public Health Informatics and EpidemiologyJon Thomas, Clinical Program Manager I, DCFS Planning and Evaluation Unit,Division of Child and Family ServicesDanika Williams, MPH, HIV Surveillance Coordinator, Nevada Division of Publicand Behavioral Health, Office of Public Health Informatics and EpidemiologyPatti Oya, Head Start State Collaboration Office, Child Care Development, Welfareand Supportive ServicesOTHER CONTRIBUTORSPatrick Gavin, Executive Director, State Public Charter School AuthorityJeff Hardcastle, Nevada State Demographer, Nevada Department of TaxationJennifer Kimball, Data Query Specialist, Washoe County School DistrictTaylor Lensch, MPH, Graduate Research Assistant, School of Community HealthSciences, University of Nevada, RenoAlejandra C. Livingston, MS, MBA, Economist III, Research, Planning, & Statistics,Nevada Department of CorrectionsDanny Peltier, Management Analyst 1, State Public Charter School AuthoritySheila A. Salehian, Deputy Treasurer for Prepaid Tuition, 529 College Savings Plans& Financial Literacy, Office of State TreasurerWei Yang, MD, PhD, Professor of Epidemiology & Biostatistics School ofCommunity Health Sciences, Director, Nevada Center for Health StatisticsInformatics, University of Nevada, Reno*A special thanks to Danielle Loomis for her super-speedy response to our data request.
Nevada KIDS COUNT Data Book 2017Prepared by the Center for Business and Economic Research (CBER)Rennae Daneshvary, PhD, CBER associate director of research and administrationStephen M. Miller, PhD, CBER directorWith contribution from Hasara Rathnasekara and Nicolas Prada, CBER graduate assistantsThis research was funded in part by the Annie E. Casey Foundation. We thank them for their supportbut acknowledge that the findings and conclusions presented in this report are those of the authorsalone and do not necessarily reflect the opinions of the Foundation.Improving children’s well-being through research and service.Permission to reproduce and disseminate information is granted provided acknowledgement is given and thesource is cited as: Nevada KIDS COUNT Data Book 2017.The views expressed are those of the authors and do not necessarily represent those of the University ofNevada, Las Vegas or the Nevada System of Higher Education.Center for Business and Economic Research, UNLV http://cber.unlv.edui
Table of ContentsOverview of KIDS COUNTNevada Demographics13Health958Millennium Scholarship62High School Dropouts65Graduation67Special Education69Nevada and the United States10Special Populations71Low-Birthweight Babies11Head Start72Infant Mortality14School Discipline74Prenatal Care16Public Health Programs19Family and CommunityHealth Insurance23Immunizations25Mental Health26AIDS29Child Deaths31Teen Deaths33Economic Well-BeingiiCollege Entrance Examinations37Nevada and the United States38Poverty39Income41Unemployment of Parents42Child Care43Child Support48Education51Nevada and the United States52Formal Education System5377Nevada and the United States78Teen Births79Foster Care83Adoption87Safety and Risky Behaviors91Child Abuse and Neglect92Children of Incarcerated Parents97Juvenile Crime99Substance Use109STDs111Sexual Behaviors116Body Weight117119AppendixNevada County Data120Notes122Acknowledgements126Center for Business and Economic Research, UNLV http://cber.unlv.edu
Overview of KIDS COUNTWHAT is KIDS COUNT?KIDS COUNT, the well-known, well-respected project of the Annie E.Casey Foundation (AECF), tracks the well-being of children at both thenational and the state levels. All 50 states have a KIDS COUNT project,allowing for state-by-state comparisons of child well-being indicators. Projectsare also located in the District of Columbia, the Virgin Islands, and theCommonwealth of Puerto Rico.WHAT is the layout of the Nevada KIDS COUNT Data Book2017?This year’s Data Book, as in past years’ books, provides indicators reflectingcritical elements of child and youth well-being. The indicators are organizedas follows: Definition:Description of what the indicator is and what it measuresIn Nevada, the KIDS COUNT project primarily: Map:Rates or percentages presented for each county collects, analyzes, and distributes the best available data measuring theeducational, social, economic, and physical well-being of children andyouth in Nevada; Nevada:Most recent state data for each indicator Counties:Most recent county data where applicable educates and informs decision-makers, citizens, service providers,providers of funding, and community partners regarding data, policy,and resource analysis; provides linkages with community efforts to reach decision-makers withinformation concerning relevant issues for children and youth.HOW were the data indicators selected?Nevada KIDS COUNT selected indicators that were: relevant substantially researched regularly measuredWHAT is the Nevada KIDS COUNT Data Book 2017?This report, the ongoing effort of the Nevada KIDS COUNT project, providesa profile of the children and youth in our state.WHAT is the Center for Business and Economic Research(CBER)?The Center for Business and Economic Research (CBER) was establishedin 1975. CBER conducts applied research vital to business and government.CBER cooperates with partners to extend the benefits of the University ofNevada, Las Vegas’ research community throughout the state of Nevadaand the country. CBER’s relationship with KIDS COUNT began in 1996,when it began providing data for the Nevada KIDS COUNT Data Book. Since2000, CBER has published the Data Book.Center for Business and Economic Research, UNLV http://cber.unlv.edu representative of selected segments of children and youth available at the county level verifiable with reliable data sourcesWHAT are the limitations of the data?Data LimitationsBecause many Nevada counties have small populations, three-year averageswere calculated to stabilize and improve the usefulness of the birth and deathdata. Nonetheless, when a county has a small number of events, we do notreport the rates. Instead, we note NM Not Meaningful in a table; and rawdata are provided as appropriate in the appendix.Overview1
Overview of KIDS COUNTOur data providers may need time to compile and disseminate accurateinformation. Therefore, current-year data were sometimes not availablewhen this report was produced. Also, the sum of the county data maynot equal the state total due to rounding and/or missing data.WHAT is new in the Data Book?This year’s book features essays on what it takes to move Nevada tothe top ten states in child well-being. Several essays were written bymembers of the Nevada KIDS COUNT Executive Committee.The suppression criteria for the birth and death data have changedsince the last KIDS COUNT Data Book. Numbers are suppressed if thenumber is less than 5 and the difference between that and the totalnumber of events is less than 20. For example, the number of teendeaths would be suppressed if there were 3 teen deaths in a populationof 21 teens. This changed from 2016, when the average three-yearrates were suppressed for counties with fewer than 12 births or deathsor the age specific population was not met. For example child deathrates were suppressed for counties with fewer than 12 child deaths oran age specific population of less than 10,000.2OverviewCenter for Business and Economic Research, UNLV http://cber.unlv.edu
Nevada DemographicsEstimated Number of Nevada Householdsby Type: 2016CategoryNumber (Estimate)HOUSEHOLDS*Total householdsAverage household size**1,055,1582.75Average family size****670,9683.42Number/PercentState population2,985,361Clark County population2,190,666Clark County population as a percent of state population282,717Washoe County population as a percent of state populationRest of state populationAdult (20 and older)Adult (20 and older) as a percent of state populationUnder 6 and 6 to 17 years20.8%Child (19 and under)6 to 17 years only59.6%Child (19 and under) as a percent of state populationHouseholds with one or more people under 18 years30.3%Households with one or more people 60 years and over38.8%Child (19 and under)*Householder living alone28.6%Child (19 and under) as a percent of state population*10.0%Child (17 and under)*0.4%7.0%*“A household includes all the people who occupy a housing unit (such as house or apartment)as their usual place of residence.”**“A measure obtained by dividing the number of people in households by the total numberof households (or householders).”***“A family, which is the householder and all (one or more) other people living in the samehousehold who are related to the householder by blood, marriage, or adoption.”****“A measure obtained by dividing the number of members of families by the total numberof families (or family householders).”From U.S. Census Bureau, Census Glossary, available online at: http://www.census.gov/glossary/, as of 10/25/17.Source: U.S. Census Bureau, American FactFinder query, S1101, Households and Families,2016 American Community Survey 1-Year Estimates, available online at: sf/pages/productview.xhtml?pid ACS 16 1YRS1101&prodType table, as of 10/25/17.Center for Business and Economic Research, UNLV ld (17 and under) as a percent of state population*Opposite sex26.5%711,636Child (17 and under) as a percent of state populationSame sex73.5%789,902Child (17 and under)UNMARRIED-PARTNER HOUSEHOLDS11.4%2,195,45919.6%65 years and over15.2%341,333Under 6 years onlySELECTED HOUSEHOLDS BY TYPE73.4%453,362Rest of state population as a percent of state populationAGE OF OWN CHILDRENHouseholds with own children under 18 yearsPopulationWashoe County populationFAMILIES***Total familiesNevada Demographic Profile: 2017 Projections24.0%*Note: Projections include institutional group quarters.*Indicates population without group quarters.Source: Nevada State Demographer: 2017 Edition of ASRHO Estimates and Projections(population projections). (ASRHO Age, Sex, Race, and Hispanic Origin), 10/24/17.Nevada Demographics3
Nevada DemographicsRace/Ethnicity of Children and Youth in Nevada byAge: 2017 Projections with Group QuartersLess than 18Years of AgeLess than 20Years of AgeProjected Change in the Number of Children and Youth Lessthan 18 Years of Age in Nevada by Race/Ethnicity:2017 to 2022 ProjectionsNumberPercentNumberPercentRacial/Ethnic Group20172022Percent ChangeAfrican American*71,50010.079,24810.0African American*71,50077,0677.8Asian and Pacific Islander*64,0369.070,9559.0Asian and Pacific Islander*64,03667,1514.9American Indian, Eskimo,and Aleut*7,7341.18,5831.1American Indian, Eskimo, and ite*280,701276,628-1.5Hispanic (all races)287,66540.4319,30740.4Hispanic (all 00.0TOTAL**711,636721,5451.4Race/EthnicityNote: Projections include institutional group quarters.*Not of Hispanic origin.**The sum of the races may not equal the total due to rounding.Source: Nevada State Demographer: 2017 Edition of ASRHO Estimates and Projections(population projections). (ASRHO Age, Sex, Race, and Hispanic Origin), 10/26/17.Note: Projections include institutional group quarters.*Not of Hispanic origin.**The sum of the races may not equal the total due to rounding.Source: Nevada State Demographer: 2017 Edition of ASRHO Estimates and Projections populationprojections). (ASRHO Age, Sex, Race, and Hispanic Origin), 10/31/17.Race/Ethnicity of Children and Youth in Nevada byAge: 2017 Projections without Group QuartersLess than 18Years of AgeRace/EthnicityLess than 20Years of AgeNumberPercentNumberPercentAfrican American*71,33310.078,94210.0Asian and Pacific Islander*64,0299.070,9439.0American Indian, Eskimo,and ic (all ,146100.0White*Note: Projections exclude institutional group quarters.*Not of Hispanic origin.**The sum of the races may not equal the total due to rounding.Source: Nevada State Demographer: 2017 Edition of ASRHO Estimates and Projections(population projections). (ASRHO Age, Sex, Race, and Hispanic Origin), 10/26/17.4Nevada DemographicsCenter for Business and Economic Research, UNLV http://cber.unlv.edu
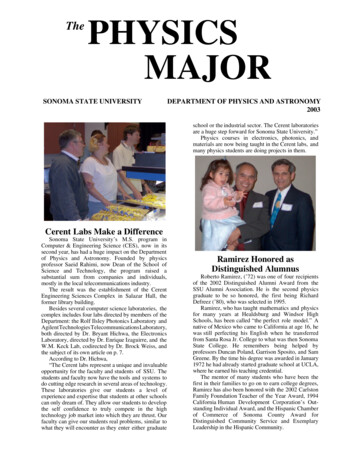
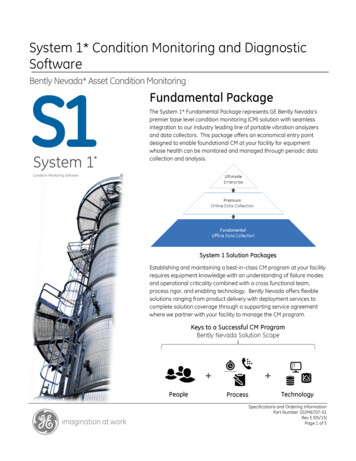
Nevada DemographicsPercent of Children and Youth Ages 19 andunder in Nevada by Age: 2017 23.323.022.021.00-4 years5-9 yearsAge10-14 years15-19 yearsNotes: Projections include institutional group quarters.The sum of the races may not equal the total due to rounding.Source: Nevada State Demographer: 2017 Edition of ASRHO Estimates and Projections(population projections). (ASRHO Age, Sex, Race, and Hispanic Origin), 10/26/17.Projected Change in the Number of Children andYouth in Nevada by Age: 2017 to 2022 ProjectionsAge Group20172022Percent Change0-4 years184,055196,0136.55-9 years196,374190,314-3.110-14 years211,666200,376-5.315-19 : Projections include institutional group quarters.*The sum of the age groups may not equal the total due to rounding.Source: Nevada State Demographer: 2017 Edition of ASRHO Estimates and Projections(population projections). (ASRHO Age, Sex, Race, and Hispanic Origin), 10/31/17.Center for Business and Economic Research, UNLV http://cber.unlv.eduNevada Demographics5
Nevada DemographicsAge Distribution of Nevadans by County: 2017 ProjectionsLess than4 Years ofAgeLess than5 Years ofAge5-17*Years ofAge5-19*Years ofAgeCarson -44Years ofAge20-44Years ofAge45-64Years ofAgePercentLess than18 Years ofAgePercentLess than20 Years ofAge10,67622.123.855,5333,86923.426.825,561Over 64Years lNyePershingStoreyWashoeWhite PineTOTAL**Note: Projections include institutional group quarters.*Two age ranges of data are provided because some of the child well-being indicators reflect children and youth through age 17 and other indicators through age 19.**The sum of the ages may not equal the total due to rounding.Source: Nevada State Demographer: 2017 Edition of ASRHO Estimates and Projections (population projections). (ASRHO Age, Sex, Race, and Hispanic Origin), 10/31/17.6Nevada DemographicsCenter for Business and Economic Research, UNLV http://cber.unlv.edu
Nevada DemographicsAge and Racial/Ethnic Distribution of Nevada Children and Youth by County: 2017 ProjectionsAfrican AmericanCountyCarson CityChurchillClarkLess than18 Yearsof AgeLess than 20Yearsof AgeAsian andPacific IslanderAmerican Indian*Less than18 Yearsof AgeLess than20 Yearsof AgeLess than18 Yearsof AgeWhiteLess than20 Yearsof AgeLess than18 Yearsof AgeHispanic (All races)Less than20 Yearsof AgeTotalLess than18 Yearsof AgeLess than20 Yearsof AgeLess than18 Yearsof AgeLess than20 Yearsof eWhite 87,665319,307711,636789,902Notes: Projections include institutional group quarters.All racial groups are not of Hispanic origin.*Eskimo and Aleut.**The sum of the races may not equal the total due to rounding.Source: Nevada State Demographer: 2017 Edition of ASRHO Estimates and Projections (population projections). (ASRHO Age, Sex, Race, and Hispanic Origin), 10/31/17.Center for Business and Economic Research, UNLV http://cber.unlv.eduNevada Demographics7
Nevada DemographicsRacial/Ethnic Distribution of Nevadans (All Ages) by County: 2017 an andPacific IslanderWhiteHispanic(All races)TotalPercentCarson 283804,4391,4076,6690.21256573,8362454
Latisha Brown, MSW, Child Care Licensing Program Manager, Health Care Quality and Compliance, Division of Public and Behavioral Health Esmilsen . CBER cooperates with partners to extend the benefits of the University of Nevada, Las Vegas’ research community throughout the state of Nevada