Transcription
The Nevada KIDS COUNT Data Book: 2003 is funded by The Annie E. Casey Foundation.Nevada KIDS COUNT Data Book: 2003Prepared by The Center for Business and Economic Research (CBER)Rennae Daneshvary, PhD, Assistant Director, Interim Nevada KIDS COUNT Project CoordinatorR. Keith Schwer, PhD, Director, Nevada KIDS COUNT Executive DirectorWilliam Cope, MS, Graduate AssistantFreda Klein, EdD, Data Book Project AssistantRobert Potts, MBA, Assistant DirectorIn collaboration with Nevada KIDS COUNT PartnersNevada KIDS COUNT Advisory CouncilNevada Title IV-D, Family Preservation and Family Support Steering CommitteeUniversity of Nevada Cooperative ExtensionNevada KIDS COUNT is a project of the Center for Business and Economic Research, University of Nevada Las Vegas.Improving children’s well-being through research and service. Copyright 2003Permission to reproduce and disseminate information is granted provided acknowledgment is given and the source is cited as: Nevada KIDS COUNT Data Book: 2003.v4505 Maryland Parkway, Las Vegas, NV 89154-6002 vTelephone: (702) 895-3191 vFax: (702) 895-3606 vkids@unlv.edu vhttp://kidscount.unlv.eduNevada KIDS COUNTCenter for Business and Economic Research, University of Nevada Las Vegashttp://kidscount.unlv.edu1
This Data Book is dedicated to the children of Nevada.Nevada KIDS COUNT thanks the following individuals and organizations for their assistance in providingkey information for this publication:Nevada Department of EducationMarianne Carr, Health Education Consultant, Health and Safety TeamTammy Rhiner, Child Support Assistant II, Child SupportEnforcement Program, Welfare DivisionCarol Crothers, Evaluation Consultant, Assessments, Curricula, andInstructional SupportLisa Roberts, Child Care Surveyor, Divison of Child and FamilyServices, Bureau of Services for Child CareOrval K. Nutting, EdD, Evaluation Consultant, Finance andAccountabilityJoan Robertson, Provider Relations Coordinator, Nevada Check UpTerry Marie Owens, PhD, Evaluation Consultant, Finance andAccountabilityDavid Smith, Evaluation Consultant, Assessment ProgramAccountability, and CurriculumNevada Department of Human ResourcesGerald J. Allen, Chief, Child Care and Development, Welfare DivisionElizabeth Breshears, MEd, MSW, LCSW, Family Programs Officer,Division of Child and Family ServicesGeorge B. Flamer, PhD, Coordinator of Rural Clinics CommunityHealth Centers, Division of Mental Health and DevelopmentalServicesWendy Lay, Clinical Planner, Division of Child and Family Services,Program Evaluation and Data UnitDeborah McBride, Immunizations Analyst, Health Division, Bureauof Community HealthTim Pollard, Health Resource Analyst, Health Division, Bureau ofHealth Planning and Statistics, Center for Health Data and ResearchSherry Torgerson, Health Division, Bureau of Community HealthWei Yang, PhD, State Biostatistician and Director, Health Division,Bureau of Health Planning and Statistics, Center for Health Dataand ResearchL.M. Zdanowicz, Health Division, Bureau of Community HealthOther ContributorsEva L. Essa, PhD, Professor, Department of Human Developmentand Family Studies, UNRKaty E. Hanson, Resource Center Assistant, Nevada Network AgainstDomestic ViolenceJeff Hardcastle, Nevada State DemographerTenna Herman, Uniform Crime Reporting, Program Supervisor,Records and Identification BureauSue Meuschke, Director, Nevada Network Against Domestic ViolenceSusan Moore, EdD, Millennium Scholarship Program Director,Nevada Treasurer’s OfficeKim Stalling, Program Officer, Juvenile Justice Program OfficeBob Reardon, Statistician II, Research & Statistics, Welfare Division2Nevada KIDS COUNTCenter for Business and Economic Research, University of Nevada Las Vegashttp://kidscount.unlv.edu
Table of ContentsOverview of KIDS COUNT4Child and Youth Safety/WelfareNevada Demographics7Infant MortalityChild DeathsTeen Violent DeathsChild Abuse and NeglectChildren and Domestic ViolenceChildren in Substitute CareHealth Conditions and Health CareLow-Birthweight BabiesTeen BirthsBirths to Mothers Lacking Adequate Prenatal CarePublic-Health ProgramsHealth IssuesEconomic Well-BeingChildren in PovertyFamilies with Children Headed by a Single ParentChildren Who Live in a Family Where No Parent IsEmployed in the Labor MarketChild CareChild SupportEducation and AchievementCharacteristics of the Formal Education System inNevadaHomeschoolingTesting, Proficiency, and College-Entrance EffortsHigh School Dropout and Graduation InformationTransiencyTeens Not in School and Not WorkingProfile of Children and Youth Enrolled in SpecialEducationNevada KIDS COUNTCenter for Business and Economic Research, University of Nevada Las 3538Juvenile JusticeJuvenile Violent CrimeAppendixCounty Data: 8606567697073747879848639404344475152533
Overview of KIDS COUNTWHAT is KIDS COUNT?v Nevada: Most recent state data for each indicator;KIDS COUNT is a well-known, well-respected project of The Anniev Counties: Most recent county data where applicable;E. Casey Foundation. Its purpose is to track the well-being of childrenat both the national and the state levels. All 50 states have a KIDSv Significant Factors: Summaries of current research;COUNT project, allowing for state-by-state comparisons of childwell-being indicators.In Nevada, the primary activities of the KIDS COUNT project areto:v collect, analyze, and distribute the best available data measuringthe educational, social, economic, and physical well-being ofchildren and youth in Nevada;v educate and inform decision-makers,citizens, serviceproviders, providers of funding, and community partnersregarding data, policy, and resource analysis;v provide linkages with community efforts to reach decision-makersv Definition: A description of what the indicator is and what itmeasures;v Map: Rates, percentages, and/or numbers presented for eachcounty.WHAT are the additions to the Nevada KIDS COUNTData Book: 2003?New in the Health Conditions and Health-Care section are healthinsurance coverage data from a CBER survey. Alcohol, tobacco, anddrug-use data from the Youth Risk Behavior Surveys (YRBS) add tothe section, as well as data on HIV/AIDS and STDs. Often-requesteddata on mental health are also presented.with information concerning relevant issues for children and youth.Primary data on child care, obtained from two university surveys,WHAT is the Nevada KIDS COUNT Data Book: 2003?This report represents the ongoing effort of the Nevada KIDSCOUNT project to provide a profile of the children and youth in ourstate.WHAT is the layout of the Nevada KIDS COUNT DataBook: 2003?This year’s Data Book is similar to past years’ books. We provideindicators reflecting critical elements of child and youth well-being.The indicators are organized as follows:4are reported in the section on Economic Well-Being. Data on childrenin single-parent families, children living in families where no parentis in the labor force, and housing costs are also featured.Education, always an important indicator for Nevada, again receivesspecial attention. New are High School Proficiency Examination(HSPE), TerraNova, and SAT and ACT data by county and teens notin school and not working data from the 2000 Census.The Juvenile Violent Crime section features data on referrals ofchildren and youth into the Nevada juvenile justice system.Nevada KIDS COUNTCenter for Business and Economic Research, University of Nevada Las Vegashttp://kidscount.unlv.edu
Overview of KIDS COUNT ContinuedHOW were the data indicators selected?In recent years, Nevada KIDS COUNT added additional indicatorsNevada KIDS COUNT collects data on 10 indicators identified bybased on recommendations by Data Book users. Practicalconsiderations guided the selection process of the additionalThe Annie E. Casey Foundation. The Foundation believes: (1) “Theyreflect a wide range of factors affecting the well-being of children(such as health, adequacy of income, and educational attainment).(2) They reflect experiences across a range of developmental stages—from birth through early adulthood. (3) They permit legitimatecomparisons because they are consistent across states and over time.”1The 10 indicators are:v percent low- birthweight babiesv infant mortality ratev child death ratev rate of teen deaths by accident, homicide, and suicidev teen birth ratev percent of teens who are high school dropoutsv percent of teens not attending school and not workingv percent of children living in families where no parent has fulltime, year- round employmentv percent of children in povertyv percent of families with children headed by a single parent.indicators, including whether the individual indicators were:v relevantv substantially researchedv regularly measuredv representative of selected segments of children and youthv available at the county levelv verifiable with reliable data sources.Additionally, Nevada KIDS COUNT hosted conferences in LasVegas, Elko, and Winnemucca on the status of Nevada’s children.The main event was unveiling the Nevada KIDS Count Data Book:2002, followed by presentations on issues related to children’s wellbeing and feedback discussion sessions on the Data Book. The KIDSCOUNT Advisory Council and friends of KIDS COUNT, in an effortto improve the well-being of children, met for general discussion ondata and how data influence programs. The discussion was organizedinto working groups. Each group identified major issues, priorityareas, and new topics to consider for next year’s book.Fernando Serrano, a member of the Advisory Council, wasinstrumental in organizing the meetings in northern Nevada. KIDSCOUNT also thanks the following individuals for their presentationon children’s issues during the meetings: Assemblyman JohnCarpenter; Dr. Robert McCord, Director for Education, PolicyStudies, Department of Educational Leadership, UNLV; Richard A.Wagner, Sixth Judicial District Court Judge; and Garth Winckler,President, Garth Winckler and Associates.Nevada KIDS COUNTCenter for Business and Economic Research, University of Nevada Las Vegashttp://kidscount.unlv.edu5
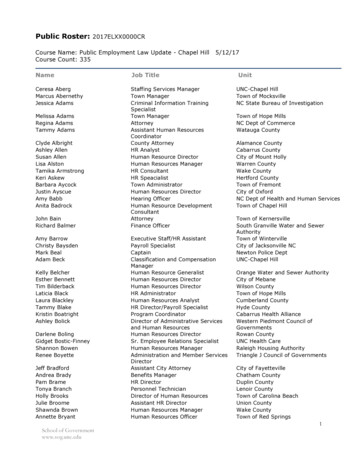
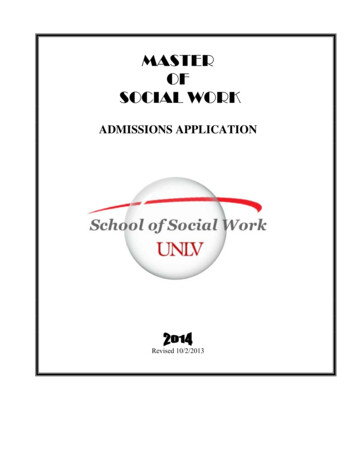
Overview of KIDS COUNT ContinuedWHAT are the limitations of the data?The atypical population distribution in Nevada counties with veryComparison of Child Well-Being Indicators inNevada: 2002 and 2003 Data BooksNevada 2002 Nevada 20032002 Nat i onalCompari sonD at a B o o k D a t a B o o kDat a BookRat e orRat e orNoNat i onal Rat e orPercentPercentPercent *Improved Changesmall populations may create a serious “rare event” problem.Multiple-year averages stabilize and improve the usefulness of theseIndi cat ordata. Still, even when averaged, caution should be used when drawingconclusions from rates or percentages based on small numbers.Pe rce nt lowbirthwe ight babie s7.5%(1998-00)7.5%(1999-01)Infant mortality rate6.7(1998-00)6.2(1999-01)X7.1(1999)Child de ath rate24.0(1998-00)23.0(1999-01)X24(1999)Births to mothe rslacking ade quatepre natal care25.6%(2000)24.4%(2001)XNAChildre n in pove rty15.0%(1998)13.5%(1999)X19.0%(1998-00)Because rates based on small denominators are likely to bestatistically unreliable, rates were not calculated for counties withsmall denominators. The designation, NM Not Meaningful, is notedin the maps; and, raw data are provided as applicable in the CountyData section. Also, the sum of the county data may not equal thestate total due to rounding and/or missing county-reference data.X7.6%(1999)Many of our data providers need time to compile and disseminateaccurate information. Therefore, current-year data were sometimesTe e n birth rate35.7(1998-00)33.2(1999-01)X29(1999)not available when this report was produced.Te e n viole nt de athrate64.5(1998-00)51.3(1999-01)X53(1999)Dropout rate6.1%(1999-00)5.0%(2000-01)X10.0%(1998-00)Juve nile viole nt crimearre s t rate273.8(1998-00)258.9(1999-01)XNAThis year’s Data Book and last year’s are easily accessed on-line at:http://kidscount.unlv.eduWhere did Nevada improve?Columns two and three in the adjacent table show that over the pastyear Nevada improved on eight indicators. The most-improvedindicators were the Teen Violent Death Rate and the Juvenile Violent*Measures used to calculate the national rates or percentages may differ from those used incalculating the state’s.Source: Nevada KIDS COUNT Data Book: 2002, CBER, UNLV; KIDS COUNT Data Book:2002, The Annie E. Casey Foundation, 2002.Crime Arrest Rate.6Nevada KIDS COUNTCenter for Business and Economic Research, University of Nevada Las Vegashttp://kidscount.unlv.edu
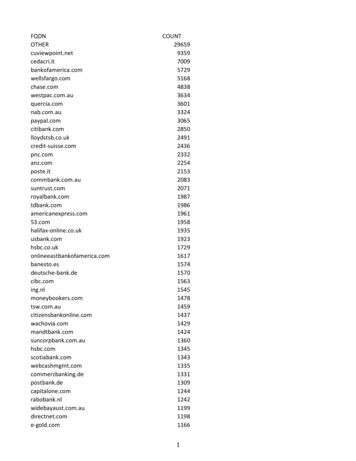
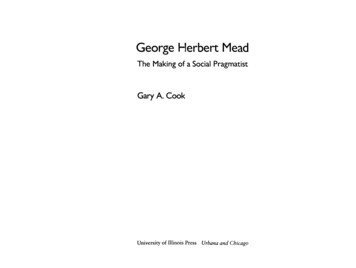
Nevada DemographicsNevada Demographic Profile: 2001P o p u l at i o nNumber/PercentState population2,127,117Clark County population1,485,855Clark County populationas a pe rce nt of s tate populationPercentage of Children and Youthin Nevada by Age: 200115-19 years24.3%25.7% 0-4 years69.9%Was hoe County population50.0% 5-14 years353,271Source: Nevada State Demographer, estimates as of January 2003.Was hoe County population as ape rce nt of s tate population16.6%Re s t of s tate population287,991Re s t of s tate populationas a pe rce nt of s tate population13.5%Adult (20 and olde r) population1,532,229Adult (20 and olde r) population as ape rce nt of s tate population72.0%Child (19 and unde r) populationChild (19 and unde r) population as ape rce nt of s tate populationProjected Demographic Change ofChildren and Youth in Nevadaby Age: 2001-2005A g e G ro u p s20012005P ercentChange0 -4 y e a rs o ld153,003176,85715.65 -1 4 y e a rs o ld297,046333,29712.21 5 -1 9 y e a rs o ld144,838167,14015.4A LL C H I LD R EN594,888677,29413.9594,88828.0%Source: Nevada State Demographer, estimates as of January 2003.Source: Nevada State Demographer, estimates as of January 2003.Nevada KIDS COUNTCenter for Business and Economic Research, University of Nevada Las Vegashttp://kidscount.unlv.eduNevada Demographics7
Nevada Demographics ContinuedNevada Households by Type: 2000Demographics of Children and Youthin Nevada by Race/Ethnicity: 2001Less Than 18 Less Than 18 Less Than 20 Less Than 20Years of Age Years of Age Years of Age Years of AgeNumberPercentNumberPercentRace/Et hni ci t yWhite293,67154.8326,76555.0His panic(all race s )159,39129.7175,73129.5Black (African Ame rican)46,9218.751,6478.7As ian and Pacific Is lande ,888100.0Native Ame ricanALL CHILDRENNote: The racial/ethnic categories were provided by the state demographer.Source: Nevada State Demographer, estimates as of January 2003.Cat egoryN umberFamily hous e holds502,508With own childre nunde r 18 ye arsM arrie d-couple family245,234380,469With own childre nunde r 18 ye ars172,858Fe male hous e holde r,no hus band pre s e nt80,819With own childre nunde r 18 ye ars49,763M ale hous e holde r;no wife pre s e nt41,220With own childre nunde r 18 ye ars22,613N onfamily hous e holds249,469TOTAL HOUSEHOLD S751,977AVER AGE HOUSEHOLD SIZE*2.62AVER AGE FAM ILY SIZE*3.14*U.S. Census Bureau, Summary File 1, (Table DP-1), 2000.Note: “A household includes all the persons who occupy a family unit.”“A family consists of a householder and one of more other personsliving in the same household who are related to the householder bybirth, marriage, or adoption.” U.S. Census Bureau, Summary Tape File3, Technical Documentation, Appendix B. Definitions of SubjectCharacteristics, available online at: http://www.census.gov/td/append b.html#HOUSEHOLD as of February 27, 2003.Source: U.S. Census Bureau, 2000 Census of Population and Housing,Nevada State Data Center Primary Profile, Summary File 3, (TablesP15, P13).8Nevada DemographicsNevada KIDS COUNTCenter for Business and Economic Research, University of Nevada Las Vegashttp://kidscount.unlv.edu
Nevada Demographics ContinuedAge Distribution of Children and Youth in Nevada by County: 2001CountyCarson CityChurchill CountyClark CountyDouglas CountyElko CountyEsmeralda CountyEureka CountyHumboldt CountyLander CountyLincoln CountyLyon CountyMineral CountyNye CountyPershing CountyStorey CountyWashoe CountyWhite Pine CountyNEVADA**Less Than 5Years of 2721,8063719723,871524153,0035-17*Years of 6,6568885,7181,19456059,4291,410383,5135-19*Years of 87,6269936,6531,41063068,3621,552441,88418-44Years of 20-44Years of 5-64Years of 579,7701,3009,6441,2661,39087,7292,012495,90865 Years ofAge and 4541,0007,10360051738,1521,416236,507Less Than 18Years of 23.924.521.928.617.723.625.625.2Less Than 20Years of 294,74334,3845,4703,714353,2717,5492,127,117* Two age ranges of data are provided since some of the child well-being indicators reflect children and youth through age 17, and others through age 19.** The sum of the counties may not equal the state total due to missing or incomplete county-reference data.Source: Nevada State Demographer, estimates as of January 2003.Nevada KIDS COUNTCenter for Business and Economic Research, University of Nevada Las Vegashttp://kidscount.unlv.eduNevada Demographics9
Nevada Demographics ContinuedAge and Racial/Ethnic Distribution of Nevada Children and Youth by County: 2001CountyCarson CityChurchill CountyClark CountyDouglas CountyElko CountyEsmeralda CountyEureka CountyHumboldt CountyLander CountyLincoln CountyLyon CountyMineral CountyNye CountyPershing CountyStorey CountyWashoe CountyWhite Pine CountyNEVADA**Age 18 4459,7651,4981,601293,671326,765Age 18 20Hispanic3,0213,2959111,012124,188 194270295159,391 175,731Age 18Age 40073876067115129910002,3562,597172046,92251,647 18 6702788891110712687434,1524,626303228,36231,635Age 18 20Native 01288,1689,109Age 18 20Total12,76414,0687,1737,943380,549 1,5651,78165772783,30092,2331,9342,076536,516 594,888*African American.** The sum of the counties may not equal the state total due to rounding.Source: Nevada State Demographer, estimates as of January 2003.10Nevada DemographicsNevada KIDS COUNTCenter for Business and Economic Research, University of Nevada Las Vegashttp://kidscount.unlv.edu
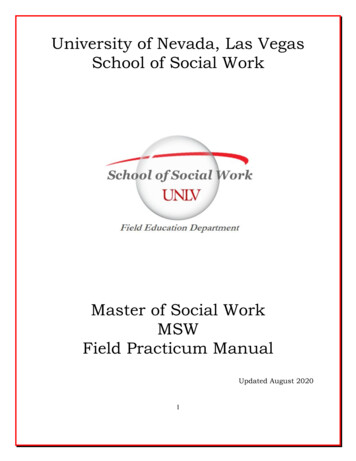
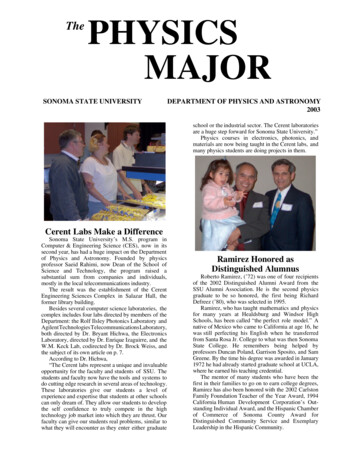
Low-Birthweight BabiesNevadaDefinitionBetween 1999 and 2001, the Percent of Low-Birthweight Babies inNevada was 7.5. Of the 90,269 babies born during this period, 6,737Low-Birthweight Babies are those weighing less than 2,500 grams(about 5.5 pounds) at birth. Low-birthweight data, reported bymother’s county of residence rather than infant’s place of birth,measure the percentage of live births in which babies weigh lessthan 2,500 grams.weighed less than 5.5 pounds.CountiesAmong the 17 counties in Nevada, the Percent of Low-BirthweightPercent of Low-Birthweight Babies: 1999-2001percentage of low-birthweight babies that was higher than the staterate of 7.5.StoreyCarson City6.5%Pershing7.3%7.7 percent in 2001. The increase is attributed partly to the increasein the rate of multiple births.27.
Elizabeth Breshears, MEd, MSW, LCSW, Family Programs Officer, Division of Child and Family Services George B. Flamer, PhD, Coordinator of Rural Clinics Community . Program Officer, Juvenile Justice Program Office. Nevada KIDS COUNT . University