Transcription
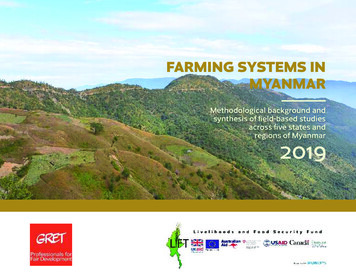
FARMING SYSTEMS INMYANMARMethodological background andsynthesis of field-based studiesacross five states andregions of Myanmar2019
Farming systems analysis in Myanmar:Methodological background, selected casestudies and synthesis of field-based studiesacross 5 states and regions of MyanmarPublished by: LIFT, 2019Coordinated by: Celine AllaverdianIntroduction, Chapters 1 and 5 andannexes written by Celine Allaverdian andJean-Christophe DiepartChapters 2 to 4: summaries compiled by CelineAllaverdian, based on the Farming systemsanalysis reports written by Clarisse Frissard,Alyssa Pritts, Simon Ayvayan, Jose Garcia, MyaDarli Thant, Fue Yang, Yi-Jen Lu.DisclaimerThis document is produced with financialassistance from Australia, Canada, the EuropeanUnion, Ireland, Switzerland, the United Kingdomand the United States of America. The viewsexpressed herein should not be taken to reflectthe official opinion of the LIFT donors.Acknowledgements to LIFT donorsWe thank the governments of Australia, Canada,the European Union, Ireland, Switzerland,the United Kingdom and the United States ofAmerica for their kind contributions to improvingthe livelihoods and food security of rural poorpeople in Myanmar. Their support to theLivelihoods and Food Security Fund (LIFT) isgratefully acknowledged.Cover Page Photo By: GRETThis work is licensed under a Creative CommonsAttribution-NonCommercial-ShareAlike 4.0International License
AbstractThe study draws on the farming systemsanalysis initiative conducted in 2017 and 2018across 5 States and Regions of Myanmar,by young scholars and junior researchers.It introduces the Farming Systems Analysisapproach and its relevance to better understandfarmers’ decisions and practices. Three selectedcase studies from Kayin and Chin states andCentral Dry zone provide a historic and holisticreflection of the evolution of farming systemsin these contrasting agro-ecological zones. Asynthesis reflecting on the findings of the 6farming systems analysis studies sheds lighton the key differences and common pointsof agrarian dynamics and the rapid ruraltransformations taking place across the 5States and Regions. In short, although there aremuch variations within the country in terms ofcropping and livestock rearing systems, landholding size and farm incomes, farmers face verysimilar constraints in terms of labour shortagesand they adapt similar off-farm diversificationstrategies. Conflicts and inappropriateagricultural policies of the last decades havelikewise affected rural households throughoutthe country. China appears to play a major rolein shaping agricultural markets and value chains.Finally, Kachin, Kayin and Chin uplands areundergoing agrarian transitions from subsistencebased shifting cultivation systems to cash cropbased permanent cultivation systems withcommon impacts on food self-sufficiency, landuse and land tenure patterns.Presentation of the Farming Systems Analysis ApproachI
Table of ContentsTable of contents .IIUnits and measures.VIAcronyms and abbreviations.VIIntroduction.11.Background to this publication.22.What is the Farming Systems Analysis (FSA) approach.33.Details of the Farming Systems Analysis studies conducted.34.Contents of this publication.4The Farming Systems Analysis Approach.71.Core principles of Farming Systems Analysis.82.Key concepts.93.The approach in a nutshell.12I. Selective Case Study One: The evolution of Farming Systems and diet in Hakha township, Chin State, Myamar.171.Overall assessment of the study.182.Landscape attributes. 183.Historical analysis.204.Current cropping systems.265.Current animal husbandry systems.276.Typology of current farmi ng systems “archetypes”.297.Conclusions.30II. Selective Case Study Two: The Spice Boom and Upland Farming Systems - Thaundanggyi township, Kayin State.33II1.Overall assessment of the study.342.Background.343.History of Leik Tho: From subsistence to cash crops in spite of conflict.384.Dominant cropping systems.42Presentation of the Farming Systems Analysis Approach
5.Analysis of farming systems.476.Conclusion.50III. Selective Case Study Three: Access to Water and Dry Zone Farming Systems - Myinmu township, Sagaing Region.511.Overall assessment of the study.522.Landscape analysis.523.Historical background.554.Cropping systems and dynamics in Myinmu.575.Animal management systems .606.Off farm activities.607.Farming system typology.618.Conclusions of Myinmu Farming Systems Analysis.66IV. Overall Conclusions and Key Cross-Cutting Findings.691.Comparison between regions.702.Agricultural policies.713.Armed conflicts.724.Farm labour shortages.725.Migration.726.Off farm income as a crucial part of local livelihoods.737.Agricultural markets and the influence of China.738.Upland agricultural transition.73Annexes.75Annex 1: Reflections of Users on the FSA Approach.761.How useful is the Farming Systems Analysis approach for development?.762.Limitations and challenges for future use of the approach.78Annex 2: Feedback from the FSA researchers.81References.83Presentation of the Farming Systems Analysis ApproachIII
List of TablesTable 1: List of farming analysis studies conducted under this initiative.4Table 2: Key archetypes of the current farming systems in Hakha towship, Chin state.29Table 3: Farm income of key farming systems Leik Tho.49List of FiguresFigure 1: Location of the six farming systems analysis study sites.5Figure 2: Hierarchy of systemic concepts used in farming systems analysis.9Figure 3: Representation of an agrarian system.9Figure 4: Representation of a farming system.10Figure 5: Activity system.11Figure 6: Phases and steps in the farming systems analysis approach.12Figure 7: Mean monthly maximum and minimum temperature and rainfall in Hakha Township.18Figure 8: A satellite view of crop and livestock production halos surrounding Bualtak village, Chin State.19Figure 9: Irrigation system of a set of paddy terraces in Northern Chin.19Figure 10: Northern Chin landscape. Forefront: First halo that incorporates paddy terraces and permanent fields. Background:Second halo with forests and shifting cultivation lopil.20Figure 11: Structure of Hakha society in pre-colonial times.21Figure 12: Seasonal calendar of the shifting cultivation system (in lai lo warm plot).21Figure 13: Changed crop rotations on lai lo plots associated with the introduction of upland paddy under British colonial rule in Northern Chin.22Figure 14: Spatial organization of livestock management systems (a) pre-1960’s and (b) post-1960s in Northern Chin.24Figure 15: Work calendar of a shifting cultivation cropping system currently practiced in Hakha Township, Chin State.26Figure 16: Smallholder livestock management calendar from 1988 – 2014 in Hakha Township, Chin State.28Figure 17: Location of the study area in Kayin State.34Figure 18: Map showing the two zones in which the study was undertaken with Zone A being in close proximity to Leik Tho and Zone B further east.35Figure 19: Annual rainfall and temperature in Taungoo.36Figure 20: Transect of a typical village land use in Leik Tho from July to September.37Figure 21: Village organization and the taung yar shifting system that was in place until the 1970s.38Figure 22: Schematic of the evolution of farming systems over time in the Leik Tho region.42Figure 23: Cropping calendar for taung yar and the estimated labour demand for activities (i.e. working days (WD)).43IVPresentation of the Farming Systems Analysis Approach
Figure 24: Cardamom cropping calendar and the estimated labour demand for each activity (i.e. working days (WD)).44Figure 25: Turmeric cropping calendar and the estimated labour demand for activities (i.e. working days (WD)).44Figure 26: Monsoon paddy rice cropping calendar and the estimated labour demand for activities (i.e. working days (WD)).45Figure 27: Land productivity and work productivity of key cropping systems.46Figure 28: Land use for FS1 Subsistence-oriented small farmers (in acres).47Figure 29: Land use of FS2 - small farmers with commercial crops (in acres).48Figure 30: Land use for medium sized farmers (in acres) (FS3 and FS4).48Figure 31: Land use associated with large commercial cardamom based farmers (in acres) (FS 5).49Figure 32: Average rainfall (mm) and temperature ( C) for Myinmu Township from 1980-2010.52Figure 33: Schematic of the four agro-ecological zones identified along with their land use in Myinmu.53Figure 34: Irrigation classification under Pyawt Ywar Pump irrigation scheme.54Figure 35: The current cropping systems and calendar in Myinmu Township.58Figure 36: Production costs associated with the different cropping systems in Myinmu Township.59Figure 37: Land productivity - measured by gross value added (GVA)/ha - of cropping systems in Myinmu Township.59Figure 38: Labour productivity - measured by gross value added (GVA)/workday - of cropping systems in Myinmu Township.59Figure 39: Economic indicators of animal rearing systems in Myinmu Township.60Figure 40: Estimate contribution of on-farm, non-farm, and off-farm activities to overall household income for Type A farming systems.61Figure 41: Estimate contribution of on-farm, non-farm, and off-farm activities to overall household income for Type B farming systems.61Figure 42: Estimate contribution of on-farm, non-farm, and off-farm activities to overall household income for Type C farming systems.62Figure 43: Estimate contribution of on-farm, non-farm, and off-farm activities to overall household income for Type D farming systems.62Figure 44: Estimate contribution of on-farm, non-farm, and off-farm activities to overall household income for Type E farming systems.63Figure 45: Estimate contribution of on-farm, non-farm, and off-farm activities to overall household income for Type F farming systems.63Figure 46: Estimate contribution of on-farm, non-farm, and off-farm activities to overall household income for Type G farming systems.64Figure 47: Estimate contribution of on-farm, non-farm, and off-farm activities to overall household income for Type H farming systems.64Figure 48: Estimate contribution of on-farm, non-farm, and off-farm activities to overall household income for Type I farming systems.65Figure 49: Estimate contribution of on-farm, non-farm, and off-farm activities to overall household income for Type J farming systems.65Figure 50: Minimum and maximum range of farm-holding size as observed in the six FSA studies.70Figure 51: Minimum and maximum farm income as observed across the six FSA studies.70Presentation of the Farming Systems Analysis ApproachV
Acronyms andAbbreviationsUnits andMeasuresAreaUnitHectare (ha)1 Acre (ac)0.4046Volumes and Weights: Standardizedmeasurements in MyanmarGovernment Basket(GB)Kilogram (kg)1 basket of Paddy20.861*1 Government Basket (GB) 16 pyi 128 condensedmilk cans (128 x 11.25 fluid ounces 9 empirical gallons)CommodityPounds(lbs)Kilograms(kg)1 basket Sesame grain5424.551 basketMaize grain5525.001 basketPaddy4620.91Unitskg1 GB20.861 kg10.6121 Vis1.6331CDN Consortium of Dutch NGOsCS Cropping systemDGWR Department of Ground WaterResourceVTA Village Track AdministratorWBG Winter Black GramWC Winter Chick peaFAO Food and Agriculture Organization ofWD Working daythe United NationsFS Farming SystemFSA Farming Systems AnalysisGRET Professionals for Fair DevelopmentGVA Gross Value AddedHa HectareIC Intermediate CostIDP Internally displaced personsInstituteKNU Karen National UnionLIFT Livelihoods and Food Security FundMADB Myanmar Agricultural DevelopmentBankVisMIID Myanmar Institute for IntegratedDevelopmentMMK Myanmar Kyat currencyNGO Non-Governmental OrganizationPP Pigeon PeaVIUSD United States DollarDOA Department of AgricultureIWMI International Water Management(Source: Bernot, 1974)TMT TomatoPP G Pigeon Pea GroundnutPresentation of the Farming Systems Analysis ApproachWG Winter GroundnutWGG Winter Green GramWHH WelthungerhilfeWS Winter SesameWW Winter Wheat
Introduction1. Background to the publication2. What is the farming systems analysis (FSA) approach?3. Details of the farming systems analysisstudies conducted4. Contents of this publicationPresentation of the Farming Systems Analysis Approach1
Introduction1. Background to this publicationSince 2010, LIFT has supported a variety ofimplementing partners engaged in the agriculturalsector in Myanmar. Initially LIFT’s activities wereconfined to the Ayeyarwaddy delta and withtime expanded to include the Dry Zone and theUplands and represent all the key agro-ecologicalzones of the country. LIFT partners havedeveloped a range of approaches to supportfarmers, either directly with extension trainingor through services along the value chains in thesupply or access to finance, seeds, and otherinputs along with improving market access. Thesepartners have worked closely with farmers andhave gained insights into their practices and thechallenges they face. This invaluable knowledgehas not been systematically documented, oftenremaining within small techni
people in Myanmar. Their support to the Livelihoods and Food Security Fund (LIFT) is gratefully acknowledged. Farming systems analysis in Myanmar: Methodological background, selected case studies and synthesis of field-based studies across 5 states and regions of Myanmar Published by: LIFT, 2019 Coordinated by: Celine Allaverdian
