Transcription
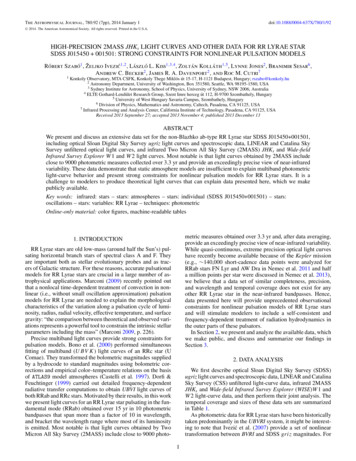
The Astrophysical Journal, 780:92 (7pp), 2014 January 1 C 2014.doi:10.1088/0004-637X/780/1/92The American Astronomical Society. All rights reserved. Printed in the U.S.A.HIGH-PRECISION 2MASS JHKs LIGHT CURVES AND OTHER DATA FOR RR LYRAE STARSDSS J015450 001501: STRONG CONSTRAINTS FOR NONLINEAR PULSATION MODELSRóbert Szabó1 , Željko Ivezić1,2 , László L. Kiss1,3,4 , Zoltán Kolláth1,5 , Lynne Jones2 , Branimir Sesar6 ,Andrew C. Becker2 , James R. A. Davenport2 , and Roc M. Cutri71Konkoly Observatory, MTA CSFK, Konkoly Thege Miklós út 15-17, H-1121 Budapest, Hungary; rszabo@konkoly.hu2 Astronomy Department, University of Washington, Box 351580, Seattle, WA 98195-1580, USA3 Sydney Institute for Astronomy, School of Physics, University of Sydney, NSW 2006, Australia4 ELTE Gothard-Lendület Research Group, Szent Imre herceg út 112, H-9700 Szombathely, Hungary5 University of West Hungary Savaria Campus, Szombathely, Hungary6 Division of Physics, Mathematics and Astronomy, Caltech, Pasadena, CA 91125, USA7 Infrared Processing and Analysis Center, California Institute of Technology, Pasadena, CA 91125, USAReceived 2013 September 27; accepted 2013 November 4; published 2013 December 13ABSTRACTWe present and discuss an extensive data set for the non-Blazhko ab-type RR Lyrae star SDSS J015450 001501,including optical Sloan Digital Sky Survey ugriz light curves and spectroscopic data, LINEAR and Catalina SkySurvey unfiltered optical light curves, and infrared Two Micron All Sky Survey (2MASS) JHKs and Wide-fieldInfrared Survey Explorer W 1 and W 2 light curves. Most notable is that light curves obtained by 2MASS includeclose to 9000 photometric measures collected over 3.3 yr and provide an exceedingly precise view of near-infraredvariability. These data demonstrate that static atmosphere models are insufficient to explain multiband photometriclight-curve behavior and present strong constraints for nonlinear pulsation models for RR Lyrae stars. It is achallenge to modelers to produce theoretical light curves that can explain data presented here, which we makepublicly available.Key words: infrared: stars – stars: atmospheres – stars: individual (SDSS J015450 001501) – stars:oscillations – stars: variables: RR Lyrae – techniques: photometricOnline-only material: color figures, machine-readable tablesmetric measures obtained over 3.3 yr and, after data averaging,provide an exceedingly precise view of near-infrared variability.While quasi-continuous, extreme precision optical light curveshave recently become available because of the Kepler mission(e.g., 140,000 short-cadence data points were analyzed forRRab stars FN Lyr and AW Dra in Nemec et al. 2011 and halfa million points per star were discussed in Nemec et al. 2013),we believe that a data set of similar completeness, precision,and wavelength and temporal coverage does not exist for anyother RR Lyrae star in the near-infrared bandpasses. Hence,data presented here will provide unprecedented observationalconstraints for nonlinear pulsation models of RR Lyrae starsand will stimulate modelers to include a self-consistent andfrequency-dependent treatment of radiation hydrodynamics inthe outer parts of these pulsators.In Section 2, we present and analyze the available data, whichwe make public, and discuss and summarize our findings inSection 3.1. INTRODUCTIONRR Lyrae stars are old low-mass (around half the Sun’s) pulsating horizontal branch stars of spectral class A and F. Theyare important both as stellar evolutionary probes and as tracers of Galactic structure. For these reasons, accurate pulsationalmodels for RR Lyrae stars are crucial in a large number of astrophysical applications. Marconi (2009) recently pointed outthat a nonlocal time-dependent treatment of convection in nonlinear (i.e., without small oscillation approximation) pulsationmodels for RR Lyrae are needed to explain the morphologicalcharacteristics of the variation along a pulsation cycle of luminosity, radius, radial velocity, effective temperature, and surfacegravity: “the comparison between theoretical and observed variations represents a powerful tool to constrain the intrinsic stellarparameters including the mass” (Marconi 2009, p. 226).Precise multiband light curves provide strong constraints forpulsation models. Bono et al. (2000) performed simultaneousfitting of multiband (U BV K) light curves of an RRc star (UComae). They transformed the bolometric magnitudes suppliedby a hydrocode to standard magnitudes using bolometric corrections and empirical color–temperature relations on the basisof ATLAS9 model atmospheres (Castelli et al. 1997). Dorfi &Feuchtinger (1999) carried out detailed frequency-dependentradiative transfer computations to obtain UBVI light curves ofboth RRab and RRc stars. Motivated by their results, in this workwe present light curves for an RR Lyrae star pulsating in the fundamental mode (RRab) obtained over 15 yr in 10 photometricbandpasses that span more than a factor of 10 in wavelength,and bracket the wavelength range where most of its luminosityis emitted. Most notable is that light curves obtained by TwoMicron All Sky Survey (2MASS) include close to 9000 photo-2. DATA ANALYSISWe first describe optical Sloan Digital Sky Survey (SDSS)ugriz light curves and spectroscopic data, LINEAR and CatalinaSky Survey (CSS) unfiltered light-curve data, infrared 2MASSJHKs and Wide-field Infrared Survey Explorer (WISE)W 1 andW 2 light-curve data, and then perform their joint analysis. Thetemporal coverage and sizes of these data sets are summarizedin Table 1.As photometric data for RR Lyrae stars have been historicallytaken predominantly in the UBVRI system, it might be interesting to note that Ivezić et al. (2007) provide a set of nonlineartransformation between BVRI and SDSS griz magnitudes. For1
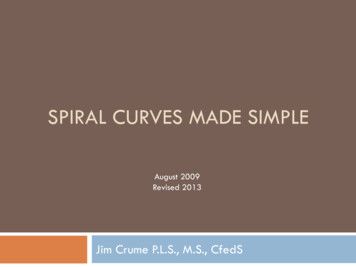
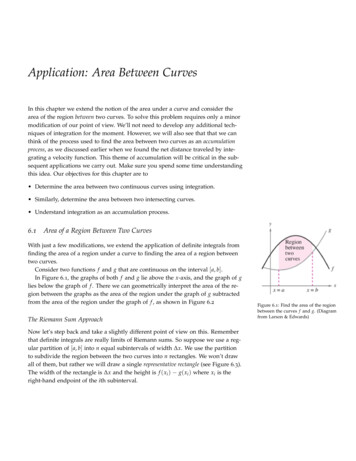
The Astrophysical Journal, 780:92 (7pp), 2014 January 1Szabó et al.Table 1Photometric Data Analyzed in This WorkSurvey2MASSSDSSLINEARCSSWISEMJDaminMJDbmaxN EpochscN 5557529696422527043890732022527086Notes.a Earliest MJD in the survey.b Latest MJD in the survey.c The number of photometric epochs.d The number of photometric data points (the number of epochs times thenumber of bandpasses).Figure 1. Phased and normalized SDSS urz (bottom to top, respectively) lightcurves for SDSS J015450 001501. Data points are shown by symbols andconnected by straight lines. The scatter is due to random photometric errors(0.01–0.02 mag).(A color version of this figure is available in the online journal.)a linear transformation between the U and u magnitudes, referto Jester et al. (2005).2.1. SDSS DataThe SDSS (Abazajian et al. 2009) has repeatedly imagedabout 300 deg2 large equatorial strip limited by 309 R.A. 60 and decl. 1. 26, and known as Stripe 82. The propertiesof this data set and its impact on variability studies are discussedin detail by Ivezić et al. (2007), Sesar et al. (2007), and Bramichet al. (2008). An extensive study of light curves for RR Lyraestars found in Stripe 82 was undertaken by Sesar et al. (2010).The star discussed here was identified in SDSS Stripe82 data with coordinates (J2000.0): R.A. 28.709054and decl. 0.250206 (decimal degrees). Following standard SDSS nomenclature, hereafter we refer to it asSDSS J015450 001501. All SDSS data for this star are publicly8 available, as well as electronically published along withthis paper for convenience. Table 2 shows the form and content of the data. Images show a distinctively blue isolated pointsource, with the nearest brighter object more than 30 away.Its SDSS r-band magnitude varies from 14.6 to 15.5 and,according to Sesar et al. (2010), this star is at a heliocentricdistance of D 7.59 kpc.Figure 2. Default SDSS visualization of the SDSS spectrum forSDSS J015450 001501. The spectrum is classified as an A0 star.(A color version of this figure is available in the online journal.)(2010), we normalized light curves by their amplitude (withminimum and maximum brightness determined using B splines)and shifted so that minimum brightness is 0 and maximumbrightness is 1. As evident from Figure 1, light curves are typicalfor ab RR Lyrae stars and greatly vary with wavelength.2.1.1. Imaging DataSDSS imaging data for this star were obtained 64 timesand include nearly simultaneous ugriz photometry precise to0.01–0.02 mag. To construct phased light curves, we use theperiod and epoch of maximum determined using better sampledLINEAR data (see Section 2.2). Phased and normalized SDSSurz light curves are shown in Figure 1. Following Sesar et al.2.1.2. Spectroscopic DataSDSS J015450 001501 was spectroscopically targeted bySDSS as a quasar candidate. Its SDSS spectrum (identifiers:plate 700, fiber 515, MJD 52199) is consistent withthat for an A0 star (see Figure 2). The spectroscopic parametersdetermined by the SEGUE Stellar Parameter Pipeline (Lee et al.2011) include [Fe/H] 1.31 0.03, log(g) 2.97 0.20,Teff 6580 104 K, and radial velocity 135.1 1.8 km s 1 obj.asp?sid 788271533805037568Table 2SDSS ugriz Light Curves for RR Lyrae Star SDSS J015450 001501 (64 .347388.15.16115.447.0.0060.006.Notes. Magnitudes are not corrected for ISM dust extinction and set to -99.999 if unreliable. See Sesar et al. (2010) for more details.a Equatorial J2000.0 right ascension and declination.(This table is available in its entirety in a machine-readable form in the online journal. A portion is shown here for guidance regarding its form and content.)2
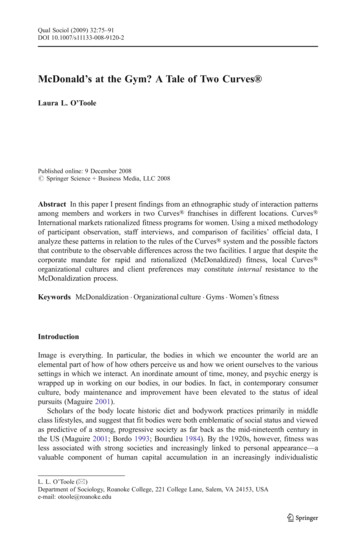
The Astrophysical Journal, 780:92 (7pp), 2014 January 1Szabó et al.Table 4CSS Light Curve for RR Lyrae StarSDSS J015450 001501 (270 Epochs)Table 3LINEAR Light Curve for RR Lyrae StarSDSS J015450 001501 (225 76.15.4415.46.0.060.06.(This table is available in its entirety in a machine-readableform in the online journal. A portion is shown here forguidance regarding its form and content.)Notes. For details, see Sesar et al. (2011, 2013).(This table is available in its entirety in a machine-readableform in the online journal. A portion is shown here forguidance regarding its form and content.)We note, however, that the spectrum of this star is a coaddof five individual exposures, and the time between the start ofthe first and the end of the last exposure is 1.03 days. Thus,the parameters derived from this spectrum might contain muchhigher systematic errors because the individual exposures spana wide range of pulsational phases.2.2. LINEAR and CSS Light-curve DataThe asteroid survey LINEAR was photometrically recalibrated by Sesar et al. (2011) using SDSS stars acting as adense grid of standard stars. In the overlapping 10,000 deg2of sky between LINEAR and SDSS, photometric errors forunfiltered (white light) photometry range from 0.03 magfor sources not limited by photon statistics to 0.20 magat r 18 (here r is the SDSS r-band magnitude). LINEARdata provide time domain information for the brightest 4 magof SDSS survey, with 250 unfiltered photometric observations per object on average. The public access to the recalibrated LINEAR data is provided through the SkyDOT Website (https://astroweb.lanl.gov/lineardb/) and is also available asauxiliary material with this paper (see Table 3). RR Lyrae starsfrom this data set have been analyzed by Sesar et al. (2013).The CSS uses three telescopes to search for near-Earth objects. Each of the survey telescopes is run as separate subsurveys,including the Catalina Schmidt Survey and the Mount LemmonSurvey in Tucson, Arizona, and the Siding Spring Survey inSiding Spring, Australia. CSS is similar to LINEAR in that ituses unfiltered observations and delivers similar photometricprecision (but is deeper by several magnitudes). RR Lyrae starsfrom this data set have been analyzed by Drake et al. (2013).SDSS J015450 001501 was observed by LINEAR and CSSabout 500 times over 10 yr. Both light curves are shown inFigure 3 and are barely distinguishable. Using only LINEARdata, Sesar et al. (2013) have determined a best-fit period,P 0.636985 days, and the epoch of maximum, MJDmax 53675.299080. Based on Sesar et al. (2011) photometric transformations between LINEAR and SDSS r-band data, a great degree of similarity is expected between unfiltered LINEAR/CSSlight curves and the SDSS r-band light curve. This expectationis verified by data, as illustrated in Figure 3. CSS observationsof SDSS J015450 001501 are collected in Table 4.Figure 3. LINEAR (dashed), CSS (dot-dashed), and SDSS r-band (solid) lightcurves for SDSS J015450 001501. LINEAR and CSS data (225 and 270data points, respectively) were smoothed by taking the median in 0.05 widephase bins, with resulting random errors at most 0.01 mag. SDSS light curvecorresponds to 64 data points (with random errors of 0.01–0.02 mag) connectedby straight lines (same curve as in Figure 1). Note that all three light curvesbarely differ from each other.(A color version of this figure is available in the online journal.)Figure 4. Phased and normalized SDSS gi and 2MASS JHK (bottom to top,respectively) light curves for SDSS J015450 001501. Phased 2MASS lightcurve data ( 3000 data points per band) were smoothed by taking the medianin 0.04 wide phase bins, with resulting random errors well below 0.01 mag.SDSS light curves correspond to 64 data points each (with random errors of0.01–0.02 mag), connected by straight lines. Note that the shapes of H and Klight curves are barely distinguishable.(A color version of this figure is available in the online journal.)Explanatory Supplement9 and Cutri et al. (2003). An analysisof various variable stars contained in this data set was presentedby Plavchan et al. (2008), Becker et al. (2008), and Davenportet al. (2012), where more technical details can be found.SDSS J015450 001501 was observed about 3000 times ineach of the three bandpasses (see Tables 1 and 5). Phased andnormalized 2MASS light curves are shown and compared toSDSS gi light curves in Figure 4. Because the 2MASS data setis so large and we see no sign of Blazhko-modulation in the lightcurves, data were smoothed by taking the median in 0.04 widephase bins, with resulting random errors well below 0.01 mag.2.3. 2MASS Light-curve DataThe most extensive data set presented here comes from the2MASS survey (Skrutskie et al. 2006). SDSS J015450 001501falls in one of the 35 2MASS calibration fields that wereimaged repeatedly in the J, H, and Ks bandpasses during eachnight of the 3.5 yr survey. Full details are given in the /allsky/doc/sec3 2d.html
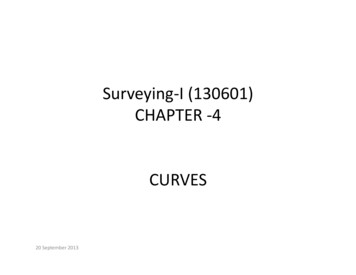
The Astrophysical Journal, 780:92 (7pp), 2014 January 1Szabó et al.Figure 5. Top four panels display phased and normalized 2MASS JHK and color J K light curves for SDSS J015450 001501. Phased 2MASS light-curve data( 3000 data points per band) were smoothed by taking the median in 0.05 wide phase bins, with resulting random errors well below 0.01 mag. The median value ofthese averaged data points is subtracted from each curve, and points are connected by straight lines. Random errors are derived from scatter in each phase bin. Thebottom two panels show color–magnitude (left) and color–color (right) hysteresis curves (the motion is clockwise). Note that between phases 0.65 and 0.70 the J Kcolor becomes bluer despite the decreasing brightness (see the middle right and bottom left panels, and arrow in the latter panel). The H K color does not show anyvariation (rms of 0.01 mag, consistent with measurement errors).(A color version of this figure is available in the online journal.)Table 52MASS JHK Light Curves for RR Lyrae Star SDSS J015450 001501 (2969 ag)Jq bH(mag)Herr(mag)Hq bK(mag)Kerr(mag)Kq 0750.077.AA.Notes.a Equatorial J2000.0 right ascension and declination.b Reliability flag. Single character flag that is related to the probability (P) that the extraction is a valid detection of a near-infrared source on the sky at the time of theobservation. “A” means P 90%.(This table is available in its entirety in a machine-readable form in the online journal. A portion is shown here for guidance regarding its form and content.)varies with an amplitude of 0.2 mag, the H K color does notappear to vary: Its rms scatter is only 0.01 mag, and consistentwith photometric noise (compare to 0.075 mag for the J Kcolor).Perhaps the most interesting feature revealed by thehigh-precision 2MASS data is seen in the J versus J Kcolor–magnitude diagram (bottom left panel of Figure 5). Inaddition to the clearly seen “hysteresis” (for an illustration of asimilar behavior in the ugr bandpasses, see Figure 9 in Sesaret al. 2010), the J K color becomes bluer between phases0.65 and 0.70 despite the decreasing brightness (see the middle right and bottom left panels and arrow in the latter panel).Given the short duration ( 45 minutes) and a small amplitude(0.03 mag) of this feature, it is unlikely that it was well observedfor other stars. We return to an interpretation of this behavior inSection 2.5.The variation of the light-curve shape with bandpass wavelengthseen in SDSS data (see Figure 1), continues into near-infrared,but only to the H band—the light curves in the H and K bandsare barely distinguishable despite the high precision of 2MASSdata. We proceed with a more detailed analysis of the JHKvariability, which reveals interesting light-curve features.2.3.1. Phase-resolved Near-infrared Color–MagnitudeHysteresis LoopsThe phased JHK light curves, the J K color variation withphase, and phased-resolved color–magnitude and color–colordiagrams constructed with 2MASS data that were smoothed bytaking the median are shown in Figure 5. A notable feature isthat the time of maximum light in H and K bandpasses does notcoincide with the time of maximum light at shorter wavelengths,but lags in phase by about 0.25. Unlike the J K color, which4
The Astrophysical Journal, 780:92 (7pp), 2014 January 1Szabó et al.ugrizJHKW1W2Figure 6. WISE W 1-band phased and normalized light curve forSDSS J015450 001501 is shown as symbols with error bars (as computedby the WISE photometric processing pipeline). The line shows phased andnormalized 2MASS K-band light curve (same curve as in Figure 4).(A color version of this figure is available in the online journal.)Figure 7. Top panel: 10 band SEDs at maximum (top) and minimum (bottom)light for SDSS J015450 001501. Data are shown by symbols and connectedby dotted straight lines. Open squares correspond to maximum light and opencircles to minimum light (phase 0.86). Solid triangles, inside open circles,correspond to phase 0.50, shifted fainter by 0.25 mag. The SED shape atphase 0.50 is nearly indistinguishable from the SED at minimum light.The solid lines show Kurucz models for [Fe/H] 1.5, log(g) 3.0, andTeff 7500 K (top) and Teff 6000 K (bottom). Bottom panel: light-curveamplitude, in magnitudes, as a function of wavelength.(A color version of this figure is available in the online journal.)Table 6WISE Light Curves for RR Lyrae Star SDSS J015450 001501 (43 Epochs)MJD55209.27284555209.405150.W1W 1errW2W 9.(This table is available in its entirety in a machine-readable form in the onlinejournal. A portion is shown here for guidance regarding its form and content.)longer wavelengths there is very little change of light-curveamplitude, if any. The u-band and the g-band amplitudes aresimilar, which implies that the u g color stays approximatelyconstant over the pulsational cycle. This is easily understoodas the consequence of the fact that the u g color primarilydepends on metallicity (see Marconi et al. 2006).The overall SED shapes are well described by static modelatmospheres computed by Kurucz (1979). The solid lines inthe top panel in Figure 7 show Kurucz models for fixed[Fe/H] 1.5 and log(g) 3.0, and best-fit Teff 7500 K(maximum light) and Teff 6000 K (minimum light). Theeffective temperature step in the model library was 250 K. Aslight discrepancy between the measured u-band magnitude atmaximum light and the best-fit model can be reconciled as dueto the impact of the steep SED in that region.Despite this apparent success of static atmosphere models,it is easy to demonstrate that they cannot provide a completedescription of the data. Figure 8 shows a phase-resolved J Kversus g i color–color diagram. Both of these colors are largelydriven by effective temperature, and Kurucz models show thatthe impact of log(g) is only minor (at most a few hundredthsof a magnitude in the J K color at a given g i color; fora detailed discussion, see Ivezić et al. 2008). Therefore, ifstatic atmosphere models are sufficient to describe the data,then the data should follow a single line in this diagram,with the position along that line controlled by the effectivetemperature. In contrast, data in this color–color diagram showa similar hysteresis effect as the J versus J K color–magnitudediagram (bottom left panel in Figure 5). This color–colorhysteresis, however, cannot be described as the result of differentstellar radii at a given effective temperature, as in the case ofcolor–magnitude diagram.To provide a precise quantitative estimate of the discrepancybetween observed colors and colors predicted by Kurucz models, we compare a set of models for three values of log(g) and2.4. WISE Light-curve DataThe WISE (Wright et al. 2010) mapped the sky at 3.4, 4.6,12, and 22 μm. WISE imaged each point on the sky multipletimes to achieve its sensitivity goals and to reject transient eventssuch as cosmic rays. SDSS J015450 001501 was measured 43independent times, during two epochs approximately 6 monthsapart. The single-exposure photometric signal-to-noise ratio ishigh enough for light-curve analysis in the W 1 (3.4 μm) andW 2 (4.6 μm) bands: the median photometric errors are 0.05 magfor W 1 and 0.15 mag for W 2. These two light curves (43 datapoints per band) are compiled in Table 6.Although WISE data are noisy, it is possible to make arough comparison with 2MASS data. As shown in Figure 6,the phased and normalized light curve in the W 1 band is fullyconsistent with the corresponding 2MASS light curve in the Kband (including the amplitude). A more detailed comparison ofdata across all 10 bandpasses is described next.2.5. Simultaneous Analysis of Optical and Infrared DataAs shown earlier, the shape of light curves varies greatlywith wavelength. Another way to look at the same data set isto construct phase-resolved spectral energy distributions (SED).SEDs at minimum and maximum phases, and at phase 0.5,are compiled in Table 7 and shown in the top panel in Figure 7.When the SED at phase 0.5 is scaled to a fainter flux levelby 0.25 mag, it is indistinguishable from the SED at minimumphase (0.86). Assuming identical effective temperatures, thisscaling factor implies that the effective radius of the stardecreases by 12% between these two phases.The variation of light-curve amplitude with wavelength isshown in the bottom panel in Figure 7. Between the SDSSg band (0.476 μm) and the 2MASS H band (1.65 μm), theamplitude steadily decreases from 1.3 mag to 0.3 mag. At5
The Astrophysical Journal, 780:92 (7pp), 2014 January 1Szabó et al.Table 7Spectral Energy Distribution Data for RR Lyrae Star SDSS J015450 001501BandugrizJHKW1W2λeff (μm)MagminErrMagmaxErrAmplitudeMagφ 0.5Extinction 0310.0200.0130.0080.007Notes. The table lists 2MASS and WISE magnitudes on AB scale. The following Vega-to-AB magnitude offsets (m AB m Vega offset)were used: 0.89, 1.37, 1.84 in JHK, and 2.6, 3.3 in W 1 and W 2. Magnitude values are not corrected for interstellar medium (ISM) dustextinction. Plausible extinction corrections (Schlegel et al. 1998, SFD) are listed in the last column and are derived using the SFD valuefor the r-band extinction quoted by SDSS for this star: Ar 0.099, and coefficients listed in the first row of Table 1 from Berry et al.(2012) for the ugrizJHK bands. For the WISE bands, the coefficients taken from Yuan et al. (2013) (AW 1 /Ar 0.084, AW 2 /Ar 0.074).g i 0 color, the J K color differs by 0.05 mag. Suchlarge color differences are unlikely to be explained by the impactof log(g) parameter on static atmosphere models. It is unclearwhether dynamic models can explain these data.3. DISCUSSION AND CONCLUSIONSEssentially by coincidence, the nonmodulated (non-Blazhko)RR Lyrae star SDSS J015450 001501 has been extensivelyobserved by several major sky surveys: SDSS, 2MASS, CSS,LINEAR, and WISE. We have compiled data from these surveysand made the compilation publicly available in a user-friendlyform. The light curves for this star are available in 10 photometric bandpasses that span more than a factor of 10 in wavelengthand bracket the wavelength range where most of its luminosityis emitted. Light curves obtained by 2MASS stand out: theyinclude close to 9000 photometric measures and provide an unprecedentedly precise view of near-infrared variability. A dataset of similar completeness, precision, and wavelength and temporal coverage likely does not exist for any other RR Lyraestar.The data for SDSS J015450 001501 presented here providestrong observational constraints for nonlinear pulsation modelsof RR Lyrae stars. Sesar et al. (2010) already pointed out (seetheir Figure 8) that there are discrepancies between the ugrizRR Lyrae light curves obtained by SDSS and theoretical lightcurve predictions from Marconi et al. (2006). Here, we furtherdemonstrated that static atmosphere models are insufficientto explain multiband photometric light-curve behavior. Barcza(2010) demonstrated that the quasi-static approximation is notvalid for all phases during an RR Lyrae pulsational cycle.Pulsation models computed by Fokin & Gillet (1997) with alarge number of mass shells in the stellar atmosphere showthat the s3’ and/or the merging s3 s4 shockwaves might beat work at the pulsational phase range of 0.65–0.70, where wefound the “kink” in the J K color progression (Figure 5). Wecaution, however, that a large model survey should be conductedin a broad range of RR Lyrae physical parameters to verify theexistence and the influence of these shockwaves, in particularin SDSS J015450 001501.Another complication is that in different passbands, we observe the integrated light of different atmospheric layers. Therefore, a frequency-dependent, dynamical atmosphere model coupled to a state-of-the-art hydrocode is needed to consistentlyFigure 8. Symbols connected by dashed lines show 2MASS J K color vs.SDSS g i color for SDSS J015450 001501. Data were binned in 0.1 wideequidistant phase bins, and the bin centers are marked for a few data points (themotion during pulsational cycle is counterclockwise in this diagram). Althoughboth colors are good estimators of the effective temperature, a hysteresis iseasily seen (e.g., at g i 0, about 0.05 mag difference in J K color). Notethat both colors are essentially constant for phase bins from 0.45 to 085. Thesix thin, solid lines are predictions made on the basis of Kurucz static modelatmospheres with effective temperatures in the range 6000–7500 K. At the blueend, they bifurcate into the groups of three tracks—they correspond to modelswith [Fe/H] 1.5 (the top three curves) and [Fe/H] 1.0. For eachmetallicity, the three curves correspond to log(g) 2.5, 3.0 and 3.5. Note thatat the blue end, the models bifurcate according to log(g), rather than [Fe/H] (atJ K 0.13, the g i color becomes bluer by 0.1 mag as log(g) increasesfrom 2.5 to 3.5.(A color version of this figure is available in the online journal.)two values of [Fe/H] that bracket the values expected for thisstar (see Figure 8). Models provide a fairly good agreement,to within a few hundredths of a magnitude) for the descending branch of the light curve (phases between the light curvemaximum and minimum, the lower branch in Figure 8). However, all models fail to explain the observed colors during theascending branch, as the light curve goes from the minimumlight to the maximum light (note that ascending portion of thelight curve is about five times shorter than the descending portion). At a given J K colors, the discrepancy can be as large as 0.2 mag!Note that this model failing cannot be simply attributedto inadequacy of Kurucz models: whatever static atmospheremodel library is invoked, it should produce much smallerhysteresis in this diagram, if any. For example, at a fixedJ K 0.2, the difference in the g i color at the descendingand ascending branches is over 0.2 mag. Similarly, at a fixed6
The Astrophysical Journal, 780:92 (7pp), 2014 January 1Szabó et al.lab, the Institute for Advanced Study, the Japan ParticipationGroup, Johns Hopkins University, the Joint Institute for NuclearAstrophysics, the Kavli Institute for Particle Astrophysics andCosmology, the Korean Scientist Group, the Chinese Aca
light-curve behavior and present strong constraints for nonlinear pulsation models for RR Lyrae stars. It is a challenge to modelers to produce theoretical light curves that can explain data presented here, which we make publicly available. Key words: infrared: stars - stars: atmospheres - stars: individual (SDSS J015450 001501) - stars: