Transcription
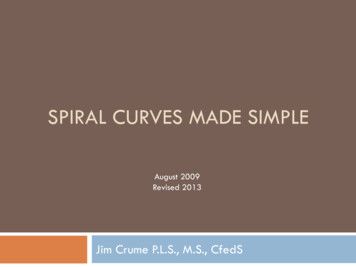
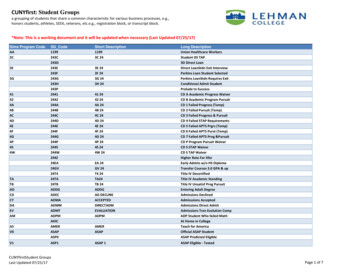
Application: Area Between CurvesIn this chapter we extend the notion of the area under a curve and consider thearea of the region between two curves. To solve this problem requires only a minormodification of our point of view. We’ll not need to develop any additional techniques of integration for the moment. However, we will also see that that we canthink of the process used to find the area between two curves as an accumulationprocess, as we discussed earlier when we found the net distance traveled by integrating a velocity function. This theme of accumulation will be critical in the subsequent applications we carry out. Make sure you spend some time understandingthis idea. Our objectives for this chapter are to Determine the area between two continuous curves using integration. Similarly, determine the area between two intersecting curves. Understand integration as an accumulation process.6.1 Area of a Region Between Two CurvesWith just a few modifications, we extend the application of definite integrals fromfinding the area of a region under a curve to finding the area of a region betweentwo curves.Consider two functions f and g that are continuous on the interval [ a, b].In Figure 6.1, the graphs of both f and g lie above the x-axis, and the graph of glies below the graph of f . There we can geometrically interpret the area of the region between the graphs as the area of the region under the graph of g subtractedfrom the area of the region under the graph of f , as shown in Figure 6.2The Riemann Sum ApproachNow let’s step back and take a slightly different point of view on this. Rememberthat definite integrals are really limits of Riemann sums. So suppose we use a regular partition of [ a, b] into n equal subintervals of width Dx. We use the partitionto subdivide the region between the two curves into n rectangles. We won’t drawall of them, but rather we will draw a single representative rectangle (see Figure 6.3).The width of the rectangle is Dx and the height is f ( xi ) g( xi ) where xi is theright-hand endpoint of the ith subinterval.Figure 6.1: Find the area of the regionbetween the curves f and g. (Diagramfrom Larson & Edwards)
math 131application: area between curves2Figure 6.2: Find the area of the regionbetween the curves f and g when bothf and g lie above the x-axis and g liesbelow f . (Diagram from Larson &Edwards)The area of the representative rectangle isheight width [ f ( xi )g( xi )]Dx.We add up all the n rectangles to get an approximation to the total area betweenthe curves:Approximate Area beween f and g n [ f ( xi )g( xi )]Dx.i 1To improve the approximation we take the limit as n ! .limn! n [ f ( xi )Figure 6.3: The area of the ith rectangleis [ f ( xi ) g( xi )]Dx. (Diagram fromLarson & Edwards).g( xi )]Dx.i 1Now because both f and g are continuous we know that this limit exists and, infact, equals a definite integral. Thus, the area of the given region isnArea beween f and g limn!  [ f ( xi )i 1g( xi )]Dx Z ba[ f (x)g( x )] dx.Let’s summarize what we have found in a theorem.THEOREM 6.1.1. If f and g are continuous on [ a, b] and g( x ) f ( x ) for all x in [ a, b], thenthe area of the region bounded by the graphs of f and g and the vertical lines x a andx b isArea beween f and g Z ba[ f (x)g( x )] dx.Note: This area will always be non-negative.Notice that the theorem gives the same answer as our earlier geometric argument in Figure 6.2 However, unlike in Figure 6.2, notice that the theorem does notsay that both curves have to lie above the x-axis. The same integralZ baBetwCurves.tex[ f (x)g( x )] dxVersion: Mitchell-2015/09/27.14:30:16
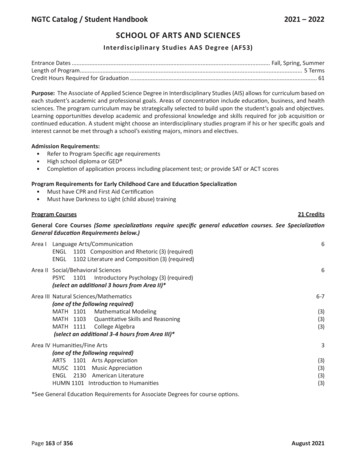
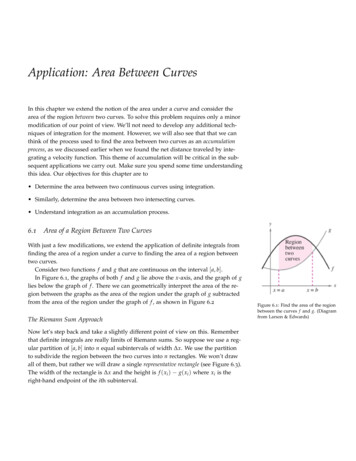
math 131application: area between curves3works as long as f and g are continuous on [ a, b] and g( x ) f ( x ) for all x in theinterval [ a, b]. The reason this same integral remains valid when one or both curvesdip below the x-axis is illustrated in Figure 6.4. The height of a representativerectangle is always f ( x ) g( x ). This is the advantage of using Riemann sumsand representative rectangles. It gives us a more general argument than a simplegeometric one in this case.Figure 6.4: The height of a representative rectangle is f ( x ) g( x ) whetheror not one or both curves lie above orbelow the x-axis. (Diagram from Larson& Edwards)Tip for SuccessWe will continue to use representative rectangles as we develop further applications. Drawing a figure with such representative rectangles will help you to writeout the correct integral in these applications.6.2Examples( x, x 1)We now take a look at several examples.EXAMPLE 6.2.1. Find the area of the region bounded by the graphs of y x2 1 and y x3and the vertical lines x 1 and x 1.Solution. After quickly plotting the graphs we see that x2 1 lies above x3 onthe interval. So let f ( x ) x2 1 and g( x ) x3 . Since both are continuous(polynomials) Theorem 6.1.1 applies and we haveArea beween f and g . .2. . . . . . . . .Z ba[ f (x)g( x )] dx Z 11[( x2 1)x3 x3 1 13 x3 ] dx f ( x ) x2 1g( x ) x3 ( x, x3 )11Figure 6.5: The area between f and gwith a representative rectangle.1x44 141 13114 8 .3Area Enclosed by Two Intersecting CurvesIn Example 6.2.1 we found the area below one curve but above another curve ona given interval. A more common problem is a slight variation on this. Find theregion enclosed by two intersecting curves. Usually the points of intersection arenot provided and that becomes the first step in solving such a problem.BetwCurves.texVersion: Mitchell-2015/09/27.14:30:16
math 131application: area between curves4EXAMPLE 6.2.2 (Two Intersecting Curves). Find the area of the region enclosed by the graphsof y x22 and y x. (In a typical problem, not even the graph is given.)Solution. Let f ( x ) x2two graphs:x22 and g( x ) x. First we find the intersections of the2 x ) x22 0 ) ( x 1)( xx2) 0 ) x 1, 2.Which curve lies above the other on the interval [ 1, 2]? We can test an intermediate point. The point x 0 is convenient: Notice f (0) 2 and g(0) 0. Or wecan can quickly plot the graphs (see Figure 6.6) and see that x lies above x2 2 onthe interval [ 1, 2]. Since both are continuous (polynomials) Theorem 6.1.1 appliesand we have (notice that g is ‘on top’).Area enclosed by g and f Z ba[ g( x )f ( x )] dx Z 21( x2[xx22 2 2)] dxx3 2x3 8 432 1 2Figure 6.6: The area enclosed by y x2 2 and y x with a representativerectangle.21 y x2y x. . . . . . . . .1 1 2 32 9 .2EXAMPLE 6.2.3 (Division into Two Regions). Find the area of the region enclosed by thegraphs of y x3 and y x.Solution.graphs:Let f ( x ) x3 and g( x ) x. First we find the intersections of the twox3 x ) x3x 0 ) x ( x21) 0 ) x ( x 1)( x)x 1) 01, 0, 1.Since there are three points of intersection, we need to determine which curve liesabove the other on each subinterval. On [ 1, 0], we can test an intermediate pointx 12 : f ( 12 ) 18 and g( 12 ) 12 . So f lies above g. On [0, 1], we test atthe intermediate point x 12 : f ( 12 ) 18 and g( 12 ) 12 . So g lies above f . Also wecan quickly plot the graphs (see Figure 6.7) and the same behavior. Since both arecontinuous (polynomials) Theorem 6.1.1 applies. However, we will have to splitthe integration into two pieces since the top and bottom curves change at the pointx 0 in the interval [ 1, 1].Area enclosed by g and f Z 0 1[ x3x44[0]x ] dx 2 x2 14012Z 1 1 0 y x3. . . . . . . . . . . . . . . . . . . . .y x 1 1 x3 ] dx[xx22 4 x41214Figure 6.7: The area enclosed by y x3and y x. The top and bottom curveswitch at x 0. There are two differentrepresentative rectangles.10[0]EXAMPLE 6.2.4. Find the area of the region enclosed by the graphs of y xp 1 .2x 1 andy 2x.BetwCurves.texVersion: Mitchell-2015/09/27.14:30:16
math 131application: area between curvespSolution. Let f ( x ) x x 1 and g( x ) 2x. First we find the intersections ofthe two graphs:px x 1 2x ) x2 ( x 1) 4x2 ) x33x2 0 ) x2 ( x3) 0) x 0, 3.To determine which curve lies above the other on On [0, 3], we can test an intermepdiate point, say x 1: f (1) 2 and g(1) 2. So g lies above f . We can quicklyplot the graphs (see Figure 6.8). Since both are continuous Theorem 6.1.1 applies.Area enclosed by g and f Z 30[2xZpx x 1] dx 302x dxZ 3 p0x x 1 dx.For the second integral we use the substitutionu px 1 ) u2 x 1 ) u25. . . . . . . . . . . . . . . . . . . . . . . . . . . . . . . y 2xpy x x 1 03Figure p6.8: The area enclosed byy x x 1 and y 2x and arepresentative rectangle.1 x ) 2u du dxand change the limits:when x 0, u pp0 1 1; when x 3, u 3 1 2.SoZ 302x dxZ 3 p0x x 1 dx Z 30 x22x dxZ 2310 (9 90) 645Z 21( u22u4 2u55831) · u · 2u duu2 duu33 15 2113 19.15VariationsHere are some additional ‘variations on the theme’ of Theorem 6.1.1.EXAMPLE 6.2.5 (Multiple Curves, Multiple Regions). Find the area of the region enclosed bythe graphs of y 8x2 , y 7x, and y 2x in the first quadrant.Solution. This time there are three curves to contend with. Since the curves arerelatively simple (an upside-down parabola and two lines through the origin, it isrelatively easy to make a sketch of the region. See Figure 6.9. Let f ( x ) 8 x2 ,g( x ) 7x, and h( x ) 2x. A wedge-shaped region is determined by all threecurves. Notice that the ‘top’ curve of the region switches from g( x ) to f ( x ). Wefind the intersections of the pairs of graphs:f ( x ) g( x ) ) 8 x2 7x ) x2 7x 8 0 ) ( x 1)( x 8) 0 ) x 1 (not8).f ( x ) h( x ) ) 84).x2 2x ) x2 2x8 0 ) (x2)( x 4) 0 ) x 2 (notg( x ) h( x ) ) 7x 2x ) 5x 0 ) x 0.BetwCurves.texVersion: Mitchell-2015/09/27.14:30:16
math 131application: area between curves. . . . . . . . . . . . . . . . . . .y 7xThe region is thus divided into two subregions and the graph gives the relative positions of the curves. Since all the functions are continuous Theorem 6.1.1applies.Z 1Area enclosed by f , g, and h 0Z 1 0 [7x2x ] dx Z 2252 x2 )[(8x33[5x ] dx 8x 15x21x2 831640 8310 .36 y 2x 2x dxy 8 21 13861 0 1x22Figure 6.9: The area enclosed byy 8 x2 , y 7x, and y 2x inthe first quadrant. There are two representative rectangles because the topcurve changes.YOU TRY IT 6.1. Set up the integrals using the functions f ( x ), g( x ), and h( x ) and theirpoints of intersection that would be used to find the shaded areas in the three regions below.555. h ( x ). .y g( x ) y f ( x.).y g( x ). .4 .4 .4.3210. . .321Shaded01234506. . . . . .1232f (x)Shaded0345106. . . . . . . . . . .g( x )ShShf (x)0123456YOU TRY IT 6.2. Sketch the regions for each of the following problems before finding theareas.(a) Find the area enclosed by the curves y x3 and y x2 .(b) Find the area enclosed by the curves y x3 x and y 3x2x.(c) Find the area between the curves f ( x ) cos x sin x and g( x ) cos x[0, 2p ].sin x overanswer to you try it 6.2. (a) 1/12; (b) 1/2; (c) 8.YOU TRY IT 6.3. Sketch each region before finding its area:(a) The area in the first quadrant enclosed by y cos x, y sin x, and the y axis.p3x.(b) The area enclosed by y x3 and y (c) The area enclosed by y x3 1 and y ( x 1)2 .p(d) Harder integration: The area enclosed by y x 2x 3 and y x2 .answer to you try it 6.3. (a)p21; (b) 1; (c) 37/12; (d)65p3 2615 .webwork: Click to try Problems 75 through 80. Use guest login, if not in my course.BetwCurves.texVersion: Mitchell-2015/09/27.14:30:16
math 131application: area between curves7EXAMPLE 6.2.6. Find the area of the region in the first quadrant enclosed by the graphs ofy 1, y ln x, and the x- and y-axes.Solution. It is easy to sketch the region. See Figure 6.10. The curve y ln xintersects the x-axis at x 1 and the line y 1 at x e. Notice that the ‘bottom’curve of the region switches from x-axis to y ln x at x 1. The region is dividedinto two subregions (one is a square!) and the graph gives the relative positions ofthe curves. Since both the functions are continuous Theorem 6.1.1 applies.Area Z 10Z e1 dx 11ln x dxWe can rewrite the integral in a more convenient way. Notice that the area thewe are trying to find is really just the rectangle of height 1 minus the area undery ln x on the interval [1, e]. (Yet another way of saying this is that we are splittingReReReln x dx into two integrals 1 1 dx and 1 ln x dx and then combining the1 1R1ReRetwo integrals 0 1 dx 1 1 dx into one leaving1 ln x dx.) We getArea Z e01 dxZ e1y 1. .1 y ln x 1eFigure 6.10: The region in the firstquadrant enclosed by the graphs ofy 1, y ln x, and the x- and y-axes.There are two representative rectanglesbecause the bottom curve changes.ln x dx e ?The problem is that we do not know an antiderivative for ln x. So we need anotherway to attack the problem. We describe this below.6.3Point of View: Integrating along the y-axisReconsider Example 6.2.6 and change our point of view. Suppose that we drewour representative rectangles horizontally instead of vertically as in Figure 6.11.The integration now takes place along the y-axis on the interval [0, 1]. Using inverse functions, the function y ln x is viewed as x g(y) ey . Now the ‘width’of a representative rectangle is Dy and the (horizontal) ‘height’ of the ith such rectangle is given by g(yi ).As we saw earlier in the term with integration along the x-axis, since g is continuous, the exact area of the region is given byn g(yi )Dy n! Area limi 1Z dcg(y) dy.1Dy {0.i.y.g(y )! x e(y ln x)eFigure 6.11: The region in the firstquadrant enclosed by the graphs ofy 1, y ln x, and the x- and y-axes.There are two representative rectanglesbecause the bottom curve changes.In our particular case, the interval [c, d] [0, 1] along the y-axis. The functiong(y) ey . So the area of the region is in Figure 6.11 (or equivalently 6.10) isArea Z dcg(y) dy Z 10ey dy ey1 e1.0We can generalize the argument we just made and state the equivalent of Theorem 6.1.1 for finding areas between curves by integrating along the y-axis.dTHEOREM 6.3.1 (Integration along the y-axis). If f (y) and g(y) are continuous functions on [c, d]and g(y) f (y) for all y in [c, d], then the area of the region bounded by the graphs of x f (y) and x g(y) and the horizontal lines y c and y d isArea beween f and g BetwCurves.texZ dc[ f (y). . . . . . .x g(y)cx f (y)g(y)] dy.Figure 6.12: The region bounded by thegraphs of x f (y) and x g(y) andthe horizontal lines y c and y d.Version: Mitchell-2015/09/27.14:30:16
math 131application: area between curves86.4 More ExamplesHere are a few more examples of area calculations, this time involving integralsalong the y-axis.EXAMPLE 6.4.1. Find the area of the region in the first quadrant enclosed by the graphs ofx y2 and x y 2.The intersections of the two curves are easily determined:Solution.y2 y 2 ) y2y2 0 ) (y 1)(y2) 0 ) y 21, 2.Area beween f and g c[ f (y)g(y)] dy Z 21x y 21[y 2y2 ] dxy2 2y23 8 2 431 12 Figure 6.13: The region in the firstquadrant enclosed by the graphs ofx y2 and x y 2.2y3 x yIt is easy to sketch the region since one curve is a parabola and the other a straightline. See Figure 6.13. Since both the functions are continuous Theorem 6.3.1 applies.Z d. .2 . .12 3 9 .2EXAMPLE 6.4.2. Find the area of the region enclosed by the graphs of y arctan x, thex-axis, and x 1.Solution. The region is given to us in a way that simply requires sketchingarctan x. The area is described byArea Z 10arctan x dx.However, we don’t yet know an antiderivative for the arctangent function. Wecould develop that now (or look it up in a reference table), or we can switch thataxis of integration. Notice thaty arctan x () x tan y.The old limits were x 0 and x 1, so the new limits for y are arctan 0 0 andarctan 1 p4 . Notice the function x 1 is the ‘top’ curve and x tan y is the‘bottom’ curve (reading from left to right). Since both the functions are continuousTheorem 6.3.1 applies.Area Z p/40p40. . .y arctan x( x tan y)0 x 11Figure 6.14: The region in the firstquadrant enclosed by the graphs ofy arctan x, the x-axis, and x 1.Integrate along the y-axis and usex tan y.p/41tan y dy y p4ln sec y p ln 20(0ln 1) p41ln 2.2EXAMPLE 6.4.3. Find the area of the region enclosed by the three graphs y x2 , y 8x , andy 1. (The region is enclosed by all three curves at the same time.)Solution. Determine where the three curves meet:x2 8x ) x3 8 ) x 2.BetwCurves.texVersion: Mitchell-2015/09/27.14:30:16
math 131application: area between curvesx2 1 ) x 1 (not 1, see Figure 6.15).8x 1 ) x 8.Notice from Figure 6.15 that if we were to find the area by integrating along thex-axis, we would need to split the integral into two pieces because the top curveof the region changes at x 2. We can avoid the two integrations and all of thecorresponding evaluations by integrating along the y-axis. We need to convert thefunctions to functions of x in terms of y:y x2 ) x py and y 88)x .xyZ 481py y 1. . . . .x2. .8.x.y x 1 182Figure 6.15: The region enclosed by thethree graphs y x2 , y 8x , and y 1.Integrating along the y-axis uses only asingle integral.Remember to change the limits: At x 2, y 4 and at x 1 or x 8, y 1.pNotice the function x 8y is the ‘top’ curve and x y is the ‘bottom’ curve(reading from left to right). Since both the functions are continuous Theorem 6.3.1applies.Area 4942x3/23 1 16ln 13y dy 8 ln y 8 ln 423 8 ln 414.3YOU TRY IT 6.4. Redo Example 6.4.3 using integration along the x-axis. Verify that you getthe same answer. Which method seemed easier to you?YOU TRY IT 6.5. Set up the integrals that would be used to find the shaded areas boundedby the curves in the three regions below using integration along the y-axis. You will need touse appropriate notation for inverse functions, e.g., x f 1 (y).555x g(y) x f (y.).x g(y) x f (y.).44 .4.32103.Shaded0122x f (y)345106. . .321Shaded01234506. . .Shaded0123456YOU TRY IT 6.6. Sketch the regions for each of the following problems before finding theareas.(a) Find the area enclosed by x y2 1 and x 2y 9. Integrate along the y-axis.(b) Along the y-axis (more in the next problem). The area enclosed by y x 4 andy2 2x.p(c) Find the area in the first quadrant enclosed by the curves y x 1, y 3 x, thex-axis, and the y-axis by using definite integrals along the y-axis.p(d) Find the area of the wedge-shaped region below the curves y x 1, y 3 x, andabove the x-axis. Integrate along either axis: your choice!answer to you try it 6.6. (a) 36; (b) 18; (c) 10/3, if you get 9/2, you have the wrong region; (d)7/6, not the same as (b)).pSolution. We do part (c). The curves are easy to sketch; remember y x 1 ispthe graph of y x shifted to the right 1 unit. To integrate along the y axis, solvefor x in each equation.py x 1 ) y2 x 1 ) x y2 1y 3BetwCurves.texx)x 3yVersion: Mitchell-2015/09/27.14:30:16
math 131application: area between curves3 . y 3. .These curves intersect wheny2Of course x 3Area y y ) y2 y1 32 (y1)(y 2) 0 ) y 1 (not2).1y intersects the y-axis at 3. SoZ 10y2 1 dy Z 3131 3y0y2231010 .3px1 0y3y dy y310x 13Figurep 6.16: The region enclosed byy x 1, y 3 x, the x-axis andthe y-axis.YOU TRY IT 6.7. Sketch the region (use your calculator?) and find the area under y arcsin x on the interval [0, 1]. Hint: switch axes.1.answer to you try it 6.7. p/2webwork: Click to try Problems 81 through 82. Use guest login, if not in my course.YOU TRY IT 6.8. [From a test in a previous year] Consider the region bounded by y ln x,1 shown below. Find the area of this region.2 . . . .1y x00 1y ln xe23answer to you try it 6.8. e2y 2, and y x5.YOU TRY IT 6.9. Find the area of the region in the first quadrant enclosed by y 9py x x 1, and the y-axis. Hint: The two curves meet at the point (3, 6).YOU TRY IT 6.10. Find the region enclosed by the three curves y x2 , y x2and y 2xx,12x 48,1. You will need to find three intersections. . . . . . answer to you try it 6.10. 18.YOU TRY IT 6.11. Extra Fun.(a) (Easy.) The region R in the first quadrant enclosed by y x2 , the y-axis, and y 9 isshown in the graph on the left below. Find the area of R.(b) A horizontal line y k is drawn so that the region R is divided into two pieces ofequal area. Find the value of k. (See the graph on the right below). Hint: It might beeasier to integrate along the y-axis now.90.9k0.answer to you try it 6.11. (b) (13.5)2/3 .BetwCurves.texVersion: Mitchell-2015/09/27.14:30:16
math 131application: area between curves112YOU TRY IT 6.12. Let R be the region enclosed by y x, y x 1 , and the y axis in the firstquadrant. Find its area. Be careful to use the correct region: One edge is the y axis.YOU TRY IT 6.13. Two waysp(a) Find the area in the first quadrant enclosed by y xx-axis by integrating along the x-axis. Draw the figure.1, the line y 7x, and the(b) Do it instead by integrating along the y-axis.(c) Which method was easier for you?answer to you try it 6.13.223 .px, y 12 2x, and thex-axis in the first quadrant by integrating along the y axis. Be careful to use the correct region:One edge is the x axis.YOU TRY IT 6.14. Find the area of the region R enclosed by y panswer to you try it 6.14. 8.YOU TRY IT 6.15 (Good Problem, Good Review). Find the area in the first quadrant boundedby y x2 , y 2, the tangent to y x2 at x 2 and the x-axis. Find the tangent line equation. Draw the region. Does it make sense to integrate along the y-axis? Why? (Answer:23 .)answer to you try it 6.15.23.YOU TRY IT 6.16 (Extra Credit). Find the number k so that the horizontal line y k dividespthe area enclosed by y x, y 2, and the y axis into two equal pieces. Draw it first. Thisis easier if you integrate along the y axis.YOU TRY IT 6.17 (Real Extra Credit). There is a line y mx through the origin that divides thearea between the parabola y x x2 and the x axis into two equal regions. Find the slopeof this line. Draw it first. The answer is not a simple number.BetwCurves.texVersion: Mitchell-2015/09/27.14:30:16
math 131application: area between curves126.5 An Application of Area Between Curves to Economics: Lorenz CurvesDuring the 2012 presidential election, there was much talk about "the 1%" meaning"the wealthiest 1% of the people in the country," and the rest of us, "we are the99%." Such labels were intended to highlight the income and wealth inequality inthe United States. Consider the following from the New York Times. The top 1 percent of earners in a given year receives just under a fifth of the country’s pretax income, about double their share 30 years ago. (from tml The wealthiest 1 percent took in about 16 percent of overall income—8 percent ofthe money earned from salaries and wages, but 36 percent of the income earnedfrom self-employment. They controlled nearly a third of the nation’s financial assets (investment holdings)and about 28 percent of non-financial assets (the value of property, cars, jewelry,etc.). (See ring-the-top-1-by-wealth-not-income/)Statements such as "x% of the population has y% of the wealth in the country,"actually describe points on what economists call a Lorenz curve.DEFINITION 6.5.1. The Lorenz Curve L( x ) gives the proportion of the total income earnedby the lowest proportion x of the population. It can also be used to show distribution of assets (total wealth, rather than income). Economists consider it to be a measure of social inequality. It was developed by Max O. Lorenz in 1905 for representing inequality of the wealthdistribution.EXAMPLE 6.5.2. L(0.25) 0.10 would mea
Similarly, determine the area between two intersecting curves. Understand integration as an accumulation process. 6.1 Area of a Region Between Two Curves With just a few modifications, we extend the application of definite integrals from finding the area of a region under a curve to finding the area of a region between two curves.