Transcription
Silicon ValleyVenture Capital SurveySecond Quarter 2022
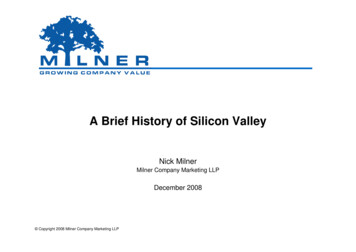
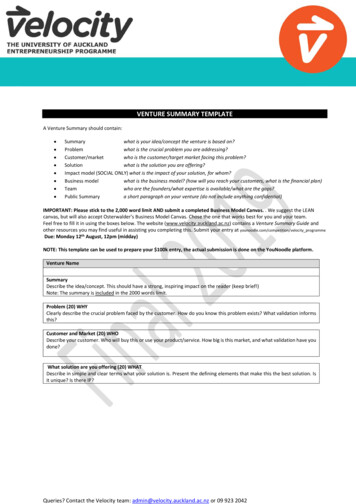
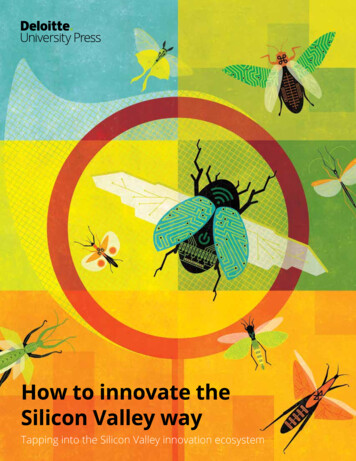
Silicon Valley Venture Capital Survey 2022Background Series C financings comprised highest percentage of Q2 down rounds (8%).Our survey analyzed the terms of 194 venture financings closed in the second quarter of2022 by companies headquartered in Silicon Valley. There have been no down rounds this year for Series D or higher financings, among thecompanies we analyzed.SummaryPrice changes showed more of a pullback in Q2While the number of venture financings were down in the second quarter compared to thefirst quarter of this year, for companies we analyzed the funding climate showed resiliencyacross several other metrics.Key FindingsNumber of Q2 2022 financings down, but compared historically, moresteady There were 194 venture financings among Silicon Valley companies in Q2—an 11%decrease from Q1 and a 32% decrease from Q4 2021. The number represents a 46%decrease year over year. However, compared to prior years, Q2 2022 financings were steadier: down 4.4% fromQ2 2020 and down 9.8% from Q2 2019. There was an increase in Series C and D financings, while early- and late-stagefinancings experienced the biggest declines from the prior quarter.Down rounds increased, but not by much Down rounds overall increased from 1% in Q1 to 5% in Q2 this year, while 4% were flat(versus 1% in Q1) and 91% were up rounds (versus 98% in Q1).SILICON VALLEY VENTURE CAPITAL SURVEY SECOND QUARTER 2022 While there were few down rounds, the median percentage price increase across allrounds of financing showed a pullback from Q1 to Q2, from 186% to 136%. Series D and E financings had the biggest price increase slowdowns in Q2 from the priorquarter. Series D financings had a 163% median price increase in Q1 versus 84% in Q2,and the median price increase for Series E financings slowed from 104% in Q1 to 49% inQ2. The Fenwick Venture Capital Barometer showed an average price increase of 174% inQ2, down from an average price increase of 253% in Q1—with Q1 representing a highwater mark since we began tracking in 2005.Life sciences sector showed strength in Q2; hardware faced headwinds Series B or higher life sciences companies’ average percentage price change increasedeach of the last three quarters, from 123% in Q4 2021 to 166% in Q2 of this year. Theirmedian percentage price change increased from 74% in Q1 to 123% in Q2. Hardware companies faced more headwinds, with the highest percentage of downrounds in Q2 among sectors (14%) and a median percentage increase in price per sharecompared to the prior round of financing of 53%—the only sector analyzed in Q2 notexperiencing a 100% or greater median price increase from round to round.2
Fenwick Data on Valuations
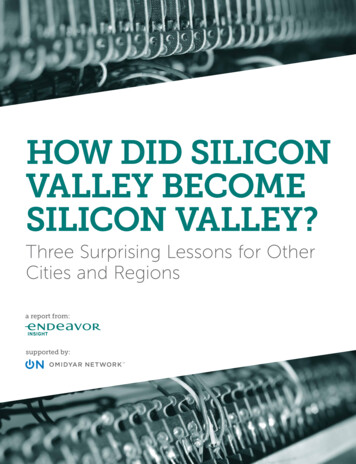
Price ChangePriceChangeUp!"# %&!!"!'# %&!(# %(# "!%# %(#%"&'"('"%"()" "Down&"%"'"Flat CHANGE—DIRECTION (("PRICEOF PRICE CHANGES WITH POST-SERIES A FINANCINGS COMPAREDTO THE COMPANIES’ PREVIOUS ROUND!"# %(!"# %&!'# %& "'"B#"#" "C')")"D("PERCENTAGE OF DOWN ROUNDS BROKEN OUT BY SERIES''"('"E and higherSeries&'"!(# %( "('"( "('"!%# %(%"()" "*"!"# %()" " %BCDE and higher15%10%8%20%5%5%10%5%4%0%Q3 '20Q4 '20Q1 '21Q2 '21Q3 '21Q4 '21Q1 '220%0%Q3 '20Q2 '22Q4 '20Q1 '21Q2 '21Q3 '21Q4 '21Q1 '220%Q2 '22Up 91%Q2Even 4%Down 5%20221SILICON VALLEY VENTURE CAPITAL SURVEY SECOND QUARTER 202214
Price Change (continued)Q2 '05Quarter54%60%59%65%60%69%74%Up Rounds PRICE CHANGE GRAPH—DIRECTIONEXPANDEDOF PRICE CHANGES WITH POST-SERIES A FINANCINGS COMPARED TO THE COMPANIES’ PREVIOUS ROUND31%28%31%31%26%19%14%Down Rounds15%12%10%4%15%12%11%Flat RoundsQ2 '0669%25%6%67%24%10%67%22%11%100%91%90%80%Average percentageof up rounds 70%60%Up RoundsDown RoundsEven Rounds50%40%30%20%10%5%4%SILICON VALLEY VENTURE CAPITAL SURVEY SECOND QUARTER e Axis70%5
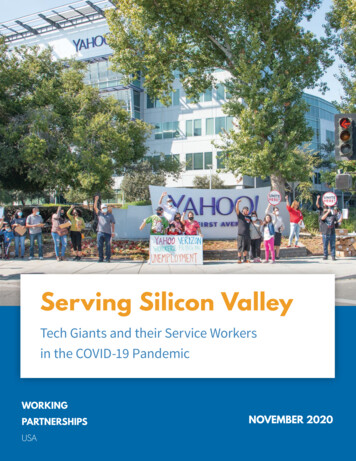
Percent ChangeUp roundsDown roundsNet resultMedian netThe Fenwick Venture Capital BarometerMAGNITUDE OF PRICE CHANGE—AVERAGE PERCENTAGE CHANGE BETWEEN THE PRICE PERSHARE AT WHICH COMPANIES RAISED FUNDS IN A QUARTER AND THE PRICE PER SHARE ATQ4OF'20FINANCING. CALCULATIONQ1 '21WHICH THE COMPANIES RAISED FUNDSQ3IN '20THEIR PRIOR ROUND125%MedianPercentagePrice ChangeINCLUDESALL ROUNDS(UP, DOWN AND 76%FLAT). RESULTS ARE NOTWEIGHTED BASED 145%ONAMOUNT RAISED IN THE FINANCING.300%Series B1.38-0.711.190.92TMQ3 '20101%B89%C50%DBAROMETER RESULTS BY SERIES39%E and higherQ2 '21Q3 '21186%190%SeriesQ4 '20159%91%167%83%Q1 0%0%Q3 '20Q4 '20Q1 '21Q2 '21Q3 '21Q4 '21Q1 '22Q2 '22Q2 60%40%20%0%169%123%BCDE 101%Q3 '20Q4 '20Q1 '21Q2 '21Q3 '21Q4 '21Q1 '22Q2 '221SILICON VALLEY VENTURE CAPITAL SURVEY SECOND QUARTER 202216
The Fenwick Venture Capital Barometer (continued)TMQ2 '05Q2 D FENWICK VENTURE CAPITAL BAROMETER —DIRECTION OF PRICE CHANGES WITH POST-SERIES A FINANCINGS COMPARED TO THE COMPANIES’ PREVIOUS %120%100%80%60%Average 68%40%20%SILICON VALLEY VENTURE CAPITAL SURVEY SECOND QUARTER 7
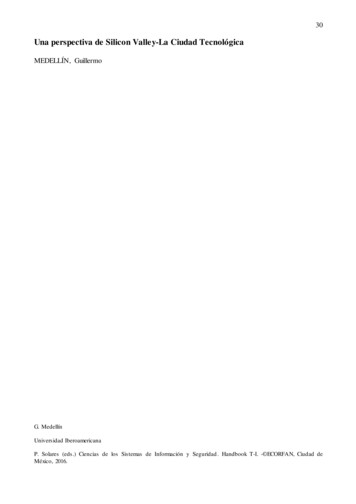
Percent ChangeSeries BMedian Percentage Price Change1.38-0.711.190.92Up roundsDown roundsNet resultMedian netMEDIAN PERCENTAGE PRICE CHANGE—MEDIAN PERCENTAGE CHANGE BETWEEN THE PRICEPER SHARE AT WHICH COMPANIES RAISED FUNDS IN A QUARTER AND THE PRICE PER SHAREAT WHICH COMPANIES RAISED FUNDS INOF '20FINANCING. CALCULATIONQ3THEIR'20 PRIOR ROUNDQ4Q1 '21INCLUDES ALL ROUNDS (UP, DOWN AND 42%FLAT). RESULTS ARE NOTWEIGHTEDBASEDON83%90%Median Percentage Price ChangeAMOUNT RAISED IN THE FINANCING.SeriesBCQ2 '21D140%E and higher200%300%180%270%160%240%140%136%Q3 '20Q4 '20Q1 '2155%106%41%95%63%99%MEDIAN PRICE CHANGEBY SERIES57% RESULTS127%100%48%31%Q3'2116%136%Q2 '21163%148%209%98%Q3 '21128%138%172%130%Q4 '21217%173%130%96%Q1 0%40%60%20%30%159%142%BCDE 84%49%0%Q3 '20Q4 '20Q1 '21Q2 '21Q3 '21Q4 '21Q1 '22Q2 '220%Q3 '20Q4 '20Q1 '21Q2 '21Q3 '21Q4 '21Q1 '22Q2 '221SILICON VALLEY VENTURE CAPITAL SURVEY SECOND QUARTER 20228Q215148449
Median Percentage Price Change (continued)Q2 '05QuarterMedian6%15%18%13%WE BEGAN CALCULATING33%EXPANDED MEDIAN PRICE CHANGE GRAPH—MEDIAN PERCENTAGE PRICE CHANGE FOR 29%EACH QUARTER SINCETHIS METRIC32%IN 2004Q2 age 37%40%20%SILICON VALLEY VENTURE CAPITAL SURVEY SECOND QUARTER %9
Industry ResultsAGGREGATE INDUSTRY RESULTS FOR QUARTER—RESULTS BROKEN DOWN BY COMPANIES’ INDUSTRY FORPOST-SERIES A FINANCINGSBAROMETER RESULTS BY INDUSTRY—AVERAGE PERCENTAGE CHANGE IN PRICE PER SHAREWHEN COMPANIES RAISED FUNDS COMPARED TO THE PRIOR ROUND OF FINANCING, BROKENOUT BY INDUSTRY DIRECTION OF PRICE CHANGES COMPARED TO THE PRIOR ROUND OF FINANCING (UP, DOWN AND FLAT) AVERAGE PERCENTAGE CHANGE IN PRICE PER SHARE WHEN COMPANIES RAISED FUNDS COMPARED TOTHE PRIOR ROUND OF FINANCINGIndustryQ3 '20Q4 '20Q1 '21Q2 '21Q3 '21Q4 '21Q1 '22Q2 '22 MEDIAN PERCENTAGE CHANGE IN PRICE PER SHARE WHEN COMPANIES RAISED FUNDS COMPARED TOTHE PRIOR ROUND OF ardware41%55%111%74%110%160%300%76%Life Sciences73%100%113%Q4 '20112%195%152%248%55% 304%115%100%145%132%186%157%123%Q1 tware91%5%5%191%142%85Hardware86%14%0%76%53%14Life Sciences95%0%5%166%123%20Internet/Digital , All Industries91%5%4%174%136%148Number ofFinancingsIndustryInternet/Digital MediaSoftwareHardwareOtherLife SciencesTotal, All IndustriesInternet/Digital MediaQ3 ICAL REPRESENTATION OF THE ABOVE DATA300%275%250%DOWN ROUND RESULTS BY INDUSTRY—PERCENT OF DOWN ROUNDS EACH QUARTER, BROKENOUT BY INDUSTRY225%Q4 '20Q1 '21Q2 '21Q3 '21Q4 '21Q1 '22Q2 2%13%27%18%0%14%Life Sciences8%5%11%4%14%10%8%0%Internet/Digital , All Industries12%5%10%6%8%4%1%5%SILICON VALLEY VENTURE CAPITAL SURVEY SECOND QUARTER 2022191%175%Q3 '20Down Rounds215%200%166%100%SoftwareHardwareLife SciencesInternet/Digital Media76%75%50%25%0%Q3 '20Q4 '20Q1 '21Q2 '21Q3 '21Q4 '21Q1 '22Q2 '2210
IndustrySoftwareIndustry Results (continued)HardwareLife SciencesInternet/Digital MediaMEDIAN PERCENTAGE PRICE CHANGE BY INDUSTRY—MEDIAN PERCENTAGE CHANGE IN PRICEPER SHARE WHEN COMPANIES RAISED FUNDS COMPARED TO THE PRIOR ROUND OF FINANCING,BROKEN OUT BY INDUSTRYQ3 '2051%23%48%42%Q4 '2096%40%76%118%Q1 '21101%69%48%121%Q2 '21167%50%56%175%Q31311GRAPHICAL REPRESENTATION OF THE DATA ON THE LEFT320%300%280%260%Median % PriceChangeQ3 '20Q4 '20Q1 '21Q2 '21Q3 '21Q4 '21Q1 '22Q2 3%40%69%50%33%112%306%53%Life l otal, All HardwareLife SciencesInternet/Digital Media123%120%100%80%60%53%40%20%0%Q3 '20Q4 '20Q1 '21Q2 '21Q3 '21Q4 '21Q1 '22Q2 '221SILICON VALLEY VENTURE CAPITAL SURVEY SECOND QUARTER 202211
Financing RoundsFINANCING ROUND—PERCENTAGE OF TOTAL FINANCINGS BROKEN DOWN BY SERIESSeriesQ3 '20Q4 '20Q1 '21Q2 '21Q3 '21Q4 '21Q1 '22Q2 '22Series A28%27%30%29%27%24%28%24%Series B26%25%27%31%28%28%30%32%Series C19%22%16%17%20%23%22%26%Series D9%12%12%9%12%13%8%10%Series E 18%14%16%14%13%13%12%8%SILICON VALLEY VENTURE CAPITAL SURVEY SECOND QUARTER 202212
Fenwick Data on Legal Terms
Q3 '2019%10%20%Q3 '2117%38%SeriesLiquidationQ3 '2021%Q4 '2014%BCD Q2 '21E and15%higherQ1 '2115%Liquidation by PreferenceSENIOR LIQUIDATION PREFERENCE—PERCENTAGE OF POST-SERIES A FINANCINGS WITHSENIOR LIQUIDATION PREFERENCE (LIMITED TO SERIES B THRU E )Q4 '209%20%11%15%Q1 '219%17%10%29%Q2 '217%19%13%28%Q3 '217%19%23%12%PERCENTAGE OF SENIOR LIQUIDATION PREFERENCES BY %10%BCDE 5%0%0%Q3 '20Q4 '20Q1 '21Q2 '21Q3 '21Q4 '21Q1 '22Q3 '20Q2 '22Q4 '20Q1 '21Q2 '21Q3 '21Q4 '21Q1 '22Q2 '2211SILICON VALLEY VENTURE CAPITAL SURVEY SECOND QUARTER 202214
Liquidation (continued)Q3 '206%Q4 '2030%Q1 '2111%LIQUIDATION PREFERENCESENIOR LIQUIDATION PREFERENCE WITH MULTIPLE—PERCENTAGE OF FINANCINGS WITH ASENIOR LIQUIDATION PREFERENCE THAT INCLUDED A MULTIPLE GREATER THAN 1Q2 '213%Q3 '2112%RANGE OF MULTIPLES—PERCENTAGE OF FINANCINGS WITH A SENIOR LIQUIDATION PREFERENCE THATINCLUDED A MULTIPLE WITHIN THE SPECIFIED RANGE100%30% 1x – 2x 2x – 3x25%75%20%15%100%50%10%5%4%25%0%Q3 '20Q4 '20Q1 '21Q2 '21Q3 '21Q4 '21Q1 '22Q2 '220%Q3 '20Q4 '20Q1 '21Q2 '21Q3 '21Q4 '21Q1 '22Q2 '2212SILICON VALLEY VENTURE CAPITAL SURVEY SECOND QUARTER 202215
Liquidation (continued)Q3 '2011%Q4 '204%Q1 '215%Q2 '215% UncappedParticipation in LiquidationPARTICIPATION IN LIQUIDATION—PERCENTAGE OF FINANCINGS THAT PROVIDED FORPARTICIPATION IN LIQUIDATION (INCLUDES ALL SERIES A THRU E )Q3 '2052%Q3 '213%Q4 '2050%Q1 '2154%Q2 '2144%NO CAPPED PARTICIPATION IN LIQUIDATION—PERCENTAGE OF FINANCINGS THAT PROVIDEDFOR PARTICIPATION IN LIQUIDATION THAT WERE NOT CAPPED (INCLUDES ALL SERIES A THRU E )15%100%75%75%10%50%5%25%2%0%Q3 '20Q4 '20Q1 '21Q2 '21Q3 '21Q4 '21Q1 '220%Q2 '22Q3 '20Q4 '20Q1 '21Q2 '21Q3 '21Q4 '21Q1 '22Q2 '221SILICON VALLEY VENTURE CAPITAL SURVEY SECOND QUARTER 202216
Other TermsQ3 '204%CUMMULATIVE DIVIDENDSQ4 '204%Q1 '215%Q2 '213%CUMULATIVE DIVIDENDS—PERCENTAGE OF FINANCINGS THAT INCLUDED CUMULATIVEQ3 '213%Q3 '20Q4 '20Q1 '21Q2 '21DIVIDENDS (INCLUDES ALL ROUNDS SERIES A THRU E )REDEMPTION—PERCENTAGE OF FINANCINGSTHAT PROVIDED4%3% FOR MANDATORY4%REDEMPTION OR 4%REDEMPTIONREDEMPTION AT THE OPTION OF THE INVESTOR (INCLUDES ALL ROUNDS SERIES A THRU E )5%5%4%4%3%3%2%2%2%2%1%1%0%0%Q3 '20Q4 '20Q1 '21Q2 '21Q3 '21Q4 '21Q1 '22Q3 '20Q2 '221SILICON VALLEY VENTURE CAPITAL SURVEY SECOND QUARTER 2022Q4 '20Q1 '21Q2 '21Q3 '21Q4 '21Q1 '22Q2 '22117
Other Terms (continued)NON-IPO ANTIDILUTION PROVISIONS—PERCENTAGE OF FINANCINGS THAT INCLUDED NONIPO ANTIDILUTION PROVISIONS (INCLUDES ALL ROUNDS SERIES A THRU E ) FOCUSED ONNON-IPO ANTIDILUTION PROVISIONS THAT PROTECT THE INVESTOR AGAINST A FUTUREVENTURE FINANCING AT A PRICE BELOW WHAT THE INVESTOR PAID. DOES NOT REFLECTANTIDILUTION PROVISIONS DESIGNED TO PROTECT AGAINST AN IPO AT A PRICE BELOW THEPRICE PAID BY THE VENTURE INVESTOR, SUCH AS AN IPO RATCHET.100%NoneWeighted AverageRatchetIPO DOWNSIDE PROTECTIONS—PERCENTAGE OF FINANCINGS THAT INCLUDED IPO DOWNSIDEPROTECTIONS (INCLUDES ALL ROUNDS SERIES A THRU E )50%1%40%75%30%100%50%20%38%25%10%0%Q3 '20Q4 '20Q1 '21Q2 '21Q3 '21Q4 '21Q1 '220%Q2 '22Q3 '20Q4 '20Q1 '21Q2 '21Q3 '21Q4 '21Q1 '22Q2 '22Ratchet: Investors receive additional shares if IPO price is less than financingprice or, in some cases, the financing price plus a premium2SILICON VALLEY VENTURE CAPITAL SURVEY SECOND QUARTER 2022Blocking Right: IPO price must be at least as high as financing price18
Q3 '20Other Terms (continued)Q3 '20Q4 '20Q1 '21PAY-TO-PLAY PROVISIONS—PERCENTAGE OF FINANCINGS THAT INCLUDED PAY-TO-PLAY3%2%1%TOTAL ALL SERIESPROVISIONSPROVIDING FOR CONVERSION OF NON-PARTICIPATING INVESTORS’ PREFERRED STOCKINTO COMMON STOCK OR SHADOW PREFERRED STOCKQ4 '20Q1 '21CORPORATE REORGANIZATION—PERCENTAGEOF FINANCINGS4%3% INVOLVING CORPORATE3%REDEMPTIONREORGANIZATIONQ2 '213%5%Q3 '218%4%10%3%8%2%2%6%1%4%4%0%Q3 '20Q4 '21Q2 '22Q3 '20 Q3 '21Q4 '20 Q1 '22Q1 '2110%10%10% GSWITHDUAL-CLASSREDEMPTION2%Q4 '20Q1 '21Q2 '21Q2 '217%STOCK STRUCTURES WHERE ONE CLASS OF COMMON STOCK HOLDS MORE VOTES PER SHARETHAN THE OTHER CLASS0%Q3 '20Q4 '20Q1 '21Q2 '21Q3 '21Q4 '21Q1 '22Q2 '2210%8%8%6%4%2%0%Q3 '20SILICON VALLEY VENTURE CAPITAL SURVEY SECOND QUARTER 20223Q4 '20Q1 '21Q2 '21Q3 '21Q4 '21Q1 '22Q2 '2219
AuthorsFenwick’s Startup & Venture Capital TeamFenwick is one of the first technology law firms in the world. For 50 years,we have worked closely with technology and life sciences companies thatare changing the world, as well as their investors. Fenwick provides a broadrange of services to emerging companies. We currently represent 1,000 VC-backed companies, including 75 with valuations over 1B. Our VCpractice is ranked as one of the top in the U.S. by Dow Jones and ChambersCynthia Clarfield HessMark LeahyCo-ChairStartup & Venture Capitalchess@fenwick.comCo-ChairStartup & Venture Capitalmleahy@fenwick.comFull BioFull BioUSA. Our VC-backed clients include many of the world’s most notable privatetechnology companies, for which the firm has advised in some of the largestventure capital deals in history.Representative Venture-Backed ClientsThe Fenwick Team is “first class through andthrough. They are the best in the business fora fast-moving startup.”–Chambers USA20
About Our SurveyMethodologyThe Fenwick Venture Capital Survey has been published quarterly since the firstquarter of 2002. Its goal is to provide information to the global entrepreneurial andventure community on the terms of venture financings in Silicon Valley.When interpreting the Barometer results, please bear in mind that the results reflectthe average price increase of companies raising money in a given quarter comparedto their prior round of financing. By definition the Barometer does not includecompanies that do not do follow-on financings (which may be because they went outof business, were acquired or went public). Accordingly, we believe that our resultsare most valuable for identifying trends in the venture environment, as opposed tocalculating absolute venture returns. Please also note that our calculations are not“dollar weighted,” i.e., all venture rounds are treated equally, regardless of size.The survey is available to all, without charge, by signing up at www.fenwick.com/subscribe. We are pleased to be a source of information to entrepreneurs, investors,educators, students, journalists and government officials.Our analysis of Silicon Valley financings is based on independent data collectionperformed by our lawyers and paralegals, and is not skewed toward or overlyrepresentative of financings in which our firm is involved. We believe that thisapproach, compared to only reporting on deals handled by a specific firm, providesa more statistically valid dataset.For purposes of determining whether a company is based in “Silicon Valley,” we usethe area code of the corporate headquarters. The area codes included are 650, 408,415, 510, 925, 916, 707, 831 and 209.DisclaimerContact/Sign-Up InformationThe preparation of the information contained herein involves assumptions,compilations and analysis, and there can be no assurance that the informationprovided herein is error-free. Neither Fenwick & West LLP nor any of its partners,associates, staff or agents shall have any liability for any information contained herein,including any errors or incompleteness. The contents of this report are not intended,and should not be considered, as legal advice or opinion. To the extent that any viewson the venture environment or other matters are expressed in this survey, they are theviews of the authors only, and not Fenwick & West LLP.For additional information about this report, please contact Cynthia Hess at 650.335.7238;chess@fenwick.com or Mark Leahy at 650.335.7682; mleahy@fenwick.com at Fenwick.SILICON VALLEY VENTURE CAPITAL SURVEY SECOND QUARTER 2022To view the most recent survey, please visit fenwick.com/vcsurvey. To be placed on anemail list for future editions of this survey, please visit www.fenwick.com/subscribe. 2022 Fenwick & West LLP21
2022 by companies headquartered in Silicon Valley. Summary While the number of venture financings were down in the second quarter compared to the first quarter of this year, for companies we analyzed the funding climate showed resiliency across several other metrics. Key Findings Number of Q2 2022 financings down, but compared historically, more