Transcription
SECURITIES AND EXCHANGE COMMISSIONFORM 485APOSPost-effective amendments [Rule 485(a)]Filing Date: 1997-04-18SEC Accession No. 0000893220-97-000796(HTML Version on secdatabase.com)FILERVANGUARD/WELLESLEY INCOME FUND INCCIK:105544 IRS No.: 231711688 Fiscal Year End: 1231Type: 485APOS Act: 33 File No.: 002-31333 Film No.: 97583714Mailing Address19482Copyright 2012 www.secdatabase.com. All Rights Reserved.Please Consider the Environment Before Printing This DocumentBusiness AddressPO BOX 2600VM #V34VALLEY FORGE PA 19482610-669-6289
1 SECURITIES AND EXCHANGE COMMISSIONWASHINGTON, D.C. 20549FORM N-1AREGISTRATION STATEMENT (NO. 2-31333) UNDERTHE SECURITIES ACT OF 1933PRE-EFFECTIVE AMENDMENT NO.POST-EFFECTIVE AMENDMENT NO. 45AND[X][X]REGISTRATION STATEMENT UNDER THE INVESTMENT COMPANYACT OF 1940AMENDMENT NO. 45VANGUARD/WELLESLEY INCOME FUND, INC.(EXACT NAME OF REGISTRANT AS SPECIFIED IN CHARTER)[X]P.O. BOX 2600, VALLEY FORGE, PA 19482(ADDRESS OF PRINCIPAL EXECUTIVE OFFICE)REGISTRANT'S TELEPHONE NUMBER (610) 669-1000RAYMOND J. KLAPINSKY, ESQUIREP.O. BOX 876VALLEY FORGE, PA 19482IT IS PROPOSED THAT THIS FILING BECOME EFFECTIVE:on April 25, 1997, pursuant to paragraph (a) of Rule 485.APPROXIMATE DATE OF PROPOSED PUBLIC OFFERING:As soon as practicable after this Registration Statement becomes effective.WE HAVE ELECTED TO REGISTER AN INDEFINITE NUMBER OF SHARES PURSUANT TOREGULATION 24f-2 UNDER THE INVESTMENT COMPANY ACT OF 1940. WE FILED OUR RULE24f-2 NOTICE FOR THE YEAR ENDED DECEMBER 31, 1996 ON FEBRUARY 26, 1997. 2VANGUARD/WELLESLEY INCOME FUND, INC.CROSS REFERENCE SHEET TABLE CAPTION FORM N-1AITEM NUMBER C 1.2.3.4. S Cover Page.Synopsis.Condensed Financial Information.General Description of Registrant.Item 5.Management of the Fund.Item 6.Capital Stock and Other Securities.Item 7.Item 8.Item 9.Purchase of Securities Being Offered.Redemption or Repurchase.Pending Legal Proceedings.ItemItemItemItemLOCATION IN PROSPECTUS C Cover PageNot ApplicableFinancial Highlights; Fund ExpensesThe Fund's Objective; Who ShouldInvest; Investment Strategies;Investment Limitations; InvestmentPolicies; Investment Performance;General InformationThe Fund and Vanguard; InvestmentAdviserBuying Shares; Redeeming Shares; TheFund's Share Price; Dividends,Capital Gains, and Taxes;Distribution Options; GeneralInformationBuying SharesRedeeming SharesNot Applicable CAPTION FORM N-1AITEM NUMBER C Item 10.Item 11.Item 12.LOCATION IN STATEMENTOF ADDITIONAL INFORMATION S Cover Page.Table of Contents.General Information and History. C Cover PageCover PageInvestment Objective; InvestmentPolicies; General InformationCopyright 2012 www.secdatabase.com. All Rights Reserved.Please Consider the Environment Before Printing This Document
Item 13.Investment Objective and Policies.Item 14.Management of the Fund.Item 15.Control Persons and Principal Holders ofSecurities.Item 16.Investment Advisory and Other Services.Item 17.Item 18.Brokerage Allocation.Capital Stock and Other Securities.Item 19.Purchase, Redemption and Pricing of SecuritiesBeing Offered.Item 20.Item 21.Item 22.Item 23. /TABLE Tax Status.Underwriters.Calculations of Yield Quotations of MoneyMarket Fund.Financial Statements.Investment Objective; InvestmentPolicies; Investment LimitationsManagement of the Fund; InvestmentAdvisory ServicesManagement of the Fund; GeneralInformationManagement of the Fund; InvestmentAdvisory ServicesNot ApplicableGeneral Information; FinancialStatementsPurchase of Shares; Redemption ofSharesAppendixNot ApplicableNot ApplicableFinancial Statements3VANGUARD/WELLESLEY INCOMEFUNDProspectusApril 25, 1997---------This prospectuscontains financial datafor the Fund throughthe fiscal year endedDecember 31, 1996.[VANGUARD LOGO]4VANGUARD/WELLESLEY INCOME FUNDAn Income Mutual FundCONTENTSFund Expenses2Financial Highlights3A Word About Risk4The Fund's Objectives4Who Should Invest4Investment Strategy5Investment nce10Share Price11Dividends, CapitalGains, and Taxes11The Fund andVanguard12Investment Adviser12General Information13Investingwith Vanguard15Copyright 2012 www.secdatabase.com. All Rights Reserved.Please Consider the Environment Before Printing This Document
Services andAccount Features15Types of Accounts16Distribution Options17Buying Shares17Redeeming Shares19Fund and AccountUpdates21Prospectus Postscript23Risk Quiz24GlossaryInside Back CoverINVESTMENT OBJECTIVES AND POLICIESVanguard/Wellesley Income Fund, Inc. (the "Fund") is an open-end diversifiedinvestment company, or mutual fund.The Fund seeks to provide a high and sustainable level of income along withmoderate long-term capital growth by investing approximately 60% to 70% of itsassets in high-quality, longer-term corporate, U.S. Treasury, government agency,and mortgage-backed bonds. The remaining 30% to 40% of Fund assets are investedin stocks of companies that have a history of above-average dividends orexpectations of increasing dividends.IT IS IMPORTANT TO NOTE THAT THE FUND'S SHARES ARE NOT GUARANTEED OR INSUREDBY THE FDIC OR ANY OTHER AGENCY OF THE U.S. GOVERNMENT. AS WITH ANY INVESTMENTIN BONDS (WHICH ARE SENSITIVE TO CHANGES IN INTEREST RATES) AND STOCKS (WHICHARE SUBJECT TO WIDE FLUCTUATIONS IN MARKET VALUE), YOU COULD LOSE MONEY BYINVESTING IN THE FUND.FEES AND EXPENSESThe Fund is offered on a no-load basis, which means that you pay no salescommissions or 12b-1 marketing fees. You will, however, incur expenses forinvestment advisory, management, administrative, and distribution services,which are included in the expense ratio.ADDITIONAL INFORMATION ABOUT THE FUNDA Statement of Additional Information (dated April 25, 1997) containing moreinformation about the Fund is, by reference, part of this prospectus and may beobtained without charge by writing to Vanguard or by calling our InvestorInformation Department at 1-800-662-7447.WHY READING THIS PROSPECTUS IS IMPORTANTThis prospectus explains the objectives, risks, and strategies ofVanguard/Wellesley Income Fund. To highlight terms and concepts important tomutual fund investors, we have provided "Plain Talk" explanations along the way.Reading the prospectus will help you to decide whether the Fund is the rightinvestment for you. We suggest that you keep it for future reference.These securities have not been approved or disapproved by the Securities andExchange Commission or any state securities commission, nor has the Securitiesand Exchange Commission or any state commission passed upon the accuracy oradequacy of this prospectus. Any representation to the contrary is a criminaloffense.5PORTFOLIO PROFILEVanguard/Wellesley Income FundWHO SHOULD INVEST (page 4)-Investors seeking a balanced mutual fund as part of a diversified investmentprogram.-Investors seeking current income along with moderate capital growth andwilling to invest for the long term--at least five years.WHO SHOULD NOT INVESTCopyright 2012 www.secdatabase.com. All Rights Reserved.Please Consider the Environment Before Printing This Document
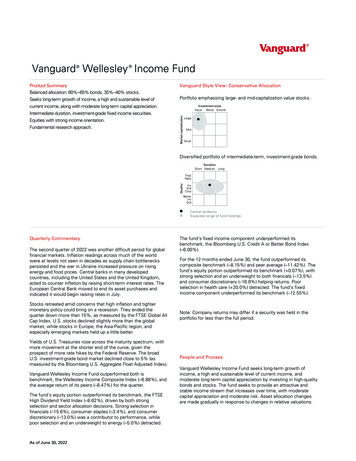
-Investors seeking a fund that invests exclusively in either stocks or inbonds.-Investors unwilling to accept significant fluctuations in share price.RISKS OF THE FUND (pages 4-9)The Fund's total return will fluctuate within a wide range, so an investor couldlose money over short or even extended periods. The Fund is subject to--amongother risks--interest rate risk (the chance that bond prices will declinebecause of rising interest rates) and stock market risk (the chance that stockprices in general will decline, sometimes suddenly and sharply).DIVIDENDS AND CAPITAL GAINS (page 11)Dividends are paid in March, June, September, and December. Capital gains, ifany, are paid in December.INVESTMENT ADVISER (page 12)Wellington Management Company, LLP,Boston, MA.INCEPTION DATE: July 1, 1970NET ASSETS AS OF 12/31/96: 7.01 billionFUND'S EXPENSE RATIO FOR THEYEAR ENDED 12/31/96: 0.31%LOADS, 12B-1 MARKETING FEES: NoneSUITABLE FOR IRAs: YesMINIMUM INITIAL INVESTMENT: 3,000; 1,000 for IRAs and custodial accounts forminorsNEWSPAPER ABBREVIATION: WellslVANGUARD FUND NUMBER: 027ACCOUNT FEATURES (page 15)-Telephone Redemption-Vanguard Direct Deposit Service(sm)-Vanguard Automatic Exchange Service(sm)-Vanguard Fund Express(R)-Vanguard Dividend Express(sm)AVERAGE ANNUAL TOTAL RETURNS-PERIODS ENDED DECEMBER 31, 1996 TABLE CAPTION S Wellesley Income FundComposite Index* /TABLE 1 YEAR5 YEARS10 YEARS-------------------------------- C C C 9.4%10.9%11.1%6.810.811.2QUARTERLY RETURNS (%) 1987-1996 (intended to show volatility of returns)[GRAPH]*The Composite Index is made up of 65% bonds and 35% stocks. See page 10 fordetails.In evaluating past performance, remember that it is not indicative of futureperformance. Performance figures include the reinvestment of any dividends andcapital gains distributions. The returns shown are net of expenses for the Fund,but they do not reflect income taxes an investor would have incurred. TheComposite Index is a theoretical portfolio, incurring none of the advisory fees,operating expenses, and portfolio transaction costs that are borne by anoperating mutual fund. Note, too, that both the return and principal value of aninvestment will fluctuate so that investors' shares, when redeemed, may be worthmore or less than their original cost.1Copyright 2012 www.secdatabase.com. All Rights Reserved.Please Consider the Environment Before Printing This Document
6PLAIN TALK ABOUTTHE COSTS OF INVESTINGCosts are an important consideration in choosing a mutual fund. That's becauseyou, as a shareholder, pay the costs of operating a fund, plus any transactioncosts associated with buying, selling, or exchanging shares. These costs canerode a substantial portion of the gross income or capital appreciation a fundachieves. Even seemingly small differences in fund expenses can, over time, havea dramatic impact on a fund's performance.PLAIN TALK ABOUTFUND EXPENSESAll mutual funds have operating expenses. These expenses, which are deductedfrom a fund's gross income, are expressed as a percentage of the net assets ofthe fund. Vanguard/Wellesley Income Fund's expense ratio in fiscal year 1996 was0.31%, or 3.10 per 1,000 of average net assets. The average balanced mutualfund had expenses in 1996 of 1.32%, or 13.20 per 1,000 of average net assets,according to Lipper Analytical Services, Inc., which reports on the mutual fundindustry.FUND EXPENSESThe examples below are designed to help you understand the various costs youwould bear, directly or indirectly, as an investor in the Fund.As noted in this table, you do not pay fees of any kind when you buy, sell,or exchange shares of the Fund:SHAREHOLDER TRANSACTION EXPENSES TABLE S Sales Load Imposed on Purchases:Sales Load Imposed on Reinvested Dividends:Redemption Fees:Exchange Fees: /TABLE C NoneNoneNoneNoneThe next table illustrates the operating expenses that you would incur as ashareholder of the Fund. These expenses are deducted from the Fund's incomebefore it is paid to you. Expenses include investment advisory fees as well asthe costs of maintaining accounts, administering the Fund, providing shareholderservices, and other activities. The expenses shown in the table are for thefiscal year ended December 31, 1996.ANNUAL FUND OPERATING EXPENSES TABLE S Management and Administrative Expenses:Investment Advisory Expenses:12b-1 Marketing Fees:Other ExpensesMarketing and Distribution Costs:Miscellaneous Expenses (e.g., Taxes, Auditing): C C 0.23%0.05%None0.02%0.01%----Total Other Expenses:0.03%---0.31% Total Operating Expenses (Expense Ratio): /TABLE The following example illustrates the hypothetical expenses that you wouldincur on a 1,000 investment over various periods. The example assumes (1) thatthe Fund provides a return of 5% a year and (2) that you redeem your investmentat the end of each period. TABLE CAPTION 1 YEAR3 YEARS5 YEARS10 -------- S C C C 3 10 17 39 /TABLE THIS EXAMPLE SHOULD NOT BE CONSIDERED A REPRESENTATION OF ACTUAL EXPENSES ORPERFORMANCE FROM THE PAST OR FOR THE FUTURE, WHICH MAY BE HIGHER OR LOWER THANTHOSE SHOWN.Copyright 2012 www.secdatabase.com. All Rights Reserved.Please Consider the Environment Before Printing This Document
27FINANCIAL HIGHLIGHTSThe following financial highlights table shows the results for a shareoutstanding for each of the last ten years ended December 31, 1996. Thefinancial highlights were audited by Price Waterhouse LLP, independentaccountants. You should read this information in conjunction with the Fund'sfinancial statements and accompanying notes, which appear, along with the auditreport from Price Waterhouse, in the Fund's most recent Annual Report toshareholders. The Annual Report is incorporated by reference in the Statement ofAdditional Information and in this prospectus, and contains a more completediscussion of the Fund's performance. You may have the Report sent to youwithout charge by writing to Vanguard or by calling our Investor InformationDepartment. TABLE CAPTION S NET ASSET VALUE,BEGINNING OF PERIODINVESTMENT OPERATIONSNet Investment IncomeNet Realized andUnrealized Gain (Loss)on InvestmentsYEAR ENDED DECEMBER ----------------------------------------------- C C C C C C 20.44 17.05 19.24 18.16 18.08 --------------------------TOTAL FROM dends from NetInvestment tions fromRealized Capital ------------------------------------------TOTAL -------------------------------------NET ASSET VALUE,END OF PERIOD 20.51 20.44 17.05 19.24 18.16 18.08 TOTAL RETURN9.42%28.91%-4.44%14.65%8.67%21.57% RATIOS/SUPPLEMENTAL DATANet Assets, End ofPeriod (Millions) 7,013 7,181 5,681 6,011 3,178 1,934Ratio of Expenses toAverage Net Assets0.31%0.35%0.34%0.33%0.35%0.40%Ratio of Net InvestmentIncome to AverageNet Assets5.74%5.96%6.16%5.79%6.50%7.08%Portfolio Turnover %Average CommissionRate ------------ CAPTION S NET ASSET VALUE,BEGINNING OF PERIODINVESTMENT OPERATIONSNet Investment IncomeNet Realized andUnrealized Gain (Loss)on InvestmentsYEAR ENDED DECEMBER 19881987--------------------------------------- C C C C 16.82 15.26 14.57 ------------------TOTAL FROM -Copyright 2012 www.secdatabase.com. All Rights Reserved.Please Consider the Environment Before Printing This Document
DISTRIBUTIONSDividends from NetInvestment IncomeDistributions fromRealized Capital ----------------------------------TOTAL --NET ASSET VALUE,END OF PERIOD 16.02 16.82 15.26 14.57 TOTAL RETURN3.76%20.93%13.61%-1.92% RATIOS/SUPPLEMENTAL DATANet Assets, End ofPeriod (Millions) 1,022 788 567 495Ratio of Expenses toAverage Net Assets0.45%0.45%0.51%0.49%Ratio of Net InvestmentIncome to AverageNet Assets7.77%7.68%8.14%7.83%Portfolio Turnover RateBonds13%11%19%48%Stocks12%10%19%27%Average CommissionRate ------------------------------- /TABLE From time to time, the Vanguard funds may advertise yield and total returnfigures. Yield is an historical measure of dividend income, and total return isa measure of past dividend income (assuming that it has been reinvested) pluscapital appreciation. Neither yield nor total return should be used to predictthe future performance of a fund.PLAIN TALK ABOUTHOW TO READ THE FINANCIAL HIGHLIGHTS TABLEThe Fund began fiscal 1996 with a net asset value (price) of 20.44 per share.During the year, the Fund earned 1.17 per share from investment income(interest and dividends) and 0.66 per share from investments that hadappreciated in value or that were sold for higher prices than the Fund paid forthem. Of those total earnings of 1.83 per share, 1.76 per share was returnedto shareholders in the form of distributions ( 1.76 in dividends, 0.60 incapital gains). The earnings ( 1.83 per share) less distributions ( 1.76 pershare) resulted in a share price of 20.51 at the end of the year, an increaseof 0.07 per share (from 20.44 at the beginning of the period to 20.51 at theend of the period). Assuming that the shareholder had reinvested thedistributions in the purchase of more shares, total return from the Fund was9.42% for the year.As of December 31, 1996, the Fund had 7.01 billion in net assets; an expenseratio of 0.31% ( 3.10 per 1,000 of net assets); and net investment incomeamounting to 5.74% of average net assets. It sold and replaced bonds valued at29% of its bond holdings and stocks valued at 18% of its stock holdings.38PLAIN TALK ABOUTBALANCED FUNDSBalanced funds are "middle-of-the-road" investments that seek to provide somecombination of income, growth, and conservation of principal by investing in amix of stocks, bonds, and/or money market instruments. Because stocks and bondstend to move in different directions, balanced funds are able to use the rewardsfrom one type of investment to help offset the risks from another.PLAIN TALK ABOUTCOSTS AND MARKET TIMINGSome investors try to profit from "market timing"--switching money intoinvestments when they expect prices to rise, and taking money out when theyexpect the market to fall. As money is shifted in and out, a fund incursexpenses for buying and selling securities. These costs are borne by all fundshareholders, including long-term investors who do not generate the costs.Therefore, the Fund discourages short-term trading by, among other things,limiting the number of exchanges it permits.A WORD ABOUT RISKCopyright 2012 www.secdatabase.com. All Rights Reserved.Please Consider the Environment Before Printing This Document
This prospectus describes the risks you will face as an investor inVanguard/Wellesley Income Fund. It is important to keep in mind one of the mainaxioms of investing: the higher the risk of losing money, the higher thepotential reward. The reverse, also, is generally true: the lower the risk, thelower the potential reward. However, as you consider an investment in WellesleyIncome Fund, you should also take into account your personal tolerance for thedaily fluctuations of both the bond and stock markets, as well as your need forcurrent income.Look for this "warning flag" symbol [FLAG] throughout the prospectus. It isused to mark detailed information about each type of risk that you, as ashareholder of the Fund, will confront.THE FUND'S OBJECTIVESThe Fund seeks to provide a high and sustainable level of income along withmoderate capital growth. These objectives are not fundamental, which means thatthey can be changed by the Fund's board of directors without shareholderapproval. However, before making any important change in its objectives, theFund will give shareholders 30-days notice, in writing.[FLAG]BECAUSE OF THE SEVERAL TYPES OF RISK DESCRIBED ON THE FOLLOWING PAGES,YOUR INVESTMENT IN THE FUND, AS WITH ANY INVESTMENT IN BONDS ANDSTOCKS, COULD LOSE MONEY.WHO SHOULD INVESTThe Fund may be a suitable investment for you if:-Your primary investment goal is income.-You wish to add an income fund to your existing holdings, which could includeother stock and bond--as well as money market and tax-exempt--investments.-You want a simple way to invest in a relatively fixed percentage of bonds andstocks.-You are looking for moderate growth of capital over the long term--at leastfive years.This Fund is not an appropriate investment if you are a market-timer.Investors who engage in excessive in-and-out trading activity generateadditional costs that are borne by all of the Fund shareholders. To minimizesuch costs, which reduce the ultimate returns achieved by you and othershareholders, the Fund has adopted the following policies:-The Fund reserves the right to reject any purchase request--includingexchanges from other Vanguard funds--that it49regards as disruptive to the efficient management of the Fund. This could bebecause of the timing of the investment or because of a history of excessivetrading by the investor.-There is a limit on the number of times you can exchange into or out of theFund (see "Redeeming Shares" in the INVESTING WITH VANGUARD section).-The Fund reserves the right to stop offering shares at any time.INVESTMENT STRATEGYThis section explains how Wellesley Income Fund's investment adviser pursues theobjectives of income and moderate capital growth. It also explains importantrisks--interest rate risk, stock market risk, manager risk, credit risk, callrisk, and prepayment risk--faced by investors in the Fund. Like the Fund'sobjectives, the adviser's investment strategies are not fundamental and can bechanged by the Fund's board of directors without shareholder approval. However,before making any important change in its strategy, the Fund will giveshareholders 30-days notice, in writing.MARKET EXPOSUREBONDSThe Fund invests approximately two-thirds of its assets in bonds.[FLAG]THE FUND IS SUBJECT TO INTEREST RATE RISK, WHICH IS THE POSSIBILITYTHAT BOND PRICES OVERALL WILL DECLINE OVER SHORT OR EVEN EXTENDEDCopyright 2012 www.secdatabase.com. All Rights Reserved.Please Consider the Environment Before Printing This Document
PERIODS DUE TO RISING INTEREST RATES. INTEREST RATE RISK SHOULD BEMODEST FOR SHORTER-TERM BONDS AND HIGH FOR LONGER-TERM BONDS.In the past, bond investors have seen the value of their investment rise andfall--sometimes significantly--with changes in interest rates. Between December1976 and September 1981, for instance, rising interest rates caused the price oflong-term bonds to fall by almost 48%.Because of the Fund's emphasis on bonds, changes in interest rates will havea significant impact on the Fund's assets. To illustrate how much of an impact,the following table shows the effect of a 2% change (both up and down) ininterest rates on three 1,000 bonds, each with a different maturity. TABLE CAPTION --------------HOW INTEREST RATE CHANGES AFFECT --------------------VALUE OF A 1,000 BOND---------------------------AFTER AAFTER AMATURITY2% INCREASE2% ---------------------- S C C Short-Term (2.5 years) 956 1,046Intermediate-Term (10 years) 870 1,156Long-Term (20 years) 816 ------------------- /TABLE *Assumes a 7% yield.PLAIN TALK ABOUTBONDS AND INTEREST RATESWhen interest rates rise, bond prices fall. The opposite is also true: Bondprices go up when interest rates fall. Why do bond prices and interest ratesmove in opposite directions? Let's assume that you hold a bond offering a 5%yield. A year later, interest rates are on the rise and bonds are offered with a6% yield. With higher-yielding bonds available, you would have trouble sellingyour 5% bond for the price you paid--causing you to lower your asking price. Onthe other hand, if interest rates were falling and 4% bonds were being offered,you would be able to sell your 5% bond for more than you paid.PLAIN TALK ABOUTBOND MATURITIESA bond is issued with a specific maturity date--the date when the bond's issuer,or seller, must pay back the bond's initial value (known as its "face value").Bond maturities generally range from less than one year (short term) to 30 years(long term). The longer a bond's maturity, the more risk you, as a bondinvestor, face as interest rates rise--but also the more interest you couldreceive. Long-term bonds are more suitable for investors willing to take greaterrisks in hope of higher yields; short-term bond investors should be willing toaccept lower yields in return for less fluctuation in the value of theirinvestment.510These figures are for illustration only and should not be regarded as anindication of future returns from the bond market as a whole, or the Fund inparticular.STOCKSRoughly one-third of Wellesley Income Fund's assets are invested in commonstocks.[FLAG]THE FUND IS SUBJECT TO STOCK MARKET RISK, WHICH IS THE POSSIBILITY THATSTOCK PRICES OVERALL WILL DECLINE OVER SHORT OR EVEN EXTENDED PERIODS.STOCK MARKETS TEND TO MOVE IN CYCLES, WITH PERIODS OF RISING STOCKPRICES AND PERIODS OF FALLING STOCK PRICES.To illustrate the volatility of stock prices, the following table shows thebest, worst, and average total returns (dividend income plus change in marketvalue) for the U.S. stock market over various time periods as measured by theStandard & Poor's 500 Composite Stock Price Index, a widely used barometer ofstock market activity. Note that the returns shown do not include the costs ofbuying and selling stocks or other expenses that a real-world investmentportfolio would incur. Note, also, how the gap between best and worst tends tonarrow over the long term.Copyright 2012 www.secdatabase.com. All Rights Reserved.Please Consider the Environment Before Printing This Document
TABLE CAPTION ---------------U.S. STOCK MARKET RETURNS --------------------------1 YEAR5 YEARS10 YEARS20 -------------------- S C C C C ---------------------------------- /TABLE The table covers all of the 1-, 5-, 10-, and 20-year periods from 1926through 1996. For example, while the average return on stocks for all of the5-year periods was 10.4%, returns for these 5-year periods ranged from a -12.5%average (from 1928 through 1932), to 23.9% (from 1951 through 1955). Theseaverage returns reflect past performance on common stocks and should not beregarded as an indication of future returns from either the stock market as awhole or this Fund in particular.The stocks held by Wellesley Income Fund are chosen primarily for theirincome potential. As a result, the Fund does not hold the same securities heldin the S&P 500 Index or any other market index, and the performance of theFund--or the Fund's stock holdings--will not mirror the returns of anyparticular index.Because bond prices and stock prices often move in different directions, theFund's stock holdings help to dampen--but not eliminate--some of the bond-pricefluctuations caused by changes in interest rates. Likewise, stock marketvolatility may not be as dramatic for Wellesley Income Fund as it would be for afund made up entirely of stocks.611SECURITY SELECTIONWellington Management Company, LLP (WMC), adviser to the Fund, investsapproximately 60% to 70% of the Fund's assets in high-quality bonds andapproximately 30% to 40% of the Fund's assets in dividend-paying common stocks.While the mix of bonds and stocks will vary from time to time depending on theadviser's view of economic and market conditions, bonds can be expected torepresent at least 60% of the Fund's holdings.The Fund is run by WMC according to traditional methods of active investmentmanagement. Securities are bought and sold according to WMC's judgments aboutbond issuers and the general level of interest rates, and about companies andtheir financial prospects. To achieve the Fund's objectives of income andmoderate capital growth, the adviser follows specific strategies when selectingbonds and stocks.[FLAG]THE FUND IS SUBJECT TO MANAGER RISK, WHICH IS THE POSSIBILITY THAT WMCMAY DO A POOR JOB OF SELECTING BONDS AND STOCKS.PLAIN TALK ABOUTTYPES OF BONDSBonds are issued (sold) by many sources: corporations issue corporate bonds; thefederal government issues U.S. Treasury bonds; agencies of the federalgovernment issue agency bonds; mortgage holders issue "mortgage-backed" bondssuch as Government National Mortgage Association (GNMA). Each issuer isresponsible for paying back the bond's initial value as well as periodicinterest payments.PLAIN TALK ABOUTCREDIT QUALITYA bond's credit quality depends on the issuer's ability to pay interest on thebond an
vanguard/wellesley income fund, inc. (exact name of registrant as specified in charter) p.o. box 2600, valley forge, pa 19482 (address of principal executive office) registrant's telephone number (610) 669-1000 raymond j. klapinsky, esquire p.o. box 876 valley forge, pa 19482 it is proposed that this filing become effective:
