Transcription
Solar energy innovation and Silicon ValleyDaniel M. KammenCitation: AIP Conference Proceedings 1652, 153 (2015); doi: 10.1063/1.4916178View online: http://dx.doi.org/10.1063/1.4916178View Table of Contents: pcp/1652?ver pdfcovPublished by the AIP PublishingArticles you may be interested inThe Moses of Silicon ValleyPhys. Today 50, 42 (1997); 10.1063/1.881629Silicon Solar Energy ConvertersJ. Appl. Phys. 26, 534 (1955); 10.1063/1.1722034Tracing the origin of Silicon ValleyPhys. TodayStart-Up Fervor Shifts to Energy in Silicon ValleyPhys. TodayOut of the loop in Silicon ValleyPhys. TodayThis article is copyrighted as indicated in the article. Reuse of AIP content is subject to the terms at: http://scitation.aip.org/termsconditions. Downloaded to IP:50.131.186.250 On: Fri, 03 Apr 2015 06:02:12
Solar Energy Innovation and Silicon ValleyDaniel M. Kammen*a Energyand Resources Group, University of California, Berkeley, USAand Appropriate Energy Laboratory, University of California, Berkeley, USAc Goldman School of Public Policy, University of California, Berkeley, USAb RenewableAbstract. The growth of the U. S. and global solar energy industry depends on a strong relationship between science andengineering innovation, manufacturing, and cycles of policy design and advancement. The mixture of the academic andindustrial engine of innovation that is Silicon Valley, and the strong suite of environmental policies for which Californiais a leader work together to both drive the solar energy industry, and keep Silicon Valley competitive as China, Europeand other area of solar energy strength continue to build their clean energy sectors.Keywords: Phovoltaics; innovation; technology transfer; green jobsTHE DEVELOPMENT OF COST-COMPETITIVE PV TECHNOLOGY FOR GLOBALDEPLOYMENTThe sun has been described as “that highly convenient and free fusion reactor in the sky, which radiates moreenergy to the Earth in a few hours than the entire human population consumes from all sources in a year.”Plugging in to that free fusion reactor has been the tricky part. While initial material science and technicalchallenges have largely given way to financial and business challenges, building the solar energy industry from aninteresting niche market to a major part of the global energy mix – which is needed to address climate change –remains a challenge. Technically, the direct conversion of photons from the sun into energy in the form of electrons,or photovoltaics (PV), has come a long way since the first panels of PV cells were used to power NASA satellites;the price of a panel has dropped dramatically, even as their power output has gone up. And the potential of PV isenormous[1,2]: solar panels, paired with batteries to enable power at night, can produce several orders of magnitudemore electricity than is consumed by the entirety of human civilization. Alternatively, the panels can be put on ahomeowner’s roof and hooked up directly to the existing electrical grid; any excess generated is sent to the grid,while any time the homeowner’s demand exceeds the capacity of the panel, the household simply draws upon thegrid. In effect, the electrical grid acts as a giant battery.Many innovative approaches are being tried, in some cases drawing upon the experiences of Silicon Valley whenit comes to start-ups, financing, and the introduction of new technologies. What is taking place in Silicon Valley andbeyond to make this vision possible? What role can this community play in advancing laboratory research andpolicy and market innovation?Based in Mountain View, California the major company Solar City, is one example of innovative thinking. Thefirm makes a case for a business model that is quintessentially Silicon Valley in nature. Instead of simply forecastingwhen solar energy will be ‘grid competitive’ (forecast to be between now and 2020 across virtually all of the UnitedStates), Solar City is one of a handful of companies that have bypassed the simple sales-only model. Why simplybuy the hardware? Instead, Solar City will place panels they own on your roof, where you are leasing space to thecompany, and buying power. SunRun and Sungevity are also aggressive and innovative competitors in this space,that all promise to lower your residential utility bill the first month.Such thinking comes just in time for a promising technology. In fact, in a recent regional assessment of thepotential of solar energy we found that with a realistic model of the utility grid we found that with only aconservative view of innovation in the solar energy sector, photovoltaics alone could provide over one third of thetotal energy across western North America [3]. This result, using the SWITCH energy system capacity expansion weuse in my Renewable and Appropriate Energy Laboratory [4] highlights both the potential of solar energy, but also* Correspondence to: kammen@berkeley.edu; 310 Barrows Hall, University of California, Berkeley, CA 94720-3050: T: 1-510-642-1640Physics of Sustainable Energy III (PSE III)AIP Conf. Proc. 1652, 153-159 (2015); doi: 10.1063/1.4916178 2015 AIP Publishing LLC 978-0-7354-1294-1/ 30.00153 to the terms at: http://scitation.aip.org/termsconditions. Downloaded to IP:This article is copyrighted as indicated in the article. Reuse of AIP content is subject50.131.186.250 On: Fri, 03 Apr 2015 06:02:12
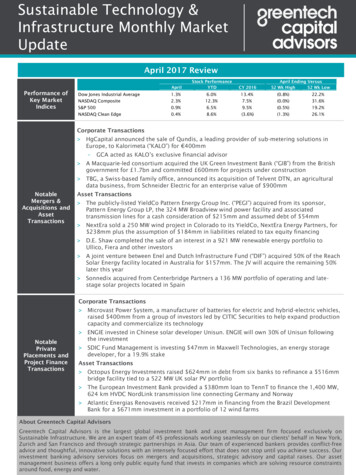
the need for dramatically accelerated innovation to move to the entirely clean energy economy that will be neededby mid-century.To meet the long-term greenhouse gas (GHG) mitigation targets of 80% reductions from the 1990 baseline by2050, solar energy can play a key role in decarbonizing electricity generation [5,6,7,8]. Solar PV technology withterawatt (TW)-scale deployment has long been recognized as an effective tool to mitigate climate change [32,10]. Asshown in Fig. 1, effective energy policies in mitigating energy-related CO2 emissions will have to accommodate thedeveloping countries’ growing needs for affordable energy sources. Therefore, it is imperative for the sustainablecost of PV technology to continue to decline for deployment in both the developed and developing countries.The progress of developing and deploying PV technology can be greatly impeded by market failures associatedwith innovation and carbon emissions [11]. Policy intervention, mainly in the form of public R&D spending(“technology-push”) and deployment targets and incentives (“demand-pull”), is necessary to address these marketfailures. As shown in Fig. 1C, energy policies, aiming at the development of PV technology into a globallyaffordable energy source, are essential for deploying clean energy and mitigating climate change on the global scale.These innovations require sustained performance improvements and cost reductions [1], and a vision of thewidespread deployment of the most efficient use of the cleanest fuels [7].THE UNINTENDED CONSEQUENCES OF ECONOMIES OF SCALE DURING2011-2013The conventional PV learning curve – a simple relationship that shows roughly a 20% reduction in solar cellcosts for each doubling of total global manufacturing -- model for c-Si PV modules (Fig. 1C) has been widelyFIGURE 1. Meeting CO2 emission targets requires further cost reduction in PV technology. The Organization forEconomic Co-operation and Development (OECD) countries (in blue) and the non-OECD countries (in red) have exhibitedopposite trends in primary energy consumption (A) and related CO2 emissions (B) over the past decade. The primary energyconsumption is measured in billion tons of oil equivalent (btoe). For example, with a population of 1.3 billion, China’s energyrelated CO2 emissions have more than doubled from 3.4 billion tons in 2000 to 9.2 billion tons in 2012. The cost of PVtechnology has been decreasing steadily with increasing cumulative installations (C): the learning rates for Si-wafer PVmodules and First Solar’s thin film modules are 21.1% and 13.8%, respectively. All prices are inflation-adjusted to the 2010U.S. dollars. Sources: BNEF [12], BP [13], and First Solar [14].154 to the terms at: http://scitation.aip.org/termsconditions. Downloaded to IP:This article is copyrighted as indicated in the article. Reuse of AIP content is subject50.131.186.250 On: Fri, 03 Apr 2015 06:02:12
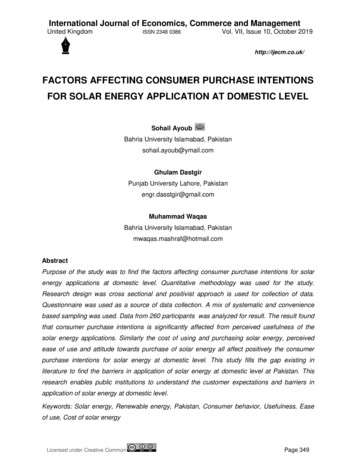
referenced to support policies that rely on a cost-reduction strategy through rapid market expansion, where theaverage selling price (ASP) of PV modules is projected to decline with increasing cumulative installations [1,9,15].As the market grows, production of PV modules benefits from both economies of scale and “learning,” whereaccumulated operating experience leads to innovation and cost reductions through both learning-by-doing andlearning-by-searching [16]. However, the learning rate (LR), cost reduction per doubling in cumulative installedcapacity, is known to vary depending on the timeframe of the regression analysis, and this uncertainty in LR willsignificantly affect the projected timing and cost of reaching the cost-reduction milestones [17,18] and GHGmitigation targets.In a recent study [19], we estimated that an annual market size of 56 TW and an estimated learning investment ofUS 25 trillion are required to reach the target module price of 0.5/W as set by the U.S. SunShot Initiative [20,3] ifthe cost reduction is assumed to be driven by only economies of scale. The policy implication is that “demand-pull”policies focusing on further market scale-up is likely to be unrealistic given the total market potential and the mostexpensive approach to achieve the SunShot goal. This viewed simply as a continued market expansion, in factdepends on a steady stream of innovations – some technical, some market and finance based, and some social andpolitical. A careful look reveals that a number of lead actors, Germany, Silicon Valley, California and othermunicipal governments, and a growing global manufacturing sector play key roles in this ‘momentum ofinnovation.’What does look like? Each jurisdiction has set its own incentives and subsidies for clean energy deployment – amarker requirement for renewable energy in California, a special tariff to reward solar in Germany, and so forth.The “learning” component in the conventional model is reflected in the strong correlation between market sizeand innovation for c-Si PV technology [19]. We formalize the overall mechanism underlying this phenomenon asmarket-driven innovation: the interaction of learning-by-doing, market expansion and increased commercial value.An expanding market with growing revenue supports and encourages manufacturers’ R&D activities, andincentivizes commercialization of important laboratory research results [21].A rich body of work exists where scholars have tried to understand the roles of innovation bringing new productsinto the market, and of the impact of economies of scale (price reductions due to greater efficiency ofmanufacturing) in the cost reduction of PV technology. It is important for the policy community to recognize that theprimary driving force underlying the reduction in PV module prices has evolved over time, from innovation focusedon improved module efficiency in the early stage of PV technology, to economies of scale [22,23,24], which exhibitsdiminishing returns with scaling. Today we are in a phase of the PV industry where manufacturing innovations,often of technologies developed in Silicon Valley but brought to production scale across the globe are driving furthermodule cost reduction. The global PV market has expanded from 0.3 GW in 2000 to 38 GW in 2013 [25], and thisscale-up has gave birth to GW-scale PV manufacturers, which could turn out to be an unintended barrier for newinnovative technologies especially when situated in a market with serious oversupply problems. This scale-upbrought an overcapacity in PV module production that caused PV modules being sold at unsustainably low prices.This imbalance and pushed almost all major PV manufacturers into financial losses in 2011 and 2012 (Fig. 2).Interestingly, while the huge ramp-up in manufacturing resulted in smaller and smaller (and then negative) profitsfor solar energy producers – many of whom are based in China – places that are also expert in building overallFig. 2. Net profits (losses) of 9 major U.S.-listed PV manufacturers during 2008-2013. The 2013 financial results haveshown signs of industry-wide recovery from the dark periods during 2011-2012. Source: U.S. SEC [27].155 to the terms at: http://scitation.aip.org/termsconditions. Downloaded to IP:This article is copyrighted as indicated in the article. Reuse of AIP content is subject50.131.186.250 On: Fri, 03 Apr 2015 06:02:12
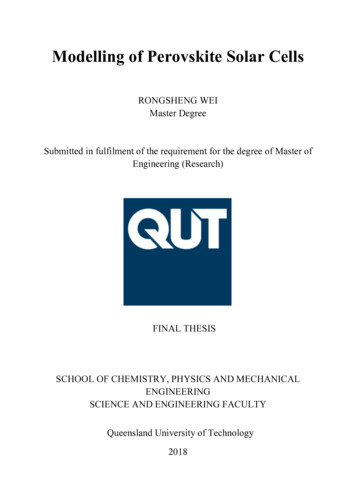
energy systems and financial models – both hallmarks of Silicon Valley firms – have profited from the fallingmodule prices. As one example, the overall cost of solar energy systems a decade ago was dominated by the solarpanel, now the ‘balance of systems’ (the power inverter, electronics, and other ancillary parts of hardware) nowdominate the cost of the system.This overcapacity situation made capital-intensive investment in expanding production capacity unattractive toinvestors. Lacking the opportunities to scale up production, early-stage PV companies with innovative technologiesare forced to compete with incumbent GW-scale manufacturers at unsustainably low module prices. As a result, theindustry saw of smaller PV manufacturers facing bankruptcy, or acquisition.This process, in turn, lead to further tightening of the capital flows into the industry, for a time causing someanalysts to see a pessimistic future for solar (reference). This negative view still persists, but has eased, part becauseof the new wave of both technical and deployment innovations. Today, thin-film solar panels with the potential forgreatly reduced costs, new financing innovations so that in many places shifting to leased solar panels can saveproperty owners who switch to solar in the very first month of installation [25].AN INNOVATION-FOCUSED POLICY FRAMEWORK FOR A SUSTAINABLE PATHTOWARDS AFFORDABLE PV TECHNOLOGYThese waves of innovation highlight the need for an aggressive, sustained, commitment to innovation. Here weshow a conceptual model (Fig. 3) developed in our recent study [19] that clarifies the dynamics among innovation,manufacturing, and market, and use the U.S. as a case study to explain an innovation-focused policy framework forbuilding a sustainable PV industry on the national level.A set of clear-targeted and long-term deployment policies are essential in the reinforcing dynamics amonginnovation, manufacturing, and market. Firstly, clear, long-term deployment policies can reduce market uncertaintiesand encourage more efficient industry-wide consolidation, which contributed to the improved financial performanceof major PV manufacturers in 2013 (Fig. 2). Secondly, as part of the market-driven innovation mechanism, a longterm and expanding market also incentivizes commercialization of important laboratory results through channelssuch as venture capital (VC) funding.Manufacturing activities are one important source of innovation through learning-by-doing. Moreover, thecorporate R&D investment from PV manufacturers also enables innovation through learning-by-searching. As themanufacturers’ competitiveness increasingly relies on cost reduction through innovation, it is possible for a nation touse innovation to anchor manufacturing activities, and thus form a reinforcing dynamics between innovationleadership and manufacturing leadership.FIGURE 3. The conceptual model for building an innovation-focused and sustainable PV industry. Utilizing thereinforcing dynamics among innovation, manufacturing, and market, a set of long-term, innovation-focused, and marketsupporting policies can lead to a nation’s technology leadership and help reduce the cost of PV technology for globaldeployment.156 to the terms at: http://scitation.aip.org/termsconditions. Downloaded to IP:This article is copyrighted as indicated in the article. Reuse of AIP content is subject50.131.186.250 On: Fri, 03 Apr 2015 06:02:12
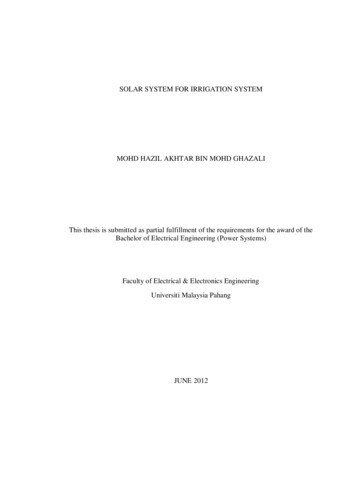
The optimum structure of the PV manufacturing sector will largely depend on trade policies. Without tradebarriers, surviving international competition would require economies of scale and thus a critical size of themanufacturing cluster, where a handful of giant PV manufacturers may comprise most of the market share. On theother hand, the ongoing trade tariff will ease the international competition, and policymakers could promote anational PV manufacturing sector with lower market concentration. Giant incumbent manufacturers present largecost disadvantages and risks for start-up manufacturers, whose innovative technologies are yet to be scaled up. In asegmented global PV market, a national PV industry with low market concentration could be an additional boost toinnovation during the next 7 to 10 years of an innovation-driven phase, where the VC community in the SiliconValley could see more opportunities in finding commercially viable, innovative PV startups.Elevated level of public R&D funding and focus on technological development in PV are the other central pieceof this conceptual model. “Demand-pull” policies will likely face leakage problems on the national level in aglobalized PV value chain. Therefore, directly injecting resources to innovation by public R&D funding should playa stronger role. The IEA study [28] identified the need to more than double the public R&D funding, benchmarkingR&D budget as 10% to 20% of deployment cost.Innovation itself can be made more cost-effective with innovative R&D models, such as establishing a nationalprogram aimed at promoting R&D collaboration and technology transfer among PV manufacturers. For example,the U.S. funded a shared R&D center in 2011 through the PV Manufacturing Consortium, which borrowed the precompetitive R&D model from the semiconductor industry.An open data model for the PV industry could be adopted by the international community to attract more policyand market research. Various data collection efforts (from organizations like IEA to companies like BNEF) alreadyexist; however, variations in data and methodologies are common. It is therefore useful to compile and continuouslyFIGURE 4. Evolution of the cost of meeting home energy and transportation needs through conventional energysupplies and a solar home/electric vehicle (EV) combination. The year-to-year retail price increases of electricity in the U.S.residential sector (A) and unleaded regular motor gasoline (B) have been as high as 10% and 30%, respectively. The costcomparisons (C) of the average US household is presented for total annual demand of 12,000 kWh electricity and 2 vehicleswith 10,000 miles travelled each, using either a combination of conventional grid-based electricity and gasoline (purple dotline) or a home outfitted with a rooftop solar array and all-electric driving (orange line). Electricity consumption for electricvehicles adds about another 58% on top of home electricity consumption (orange dashed line). The capital cost of conventionalor electric vehicles is omitted. The PV electricity cost is calculated from the median installed prices of residential PV systemsin the U.S., with discount rate, service lifetime, and capacity factor at 5%, 25 years, and 0.2, respectively. All prices areinflation-adjusted to the 2010 U.S. dollars. Source: LBNL [31] and EIA [32].157 to the terms at: http://scitation.aip.org/termsconditions. Downloaded to IP:This article is copyrighted as indicated in the article. Reuse of AIP content is subject50.131.186.250 On: Fri, 03 Apr 2015 06:02:12
update an official dataset for the key metrics in the PV industry with well-documented methodologies. Making thisdataset publicly available will greatly reduce the cost and time for conducting policy and market research. A richerset of analyses and opinions will be valuable for decision-making in both the government and industry, andaccelerating policy and business innovation that address the soft cost of deploying PV technologies [29].These efforts are seen today and putting PV technology on a path to become cost-competitive with conventionalelectricity sources in under a decade [20,3].ENTERING A CLEAN ENERGY ERAFigure 4 highlights the evolving economics of PV electricity in the U.S. residential sector over the past twodecades from three sources of price changes: electricity, motor gasoline, and residential PV system. With theremarkable cost reduction in PV modules (Fig. 1C) and soft cost, distributed PV energy ownership, which powershomes and all-electric driving, becomes less costly (Fig. 4C) and approaches the cost of a conventional householdusing grid electricity and gasoline vehicles. Furthermore, self-production of energy could help U.S. households tomitigate price fluctuations in energy consumption (electricity, natural gas, and gasoline). A recent IEA report [30]found that the inflation-adjusted capital expenditure in oil, gas, and coal supply chains has more than doubledbetween 2000 and 2013. The energy price fluctuation is projected to turn into a steady increase in future energycosts, as fossil fuels become increasingly more capital-intensive and expensive to extract. This process would nothave been possible without the confluence of a number of forces, many of which are present in Silicon Valley:university and industry research hubs tied closely to industry; mixtures of State and Federal support; and a suite ofstate policies that strongly encourage different aspects of the solar energy deployment.In particular, California’s Silicon Valley is world-famous for its prominent venture capital eco-system and is theglobal powerhouse for innovations. In an innovation-focused phase of the PV industry, energy policies are set toreward innovations enabling a cost-efficient path to sustainable PV technology, which could be deployed globally onthe TW-scale. In this sustainable business environment, the VC community can profit from finding andcommercializing these PV innovations.ACKNOWLEDGEMENTSDMK gratefully acknowledges support of the Karsten Family Foundation, the Class of 1935 of the University ofCalifornia, Berkeley, and the California Energy Commission.REFERENCES1. Duke, R. D., and Kammen, D. M., 1999. “The economics of energy market transformation initiatives”, The Energy Journal, 20(4), 15 – 64.2. Kammen, D. M. (2006) “The Rise of Renewable Energy”, Scientific American, September, 82 - 91.3. Mileva, A., Nelson, J. H., Johnston, J., and Kammen, D. M., 2013. SunShot Solar Power Reduces Costs and Uncertainty inFuture Low-Carbon Electricity Systems, Environmental Science & Technology, 47 (16), 9053 – 9060.4. Renewable and Appropriate Energy Laboratory (RAEL), SWITCH optimization model. Access through http://rael.berkeley.edu/switch5. EC (European Commission), 2011. A Roadmap for Moving to a Competitive Low Carbon Economy in 2050. http://ec.europa.eu/clima/policies/roadmap/index en.htm (accessed 2014).6. Nelson, J. H., Johnston, J., Mileva, A., Fripp, M., Hoffman, I., Petros-Good, A., Blanco, C., and Kammen, D. M., 2012. Highresolution modeling of the western North American power system demonstrates low-cost and low-carbon futures, EnergyPolicy, 43, 436–447.7. Williams, J. H., et al., 2012. The technology path to deep greenhouse gas emissions cuts by 2050: the pivotal role of electricity.Science, 335, 53-59.8. Wei, M., Nelson, J. H., Greenblatt, J. B., Mileva, A., Johnston, J., Ting, M., Yang, C., Jones, C., McMahon, J. E. and Kammen,D. M. 2013. Deep carbon reductions in California require electrification and integration across economic sectors,Environmental Research Letters, 8.9. Hoffert, M. I., 2010. Farewell to Fossil Fuels? Science, 329, 1292-1294.10. Davis, S. J., Caldeira, K., Matthews, H. D., 2010. Future CO2 emissions and climate change from existing energyinfrastructure. Science, 329, 1330-1333.11. Jaffe, A. B., Newell, R. G., Stavins, R. N., 2005. A tale of two market failures: technology and environmental policy. Ecol.Economics, 54, 164-174.12. BNEF (Bloomberg New Energy Finance), 2012. Solar’s learning curve. ice-drop-brings-renewable-power-closer/ (accessed 2014).158 to the terms at: http://scitation.aip.org/termsconditions. Downloaded to IP:This article is copyrighted as indicated in the article. Reuse of AIP content is subject50.131.186.250 On: Fri, 03 Apr 2015 06:02:12
13. BP, 2013. Statistical Review of World Energy 2013. eview/statistical review of world energy 2013.pdf (accessed 2014).14. First Solar, 2014. Quarterly results. http://investor.firstsolar.com/results.cfm (accessed 2014).15. Sagar, A. D., van der Zwaan, B., 2006. Technological innovation in the energy sector: R&D, deployment, and learning-bydoing. Energy Policy 34, 2601-2608.16. Qiu, Y., Anadon, L. D., 2012. The price of wind power in China during its expansion: technology adoption, learning-bydoing, economies of scale, and manufacturing localization. Energy Econ. 34, 772-785.17. Van der Zwaan, B., Rabl, A., 2004. The learning potential of photovoltaics: implications for energy policy. Energy Policy 32,1545–1554.18. Ferioli, F., Schoots, K., van der Zwaan, B. C. C., 2009. Use and limitations of learning curves for energy technology policy: acomponent-learning hypothesis. Energy Policy, 37, 2525-2535.19. Zheng, C., Kammen, D. M., 2014. An innovation-focused roadmap for a sustainable global photovoltaic industry. EnergyPolicy 67, 159-169.20. Margolis, R. M. (Ed.), 2012. SunShot Vision Study. U.S. Department of Energy: Washington DC. http://www1.eere.energy.gov/solar/sunshot/vision study.html (accessed 2014).21. Bettencourt, L. M. A., Trancik, J. E., Kaur, J., 2013. Determinants of the pace of global innovation in energy technologies.PLoS One, 8, e67864.22. Margolis, R. and Kammen, D. M., 1999. Underinvestment: The energy technology and R&D policy challenge, Science, 285,690 - 692.23. Nemet, G. F., 2006. Beyond the learning curve: factors influencing cost reductions in photovoltaics. Energy Policy, 34,3218-3232.24. Nemet, G. F. and D. M. Kammen 2007. "U.S. energy research and development: Declining investment, increasing need, andthe feasibility of expansion." Energy Policy 35 (1), 746-755.25. Rowe, T. (Ed.), 2014. Global Market Outlook for Photovoltaics 2014-2018. European Photovoltaic Industry Association,Brussels. t-outlook-for-photovoltaics-2014-2018/ (accessed 2014).26. Solar City. http://www.solarcity.com (accessed 2015)27. U.S. SEC (Securities and Exchange Commission), 2014. Company filings. .html (accessed 2014).28. Kerr, T., 2010. Global Gaps in Clean Energy RD&D. International Energy Agency, Paris. ublication/name,3910,en.html (accessed 2014).29. Seel, J., Barbose, G., Wiser, R., 2013. Why are Residential PV Prices in Germany So Much Lower than in the United States.Lawrence Berkeley National Laboratory, Berkeley, CA. ice-ppt.pdf (accessed 2014).30. Priddle, R., 2014. World Energy Investment Outlook. International Energy Agency, Paris. ublication/name,86205,en.html (accessed 2014).31. LBNL (Lawrence Berkeley National Laboratory), 2013. Tracking the Sun VI: A Historical Summary of the Installed Price ofPhotovoltaics in the United States from 1998 to 2012. ed-states-1998-201 (accessed 2014).32. EIA (Energy Information Administration), 2013. http://www.eia.gov/electricity/data.cfm (accessed 2014).159 to the terms at: http://scitation.aip.org/termsconditions. Downloaded to IP:This article is copyrighted as indicated in the article. Reuse of AIP content is subject50.131.186.250 On: Fri, 03 Apr 2015 06:02:12
The Moses of Silicon Valley Phys. Today 50, 42 (1997); 10.1063/1.881629 Silicon Solar Energy Converters J. Appl. Phys. 26, 534 (1955); 10.1063/1.1722034 Tracing the origin of Silicon Valley Phys. Today Start-Up Fervor Shifts to Energy in Silicon Valley Phys. Today Out of the loop in Silicon Valley Phys. Today