Transcription
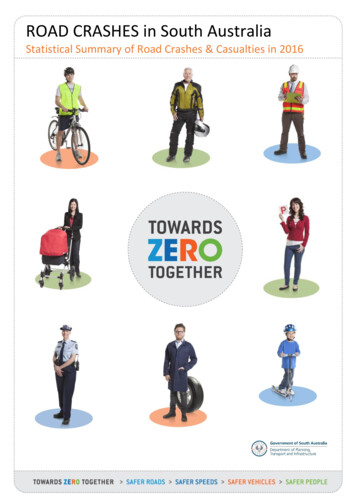
ROAD CRASHES in South AustraliaStatistical Summary of Road Crashes & Casualties in 2016
Prepared by Department of Planning, Transport and InfrastructureOnly available in electronic format from the Department of Planning, Transport and Infrastructure’s Road Safety urther InformationFor further information concerning road crash statistics for South Australia, write to theDepartment of Planning, Transport and InfrastructureGPO Box 1533,ADELAIDE SA 5000Email: DPTI.enquiriesadministrator@sa.gov.auFull Title: Road Crashes in South Australia: Statistical Summary of Road Crashes & Casualties in 2016Type of Report and Period Covered: Statistical, 2016Pages: 65Key Words: crash, crash rate, casualty, serious injury, injuries, age, blood alcohol concentration, day, hour, fatality, month, road user, severity, sex, vehiclemovement, year, statisticalThe data presented in this report is for information purposes only and should be used with care before drawing conclusions not contained in this report.Numbers may not match with future publications due to the database continually being updated with new information. Department of Planning, Transport & Infrastructure, July 2017
Summary Data for 2016NumberCRASHESFatal CrashesSerious Injury CrashesMinor Injury Crashes775744 562Property Damage Crashes11 562TOTAL16 775CASUALTIESFatalitiesSerious Injuries86692Minor Injuries5 787TOTAL6 565OTHER DATAVehicles on register11 419 302Fatalities per 10 000 vehicles0.61Serious Injuries per 10 000 vehicles4.88Casualties per 10 000 vehiclesLicence holders246.261 225 254Driver/rider fatalities per 10 000 licence holders0.40Driver/rider serious injuries per 10 000 licence holders3.51Driver/rider casualties per 10 000 licence holdersPopulation3Fatalities per 100 000 populationSerious Injuries per 100 000 populationCasualties per 100 000 population35.621 716 9665.0340.51383.331Excludes trailers, caravans, plant and equipment. Source: Registration and Licensing, Dept for Planning, Transport & Infrastructure, December 2016.No. of individual licence holders (inc learner permits). Source: Registration and Licensing, Dept for Planning, Transport & Infrastructure, December 2016.3 Estimated resident population. Source: Australian Demographic Statistics, ABS, cat. no. 3101.0, June 2016.21Road Crashes In South Australia 2016
ContentsSUMMARY DATA FOR 20161KEY POINTS 20164PREFACEHow crashes are processed?ScopeRelated PublicationsAcknowledgementsDefinitions & Explanatory Notes555556CRASH AND CASUALTY TRENDSTable 1Trends in South Australia, 1995 – 2016Figure 1 Data Trends in SA, 1995 – 2016Figure 2 Fatality Rates in SA, 1995 – 2016Table 2Comparison with other Australian States, 2016Table 3Road Crash Fatalities by Age Group compared with Deaths of All Causes, 2015Table 4Casualties by Road User Type and Severity, 1995 – 2016Table 5Casualties by Age Group and Severity, 1995 – 2016Table 6Casualties by Sex and Severity, 1995 – 2016Table 7Crashes and Casualties by Region and Severity, 1995 – 201691010111112131415ROAD CRASHES in 201616Time Distribution of CrashesTable 8Crashes and Casualties during Holiday Periods by SeverityTable 9a Casualty Crashes by Time of Day, Day of WeekFigure 3 Casualty Crashes by Time of Day, Day of WeekTable 9b Casualties by Time of Day, Day of WeekTable 9c All Crashes by Time of Day, Day of WeekTable 10 Crashes and Casualties by Month of Year and Severity171818191919Crash TypeTable 11aTable 11bTable 11cTable 12Table 13Figure 4Table 14aTable 14bTable 14c202021212122232527Crashes and Casualties by Crash Type and Severity: Metropolitan AdelaideCrashes and Casualties by Crash Type and Severity: RuralCrashes and Casualties by Crash Type and Severity: South AustraliaHit Fixed Object Crashes by Object First Hit and SeveritySingle Vehicle Crashes by Motor Vehicle Type and SeverityDefinition for Coding Accidents TableCrashes and Casualties by DCA and Severity: Metropolitan AdelaideCrashes and Casualties by DCA and Severity: RuralCrashes and Casualties by DCA and Severity: South AustraliaLocation & Distribution of CrashesTable 15a Crashes and Casualties by Location Type and Severity: Metropolitan AdelaideTable 15b Crashes and Casualties by Location Type and Severity: RuralTable 15c Crashes and Casualties by Location Type and Severity: South AustraliaTable 16a Crashes and Casualties by Traffic Control and Severity: Metropolitan AdelaideTable 16b Crashes and Casualties by Traffic Control and Severity: RuralTable 16c Crashes and Casualties by Traffic Control and Severity: South AustraliaTable 17 Crashes and Casualties by Area Speed Limit, Region & SeverityTable 18 Crashes and Casualties by Light Conditions, Region & SeverityTable 19 Crashes and Casualties by Vertical Alignment, Region & SeverityTable 20 Crashes and Casualties by Horizontal Alignment, Region & SeverityTable 21 Crashes and Casualties by Road Moisture, Region & SeverityTable 22 Crashes and Casualties by Route and SeverityTable 23a Crashes and Casualties by Local Government Area and Severity: Metropolitan Adelaide: Council RoadsTable 23b Crashes and Casualties by Local Government Area and Severity: Metropolitan Adelaide: DPTI RoadsTable 23c Crashes and Casualties by Local Government Area and Severity: Metropolitan Adelaide: All RoadsTable 24a Crashes and Casualties by Local Government Area and Severity: Rural: Council RoadsTable 24b Crashes and Casualties by Local Government Area and Severity: Rural: DPTI RoadsTable 24c Crashes and Casualties by Local Government Area and Severity: Rural: All RoadsTable 25 Top 10 Intersections with the highest number of Casualty Crashes, 2012 - 2016229293030313132323333343435363738404244Road Crashes In South Australia 2016
Motor Vehicle Type, Movement & InvolvementTable 26 Motor Vehicles Involved in and Responsible for Crashes by Region and SeverityTable 27 Crashes and Casualties by Vehicle Movement of Motor Vehicle Responsible and SeverityTable 28 Crashes and Casualties Involving by Pedestrian Responsible Movement and SeverityTable 29 Crashes by Motor Vehicle Type Involved and Severity45464647Speed InvolvementTable 30 Crashes and Casualties by Speed Involvement and Severity47CASUALTIES in 201648Road UserTable 31Table 32Table 33495050Casualties by Road User Type, Severity, Age & SexCasualties by Unit Type and SeverityMotor Vehicle Casualties by Position in Vehicle and SeveritySeatbelts & HelmetsTable 34 Casualties by Road User Type, Safety Device and Severity51AlcoholTable 35Driver and Motorcyclist Casualties with BAC52Table 36Driver and Motorcyclist Casualties with Drugs52Road User Involved In and Responsible for Crashes by Age & Sex: Fatal CrashRoad User Involved In and Responsible for Crashes by Age & Sex: Serious Injury CrashRoad User Involved In and Responsible for Crashes by Age & Sex: Minor Injury CrashRoad User Involved In and Responsible for Crashes by Age & Sex: Property Damage CrashRoad User Involved In and Responsible for Crashes by Age & Sex: All CrashesDrivers & Motorcycle Riders Involved in and Responsible for Crashes by Licence Type and SeverityDrivers & Motorcycle Riders Responsible for Crashes by Sex, Age and Licence Type: Fatal CrashDrivers & Motorcycle Riders Responsible for Crashes by Sex, Age and Licence Type: Serious Injury CrashDrivers & Motorcycle Riders Responsible for Crashes by Sex, Age and Licence Type: Minor Injury CrashDrivers & Motorcycle Riders Responsible for Crashes by Sex, Age and Licence Type: Property Damage CrashDrivers & Motorcycle Riders Responsible for Crashes by Sex, Age and Licence Type: All ble 37aTable 37bTable 37cTable 37dTable 37eTable 38Table 39aTable 39bTable 39cTable 39dTable 39eREFERENCE INFORMATION for South Australia61Demographic DataTable 40 Estimated Population by Age and SexTable 41 Licence and Permit Holders by Age and Sex6262Vehicle InformationTable 42 Motor Vehicle on Register by Vehicle TypeTable 43 Vehicle Kilometres Travelled by Vehicle Type63633Road Crashes In South Australia 2016
Key Points 2016 A total of 16 775 crashes were processed for South Australia in 2016 – 77 fatal crashes, 574 serious injury crashes, 4 562 minor injury crashesand 11 562 property damage crashes. This resulted in 86 fatalities, 692 serious injuries and 5 787 minor injuries. The estimated cost of crashes to the community in 2016 was 1.64 billion1. The 86 fatalities that occurred in 2016 is the lowest on record and resulted in a fatality rate per 100 000 population of 5.03, lower than thenational average of 5.37 Greater Adelaide Area - Fatal and serious injury crashes decreased in 2016 compared to 2015. There were 32 fatal crashes, 11 fewer thanin 2015 (43). This continues the decline of fatal crashes in the Greater Adelaide area over the last 5 years (2011-2015 average of 42). Therewere 339 serious injury crashes in 2016 compared to 391 in 2015, and also fewer than the previous 5 year average of 393 (2011-2015).41% of fatal crashes in Greater Adelaide were at intersections, a slight increase from 35% in 2015. Rural areas – Fatal and serious injury crashes have also decreased in rural areas in 2016 compared to 2015. The decline has been similar tothat of crashes in the Greater Adelaide Area. Rural fatal crashes have decreased from 53 in 2015 to 45 in 2016 (5 year average of 50).Serious injury crashes have declined from 266 in 2015 to 235 in 2016 (5 year average of 274). 56% of fatal crashes in rural areas were singlevehicle crashes such as the vehicle rolling over or hitting objects such as trees, a slight decrease from 57% in 2015. Young road users - The number of 16-19 year old fatalities dropped from 7 in 2015 to 3 in 2016, while the number of 20-24 year oldfatalities increased from 9 in 2015 to 12 in 2016, also above the previous 5 year average of 10 (2011-2015). In contrast, the number ofserious injuries in the 16 -19 year age group increased to 81 in 2016 compared to 71 in 2015, and above the 5 year average of 74 (20112015). There was a slight increase in serious injuries for the 20-24 year old age group to 86 in 2016 compared to 84 in 2015, but still wellbelow the 5 year average of 100 (2011-2015). Older road users – while fatalities and serious injuries for older road users aged 70 remained relatively stable in 2016 compared to 2015,there was a notable increase in the 90 age group with 4 fatalities and 11 serious injuries in 2016 compared to 1 fatality and 5 seriousinjuries in 2015 and an average of 2 fatalities and 2 serious injuries (2011-2015). Drivers – fatalities and serious injuries decreased in 2016 compared to 2015. The number of fatalities of light vehicle drivers droppedsignificantly to 36 in 2016 compared to 51 in 2015 and an average of 47 (2011-2015). In contrast there were 5 heavy vehicle driver deathscompared to just one in 2015 and a 5 year average of 2 per year (2011-2015). The number of drivers seriously injured for both light andheavy vehicles also fell in 2016 compared to 2015.14Calculated using Willingness to Pay methodRoad Crashes In South Australia 2016
PrefaceThis publication presents information compiled from police reported crashes in South Australia for 2016 and is the forty-ninth edition in anannual series that commenced with 1967 data.How crashes are reported and processed?When a reportable road crash occurs, South Australia Police (SAPOL) collect the data through vehicle crash reports, which are entered intoSAPOL’s Vehicle Collision System (VCS). The reports are then electronically forwarded to the Safe Systems and Crash Investigation Unit of theDepartment for Planning, Transport and Infrastructure (DPTI) for further processing and geocoding. The information is checked for accuracy andconsistency to ensure the reliability of any published statistics. Processed crash data is stored in the DPTI ‘Road Crash Database’ (TARS).The data presented in this report is for information purposes only and should be used with care before drawing conclusions not contained inthis report. Details in this publication may differ from information previously released or published due to the database continually beingupdated with new information. Road crash information contained in this publication is derived from TARS.Please note data reported within this publication is correct at the time of extraction. Due to continual quality assurances and process updateshistorical data may not match previous publications.ScopeThe crash statistics included in this publication are confined to those crashes which: were reported to SAPOL (excludes SAPOL online crash reporting); occurred on a road defined in the Road Traffic Act 1961; were defined by the ATSB publication “Guidelines For Determining Events as Road Crashes in Australia” (published March 2000) involved at least one moving vehicle involved at least one person being killed or injured, vehicle towed away, or total property damage of 5000 or greater and includes all crashes that involved bicycles, motorcycles and scooters (irrespective of damage value or injury level)From 1 January 2013, DPTI only processed ‘property damage’ crashes with an aggregated damage value of 5000 or greater. This representsa change from previous reporting, where the value of ‘property damage’ crashes processed by DPTI since July 2003 was 3000. Precedingthis, ‘property damage’ crash value was 1000 introduced in 1 January 1998.Related PublicationsAll monthly and annual statistical reports are available from DPTI’s Road Safety websitehttp://towardszerotogether.sa.gov.au/road crash facts/sa crashesRoad Fatalities in South Australia (monthly)Road Fatalities Involving Heavy Vehicles in South Australia (monthly)Road Crash Serious Injuries in South Australia (monthly)Road Crash Serious Injuries Involving Heavy Vehicles in South Australia (monthly)Road Crashes in South Australia annual reportsSouth Australian Road Safety Progress Report (Quarterly)Road Safety Fact SheetsAcknowledgementsAcknowledgment is extended to the South Australian Police for supply of reported road crash reports.NotesFrom 1 January 2013, new ABS boundaries were introduced into the coding corresponding to the Greater Adelaide City Statistical Area replacingthe previous metro/rural boundaries. As a consequence, Mt Barker and Adelaide Hills Council, part of Mallala, Barossa and Light Councils arenow incorporated into Metropolitan Adelaide.5Road Crashes In South Australia 2016
Definitions & Explanatory NotesBACBlood Alcohol Concentration (mg/100mL).BicycleAny two or three wheeled device operated by pedals and propelled by human power. Includes motorised bicycles.Bicycle RiderA person occupying the controlling position of a bicycle.BicyclistA bicycle rider or passenger.DriverA controller of a motor vehicle other than a motorcycle or bicycle.DrugMethamphetamine, MDMA (Ecstasy) and/or THC (cannabis).DPTIDepartment of Planning, Transport & Infrastructure.CasualtyAny person killed or injured as a result of a crash.Casualty CrashCrash where someone had been killed or injured as a result of the crash.DCADefinition for Coding Accidents – a coding system to describe the events involved in a crash. The ‘crash-type’ is basedon the traffic movements leading up to the crash. Participant intent, as well as actual movement, is used indetermining the DCA crash type.Fatal CrashA crash where there is at least one fatality.FatalityA person who dies within 30 days of a crash as a result of injuries sustained in that crash.Heavy VehicleHeavy vehicle includes the following vehicle types: Rigid truck, Semi-Trailer, Bus, B Double and other defined specialvehicle.Intersection CrashA crash for which the first impact occurs at or within a 20 metre radius of an intersection.MetropolitanGreater Adelaide City Statistical Area. Comprises of the following local government areas: Adelaide, Burnside,Campbelltown, Charles Sturt, Holdfast shores, Marion, Mitcham, Norwood, Payneham & St Peters, Onkaparinga,Playford, Port Adelaide & Enfield, Prospect, Salisbury, Tea Tree Gully, Unley, Walkerville, West Torrens, Adelaide Hills,Mount Barker, Gawler and part of Barossa, Light and Mallala councils.Mid-block CrashA crash that occurs between two intersections.Minor InjuryA person who sustains injuries requiring medical or surgical treatment, either by a doctor or in a hospital, but is notadmitted to hospital, as a result of a road crash and who does not die as a result of those injuries within 30 days ofthe crash.Minor Injury CrashA crash where at least one person sustains minor injuries.Motor VehicleAny road vehicle which is mechanically or electrically powered but not operated on rails.MotorcycleAny mechanically or electrically propelled two or three wheeled vehicle with or without side-car; includes solomotorcycle, motorcycle with sidecar, motor scooter, mini-bike, and quad bikes.Motorcycle RiderA person occupying the controlling portion of a motorcycle.MotorcyclistMotorcycle rider or pillion passenger.Other Road UserOccupants/controllers of animal drawn vehicles, ridden animals, railway vehicles, tram, and other defined specialvehicle.Other Vehicle TypeAnimal drawn vehicles, ridden animals, railway vehicles, and tram.PassengerAny person, other than the controller, who is in, on, or falling from a road vehicle at the time of the crash, provideda portion of the person is in/on the road vehicle. It does not include those that are boarding or alighting a road vehicleat the time of the crash.Passenger VehicleIncludes all cars and car derivatives including 4WDs, vans, utilities and station wagons. Excludes heavy vehicles, lighttrucks ( 4.5 tonnes), motorcycles and bicycles.6Road Crashes In South Australia 2016
PedestrianAny person who is standing, walking, playing, lying on the road or alighting or boarding a road vehicle at the time ofthe crash. It does not include those that have fallen from a vehicle. Also Includes riders and passengers of motorisedwheelchairs/wheelchairs, small wheeled vehicles and gopher users.Pillion PassengerA passenger on but not controlling a motorcycle.Property Damage CrashA crash resulting in property damage in excess of 5000 or where at least one vehicle has been towed away and inwhich no person is injured or dies within 30 days of the crash.Road CrashAny apparent unpremeditated event reported to the police and resulting in death, injury or property damage inexcess of the prescribed amount, and attributed to the movement of the road vehicle on a road.Road UserAny person who is a pedestrian, rider, or the occupant of a road vehicle.RuralArea outside of metropolitan Adelaide. Comprises of the following local government areas: Ceduna, Cleve, Elliston,Franklin Harbor, Kimba, Lower Eyre Peninsula, Port Lincoln, Streaky Bay, Tumby Bay, Whyalla, Cooper Pedy, FindersRangers, Port Augusta, Roxby Downs, Alexandrina, Kangaroo Island, Victor Harbor, Yankalilla, Grant, Mount Gambier,Naracoorte Lucindale, Robe, Tatiara, Wattle Range, Berri & Barmera, Karoonda East Murray, Loxton Waikerie, MidMurray, Murray Bridge, Renmark Paringa, Southern Mallee, The Coorong, Barunga West, Calre & Gilbert Valleys,Copper Coast, Goyder, Mount Remarkable, Northern Areas, Orroroo/Carrieton, Peterborough, Port Pirie, Wakefield,Yorke Peninsula and part of Barossa, Light and Mallala councils.Serious CasualtyA fatality or serious injury.Serious Casualty CrashA crash where at least one fatality or serious injury occurs.Serious InjuryA person who sustains injuries and is admitted to hospital for a duration of 24 hours or more as a result of a roadcrash and who does not die as a result of those injuries within 30 days of the crash.Serious Injury CrashA non-fatal crash in which at least one person is seriously injured.Vehicle OccupantDriver or passenger within a motor vehicle.Speed definitionBased on NSW Roads and Traffic Authority criteria for determining whether or not a crash is to be considered as having involved speeding as acontributing factor. A motor vehicle is assessed as having been speeding if it satisfies the conditions described below:a)b)7The vehicle’s controller (driver or rider) was charged with a speeding offence; or the vehicle was described by police as travelling atexcessive speed; or the stated speed of the vehicle was in excess of the speed limit; or the vehicle weight or the speed of the vehiclewas faster than that allowed for the licence class of the driver or rider, or the vehicle weight ORThe vehicle was performing a manoeuvre characteristic of excessive speed, that is: while on a curve the vehicle jack-knifed, skidded, slid or the controller lost control; or the vehicle ran off the road while negotiating a bend or turning a corner and the controller was not distracted bysomething or disadvantaged by drowsiness or sudden illness and was not swerving to avoid another vehicle, animal or object and the vehicle did not suffer equipment failure.Road Crashes In South Australia 2016
CRASH & CASUALTY TRENDSHistorical DataFatality RatesInterstate and International ComparisonsCauses of DeathRoad User TypeAge & SexRegion8Road Crashes In South Australia 2016
Table 1: Trends in South Australia, 1995 – 637666594657574CrashesMinorTOTALInjury 16991708Vehiclekilometerstraveled4(‘000 5535142121461516313167151691510, atalities per10,000licence100,000holders5 880.810.580.650.511At December 2016. Excludes tractors, trailers, caravans, plant and equipment. Source: TRUMPS database, Registration & Licensing Section, DPTIAt December 2016. Source: TRUMPS database, Registration & Licensing Section, DPTI3 Population as of June 2016. Source: Australian Bureau of Statistics, Australian Demographic Statistics, cat.no. 3101.0.4 Travel for the year ended June 2016. Source: Australian Bureau of Statistics, Survey of Motor Vehicle Use, cat. no. 9208.0.5 Licence holder fatality rates are based on driver and rider fatalities only.Notes:From 1 July 2003, DPTI began to only process property damage crashes where the value was 3000 or greater or the vehicle was towed away regardless of the damage value. Previous to this it was 1000.From 1 January 2013, DPTI began to only process property damage crashes where the value was 5000 or greater or the vehicle was towed away regardless of the damage value.DPTI TARS road crash database is continually being updated so historical data may not match with previous reported data.29Road Crashes In South Australia 2016
Figure 1: Data Trends in South Australia, 1995 - 20162400160022001400Serious Casualties &Population ('000)180012001600100014001200800Serious Casualties1000800Population ('000)600Vehicles registered ('000)Vehicles registered ('000) &Licence Holders ('000)2000Licence Holders ('000)600400Figure 2: Fatality Rates in South Australia, 1995 - 20163.0014.00102.50per 10 000 vehicles registeredper 100 000 population2.0012.00per 100 million tion Fatality RateLicence Holders, Vehicles Registered & VKTFatality Rateper 10 000 licence holdersRoad Crashes In South Australia 2016
Table 2: Comparison with other Australian States1, 2016Population3 (‘000)1717Fatalities per 10000 vehicles0.61Fatalities per100 3810.765.37Fatalities86Vehicles on register2(‘000)1,419New South Wales383Victoria291QueenslandWestern AustraliaSOUTH AUSTRALIATasmaniaAustralian Capital TerritoryNorthern TerritoryAUSTRALIATable 3: Road Crash Fatalities by Age Group compared with Deaths ofAll Causes, 2015Road Fatalities5Age 70 UnknownTOTALDeaths from All 79785131114230102% of All Deaths5%22%19%10%12%6%3%1%1%0%0%1%1Australian data based on information published by the Bureau of Infrastructure, Transport and Regional Economics (BITRE) for 2016 Statistical Summary.Australian figures (except SA) are as at January 2016. Source: Australian Bureau of Statistics, Motor Vehicle Census Australia, cat. no. 9309.0. These figures maynot agree with registration statistics for individual States and Territories. Data for SA sourced from TRUMPS, as of December 2016.3 Population as of June 2016. Source: Australian Bureau of Statistics, Australian Demographic Statistics, cat.no. 3101.04Source: Australian Bureau of Statistics, Deaths, Australia 2015, cat.no. 3302.0.5 Source: DPTI’s TARS road crash database.211Road Crashes In South Australia 2016
Table 4: Casualties by Road User Type and Severity, 1995 - 2016Vehicle illion 97979847558596357618056675982617863647452Other Road 6325331000001400000ALL ROAD 246290616358005787F – Fatality, SI – Serious Injury, MI – Minor Injury12Road Crashes In South Australia 2016
Table 5: Casualties by Age Group and Severity, 1995 – 9222422232370 1561391471171259911911810394971081
The estimated cost of crashes to the community in 2016 was 1.64 billion1. The 86 fatalities that occurred in 2016 is the lowest on record and resulted in a fatality rate per 100 000 population of 5.03, lower than the national average of 5.37 Greater Adelaide Area - Fatal and serious injury crashes decreased in 2016 compared to 2015. There were .
