Transcription
Table of ContentsPageI.Project Summary1, 2II.The Tailgating Problem in Minnesota3III. Minnesota’s Tailgating Pilot Project3IV. Project Partners4V.4TimelinesVI. Public Information, Education, Media4, 5VII. Main Differences from the Pennsylvania Project5VIII. Three-second Following Distance5IX. Site Selection6X.6Law EnforcementXI. Pavement Dots6XII. Signs7XIII. Evaluation Methodology8XIV. Outcomes8XV. Outcome Data9, 10XVI. Funding & Costs11XVII. Restoration, Abatement & Expansion11XVIII. Lessons Learned11XIX. Contact Information12XX. Print Media Samples13 - 17
Project SummaryIn 2006, the Minnesota Departments of Transportation and Public Safety partnered with the WrightCounty Highway Department and the Safe Communities Coalition of Wright County to pilot aTailgating Treatment Program similar to a Pennsylvania project honored with a 2001 National HighwaySafety Award. The Minnesota project was viewed as a tool to educate motorists on how to identify andmaintain a minimum safe following distance, and ultimately to reduce rear end crashes.The primary components of the project were:Roadway: A section of State Highway 55 in Wright County was used to paint 94 elliptical dots, spaced225 feet apart, along a two-mile segment of the rural, single-lane, 55 mile-per-hour roadway. The dotswere painted within a section of Highway 55 that was previously designated a “Toward Zero Deaths”corridor. The study corridor had an estimated average travel rate of 16,000 vehicles per day, nodedicated left turn lanes, minimal grade differences, and no congestion issues. In addition to the dots, aseries of four different signs directing motorists to maintain at least two dots between them and thevehicle ahead were placed along the corridor.Following Distance: To maintain consistency with information currently provided through drivertraining and other safe driving programs, the project used the three-second minimum safe followingdistance strategy.Law Enforcement Activity: The project did not include an enhanced enforcement component. Thisprovided an opportunity to evaluate the engineering and public information components in modifyingdriver behavior independent of an enhanced enforcement deterrent.Public Information Campaign: The public was informed of the project through the distribution ofinformational handouts at area businesses, local mailings, and a June 22 press event. The projectreceived television, radio and print coverage throughout the state, as well as national coverage by theNew York Times and other publications outside Minnesota.Evaluation Criteria: Vehicle headway data was collected for 48 hours prior to and after installation ofthe pavement marking dots and signs. Traffic counting tubes were set one-mile prior to the beginning ofthe marking location, at the mid-point of the marking location, and one-mile after the marking location,in both east and west bound lanes. The raw data was filtered to exclude vehicles following at sevenseconds or more, vehicles traveling under 45 mph, and vehicles with more than two axles.Outcome: The combination of all data collection points showed an increased average gap from 2.35 to2.52 seconds, or 14.1 feet. The greatest average increase occurred at the mid-point location, where theaverage gap increased from 2.36 to 2.62 seconds, or 22.9 feet. The average gap increased from 2.49 to2.64 seconds, or 12.9 feet at the points placed one-mile after the marking locations.When excluding the data from collection points set one-mile prior to the marking location, the overallaverage gap increased by 17.9 feet. This more accurately reflects the projects impact as behavioralchanges should not be expected prior to the application site.Page 1
In addition to collecting headway data, the tubes also recorded speed data along the posted 55 mphcorridor. Speeds at all points along the study corridor showed an overall average reduction from 58.6 to57.9 mph, or -0.6 mph. Average speeds one-mile prior to the marking location decreased from 58.8 to56.8 mph, or -2.0 mph. Average speeds decreased from 59.7 to 58.6 mph, or -1.1 mph at both pointsone-mile into the marking location, and at points one-mile after the marking locations the average speedincreased from 56.9 to 58.4 mph, or 1.5 mph. (Speeds are rounded to one decimal point.)Funding and Costs: The Minnesota Department of Public Safety, Office of Traffic Safety (OTS)contracted with the Minnesota Department of Transportation Office of Traffic Security and Operations(MN/DOT) to provide labor, materials, printing and equipment needed to create a template, paint dots,fabricate signs, and to produce public information pieces. The OTS receives funding from the NationalHighway Traffic Safety Administration (NHTSA), under the State and Community Highway SafetyProgram (Public Law 89-564) to address highway safety problems in Minnesota. The total costexpended on the project was 14,865.74. Additionally, numerous staff hours from Wright County,MN/DOT, and OTS were provided “in-kind.”Additional project details can be found in the following pages of this report.Page 2
The Tailgating Problem in Minnesota: In 2002 there were 22,206 rear-end crashes resulting in 21 deaths. Rear end crashes accounted for23.3% of the total crashes and 3.1% of the total traffic fatalities in the state.2003 saw an increase in fatal rear-end crashes resulting in 28 fatal crashes killing 30 people. Thisaccounted for 4.8% of the total fatal crashes and 4.5% of the total traffic fatalities in the state.1In 2004 rear end crashes increased to 25,621, accounting for 27.6% of the total crashes. Rear endcrashes killed 19 people, representing 3.3% of the total traffic fatalities in the state in 2004.In comparison to 2004, rear end crashes dropped to 24,820 in 2005, yet remained higher than 2002.In 2005 rear end crashes represented a higher percentage of all crashes 28.2%, fatal crashes, 21, andfatalities, 22 when compared to 2004 statistics.Year2002200320042005Total or AverageTotal Rearend Crashes22,206Not available25,62124,820Total Crash%23.3%Not available27.6%28.2%26.36%Total fatalRear-endCrashes2028192188Total Rearend CrashFatalities2130192292TotalFatality %3.1%4.5%3.3%3.9%3.7%Given the fact that the number of vehicles with anti-lock braking systems has increased each year, thisrelatively new technology is not causing any consistent downward trend in rear-end crashes. Thisindicates that the problem lies with driver behavior, not vehicle deficiency.Minnesota’s Dot Tailgating Pilot Project:Given the successes, relatively low implementation cost, and the measurable benefits of a Pennsylvaniadot program honored with a 2001 National Highway Safety Award, Minnesota piloted a similar projectin 2006. The project was viewed primarily as a tool to help educate motorists on how to identify andmaintain safe minimum following distances, with the hope that drivers will apply the same learnedbehavior on other roadways.Minnesota used similar engineering elements from the Pennsylvania program. Use of ellipticalpavement dots, informational signs, and a strong public information campaign were the main elementsused from the Pennsylvania project. The primary exceptions to the Pennsylvania project included the useof a rural single-lane 55 mile per hour roadway, a three-second safe following distance criteria, noadditional law enforcement activity, and non-crash related evaluation criteria. Greater detail of each ofthese elements is explained later in this report.12003 Minnesota Motor Vehicle Crash FactsPage 3
Project Partners: Wright County Highway DepartmentSafe Communities Coalition of Wright CountyWright County Sheriff’s OfficeMinnesota Department of TransportationMinnesota Department of Public Safety, Office of Traffic SafetyMinnesota State PatrolNational Highway Traffic Safety AdministrationBuffalo Police DepartmentContact information can be found at the end of this report.Timelines: October 2005: Project planning began.April 2006: FHWA approval to experiment granted.June 6 through June 8, 2006: 48 hours of pre-project weekday headway data collected.June 19: Signs placed and pavement marking dots painted.June 22: Kick-Off/Press Event held.July 25 through July 27, 2006: After-data collected in the same manner and same weekdays asthe pre-project data.Public Information, Education and Media:The primary role of the Safe Communities Coalition of Wright County was to coordinate all publicinformation, education and media efforts for the project. Executive Director Patricia Hackman wasinstrumental in the development and distribution of the public information piece, press releases, andcoordination of the press conference announcing the project to the public.On June 22 a press conference was held at the Wright County Government Center in Buffalo,Minnesota. A press release from the Minnesota Department of Public Safety was coordinated with themedia event. Project information was aired on all of the major metropolitan network television newsprograms: WCCO Channel 4, KSTP Channel 5, KMSP Fox 9, and KARE Channel 11.Radio interviews were aired on the following stations:StationKTLK-FM Fox News TalkWCCO-AM News RadioMNN Radio NetworkMN Public RadioAreaTwin CitiesTwin Cities & statewideStatewideStatewideKCLD-FM Top 40 PopKNSI-AM News RadioLandline Now XM Trucker RadioSt. CloudSt. CloudMissouri/NationalPage 4InterviewedDan Brannan, Mn/DOTPat Hackman, Wright Co.Pat Hackman, Wright Co.Kathy Swanson, Director, Office ofTraffic SafetyPat Hackman, Wright Co.Pat Hackman, Wright Co.Gordy Pehrson, Mn/DPS
Mn/DOT’s Office of Traffic, Security and Operations created a Tailgating Project Web site;www.dot.state.mn.us/trafficeng/tailgating that featured public information and a list of frequently askedquestions (FAQ’s).The DPS Office of Traffic Safety (OTS), and the DPS Communications Office acted in an advisorycapacity with public relations and information efforts. Print and web articles included: Minneapolis Star Tribune, June 23.Delano Eagle, June 26.Annandale Advocate, June 28.Wright County Journal Press, June 30.Officeroutlook.com, June, 2006.Stateline.org, July 7.Politicalgateway.com, July 7The New York Times, July 21The Urban Transportation Monitor, July 21.The Buffalo Allina Hospital’s Healthy Communities Magazine featured the project in their Fall 2006publication. The magazine is distributed to about 60,000 homes and businesses in the Wright Countyarea.A sample of some print media pieces can be found at the end of this report.Main differences from the Pennsylvania project: Three-seconds was used as the safe following distance criteria as opposed to two-secondsused in the Pennsylvania study.A rural, single-lane, 55 mile per hour roadway was used for the study corridor.Additional law enforcement activity was not requested.Following distance measurements were used for evaluation criteria as opposed to crashstatistics used in the Pennsylvania study.Three-second following distance:The two main causes of rear-end crashes are driver inattention and following too closely.2For several years, safe driving literature, text books, and driver educators used the two-second followingdistance strategy as the minimum safe following distance under ideal conditions. More recently thisstrategy was revised to three-seconds.3 To support this strategy, three-seconds was used as the minimumsafe following distance under ideal conditions for purposes of this pilot project.23“Front end Analysis of Rear end Crashes,” FHWA, May 1992Alliance for Safe Driving, “License to Drive,” 2000, Page 28-31Page 5
Site Selection:A two-mile segment of east and west bound lanes of State Highway 55 in Wright County was selectedusing the following criteria: Rural driving environment.Single lane 55 mph corridor.Average Daily Traffic (ADT) rate of approximately 16,000 vehicles.Absence of multiple intersections, dedicated left turn lanes, significant grade differences, andtraffic congestion.Presence of an active Safe Communities Coalition with a Toward Zero Deaths (TZD)CorridorThe specific 2-mile section of State Highway 55, between County State Aid Highway 14 on the westand Deadrick Avenue to the east, was identified as the preferred site due to the 16,000 vehicle ADT, andthe absence of multiple intersections, dedicated left turn lanes, significant grade differences, and trafficcongestion. Two county roads intersect with the study corridor. The absence of multiple intersectionswithin the study area assured that a significant majority of drivers were exposed to the entire treatmentsite. This provided a manageable control for the evaluation of the projects effectiveness in changingdriver behavior. The decision to use a rural, single-lane, 55 mph corridor was made because this type ofroadway was not included in the Pennsylvania study, and rural, single-lane, 55 mph roads are the mostprevalent type of roadway in Minnesota. More than 50% of the fatal crashes in Minnesota occur onrural, single-lane, 55 mph roads. Therefore innovative, low-cost safety solutions have the greatestpotential for success.Law Enforcement:Involvement with the Wright County Sheriff’s Office, Buffalo Police Department, and the MinnesotaState Patrol, played an important role in the project. Law enforcement was requested to help educatemotorists through the distribution of an informational handout given to motorists during routine trafficstops and public meetings in the Wright County area. Officers were not asked to modify currentenforcement activities along the corridor. The working group believes the exclusion of enhancedenforcement activities along the corridor during the pilot aided in obtaining a clearer evaluation of theproject’s effectiveness in modifying driver behavior.Pavement Dots:A total of 94 equally spaced elliptical dots (47 in each direction), spaced 225 feet apart, were painted inthe center of east and west bound travel lanes by Traffic Marking Services Inc. using a template andlatex paint. The dots provided motorists with a physical reference reinforcing safe following distancesbetween vehicles. The dots were spaced 225 feet apart, so two dots were visible to motorists followingothers with three-seconds between them, when traveling at 55 miles per hour - the posted speed limit onthe corridor. In accordance with MUTCD standards for oblong pavement markings, the width to heightratio is 1:3. (2.5 ft by 7.5 ft.) for each dot. The dots were considered experimental and went through theapproval process by FHWA.Page 6
Signs:In accordance with the 2003 Manual on Uniform Traffic Control Devices (MUTCD), a formal request toexperiment using signs that were not included in the MUTCD was submitted with the Federal HighwayAdministration (FHWA) Office of Transportation Operations. FHWA granted approval on April 6,2006.Mn/DOT engineers designed the signs and determined their placement along the study corridor tomaximize their effectiveness. The signs were posted for both east and west bound traffic and werelimited to four specific messages:Posted prior to the treatment site.Posted within the treatment site. The symbol promoted conveyance of the basic message to motoriststhat may have difficulty reading the entire sign.Posted within the treatment site.Posted after the treatment site.Page 7
Evaluation Methodology:The use of rear-end crash data for project evaluation would require data to be collected over severalyears. Therefore, specific gap measurements were used as the primary evaluation criteria. This datacollection method also provided speed measurement data. Therefore, speed measurements are includedas a secondary project evaluation tool.Vehicle headway data was collected for 48 hours beginning Tuesday, June 6 through Thursday, June 8,2006, prior to the installation of the signs and pavement marking dots. Traffic counting tubes were setfor each direction of travel approximately one mile prior to the beginning of the pavement markinglocation, one mile into the planned markings, and one mile after the planned marking location.The pavement marking dots were painted June 19th, 2006 and “after data” was collected in the samemanner and same weekdays from July 25 through the 27.The data was collected with TimeMark’s, Lambda counting machine with two tubes set in each locationspaced 16 feet apart. Layout number 52 of the Lambda machine was used to format the data and exportinto an Excel database.The volume of raw data totaled 88,738 vehicles. The raw data was filtered to exclude vehicles followingat seven-seconds or greater and vehicles with more than two axles. Additionally, vehicles traveling atabnormally low speeds, less than 45 miles per hour, were excluded from the data, as it was likely thatthey were farm implement or permitted special use vehicles.Outcomes:The combination of all data collection points showed an increased average gap from 2.35 to 2.52seconds, or 14.1 feet. The greatest average increase occurred at the mid-point location, where theaverage gap increased from 2.36 to 2.62 seconds, or 22.9 feet. The average gap increased from 2.49 to2.64 seconds, or 12.9 feet at the points placed one-mile after the marking locations.When excluding data from collection points set one-mile prior to the marking location the overallaverage gap increased by 17.9 feet. This more accurately reflects the projects impact as behavioralchanges should not be expected prior to the application site.In addition to collecting headway data, the tubes also recorded speed data along the posted 55 mphcorridor. Speeds at all points along the study corridor showed an overall average reduction from 58.6 to57.9 mph, or -0.6 mph. Average speeds one-mile prior to the marking location decreased from 58.8 to56.8 mph, or -2.0 mph. Average speeds decreased from 59.7 to 58.6 mph, or -1.1 mph at both pointsone-mile into the marking location, and at points one-mile after the marking locations the average speedincreased from 56.9 to 58.4 mph, or 1.5 mph. (Speeds are rounded to one decimal point.)Page 8
Outcome DataData Collection Points; east and west bound lanes: Site A: Approximately one-mile prior to the beginning of the marking location. Site B: Mid-point of the dots marking location. Site C: One-mile after the marking location, in both east and west bound lanes.AVERAGEGAP(Seconds)AVERAGEGAP INCREASE(Seconds)AVERAGESPEED(MPH)AVERAGEGAP .1757.5014.36Site AEast & West:BeforeAfter2.222.280.0657.845.20Site BEast & West:BeforeAfter2.362.620.2659.1522.86Site CEast & INTSAll:All East:All West:Page 9
All Collection SitesN Sample VolumeNGapSpeedPre-Project56,6482.3558.58P Probability of changeDuring Project55,9222.5157.95ChangeP 0.16-0.62 .0001 .0001All East Bound Collection SitesNGapSpeedPre-Project26,4982.3359.98During Project25,9892.4958.27ChangeP 0.15-1.70 .0001 .0001All West Bound Collection SitesNGapSpeedPre-Project30,1502.3657.34During Project29,9332.5457.67ChangeP 0.17 0.32 .0001 .0001East and West (Site A)NGapSpeedPre-Project19,0502.2258.84During Project18,5352.2856.81ChangeP 0.06-2.03 .0001 .0001East and West Mid-Point (Site B)NGapSpeedPre-Project20,8852.3659.68During Project20,2132.6258.60ChangeP 0.26-1.08 .0001 .0001East and West Mid-Point (SiteC)NGapSpeedPre-Project16,7132.4956.89During Project17,1742.6458.42Page 10ChangeP 0.15 1.52 .0001 .0001
Funding and Costs:The Minnesota Department of Public Safety, Office of Traffic Safety (OTS) initially set aside 25,000for a contract with the Minnesota Department of Transportation Office of Traffic Security andOperations (MN/DOT) to provide labor, materials, printing and equipment needed to create a template,paint dots, fabricate signs, and to produce public information pieces. The OTS funding is apportioned bythe National Highway Traffic Safety Administration (NHTSA), under the State and CommunityHighway Safety Program (Public Law 89-564) to address highway safety problems in Minnesota. Thetotal cost for the project was 14,865.74. Additionally, numerous staff hours from Wright County,MN/DOT, and OTS were provided “in-kind.”Test Location Restoration, Abatement, or Expansion Considerations:In the spring of 2007, Mn/DOT officials will consider restoration or abatement of the existing dots andsigns along the study corridor and explore the feasibility of expanding the project to roadways in otherparts of the state. Restoration would require repainting each of the 94 dots and could include a reevaluation component. Abatement would require the removal of eight signs and painting over theremnants of the 94 dot markings.Lessons Learned:In July, 2006 the Minnesota Motorcycle Safety Advisory Committee (MMSAC) expressed concern overpotential traction issues for motorcyclists traversing the painted dots. This issue was discussed by theplanning committee at the beginning of the project planning process. It was agreed that motorcycletraction issues were not a concern as the pilot roadway did not include sharp turns and the size andplacement of the dots provided motorcyclists adequate space to safely ride on either side of the dots.If the decision is made to expand the project beyond the pilot corridor the OTS Coordinator agreed thatthe MMSAC should be consulted, and if their safety concerns are justifiable, alternative paint designscould be explored.As a result of the Wright County Tailgating project, Senator Amy Koch expressed interest in updatingMN laws that address tailgating. She had senate researchers’ review legislation throughout the country.The researchers found specific wording that may make it easier for officers to cite tailgating behavior ifadded to Minnesota laws. Senator Koch is working on this issue with Buffalo Police Chief MitchWeinzetl. It is possible that Senator Koch will submit a proposal to the upcoming legislative session.Page 11
Contact Information:Patricia Hackman, Executive DirectorSafe Communities of Wright CountyP.O. Box 335St. Michael, MN. 55376(763) 241-9888safecommunitieswc@charter.netWayne Fingalson, Wright County Engineer1901 Highway 25 NorthBuffalo, MN. 55313-3033(763) 682-7388wayne.fingalson@co.wright.mn.usDan Brannan, Traffic Safety SpecialistMinnesota Department of Transportation, Office of Transportation Security and Operations1500 West County Road B2, MN 725Roseville, MN. 55113-3174(651) 634-5102Daniel.brannan@dot.state.mn.usTom Dumont, Traffic EngineerMinnesota Department of Transportation, District 33725 12th Street NorthSt. Cloud, MN. 56303(320) 223-6540Thomas.Dumont@dot.state.mn.usDave Engstrom, State Traffic Safety EngineerMinnesota Department of Transportation, Office of Transportation Security and Operations1500 West County Road B2,Roseville, MN. 55113-3174(651) 634-5100Gordy Pehrson, Traffic Safety CoordinatorMinnesota Department of Public Safety, Office of Traffic Safety444 Cedar Street, Suite 150St. Paul, MN. 55101-5150(651) 201-7072gordy.pehrson@state.mn.usPage 12
Media Sample #1:Sun Newspapers, January 17, 2006; By John HollerWright County to try experimental program to stop roadwaytailgating;Project to focus on Hwy. 55 between Buffalo and RockfordWith the growth of Wright County, the roadways used to get people from one place to another –whether a commute to work or a quick run to the grocery store – have become much more congested.As a result, there has been more tailgating, as people in a hurry still look for the chance to get fromPoint A to Point B as quickly as possible.At the Tuesday, Jan. 10, meeting of the Wright County Board, the commissioners were informed of apilot project that will combine information and enforcement in order to prevent accidents by keepingtailgating to a minimum. Wright County Highway Engineer Wayne Fingalson told the board of aproject from the Minnesota Department of Public Safety that is designed to teach about tailgating aswell as prevent it.“We’ve been given a 25,000 grant from the state to implement the program on Hwy. 55 betweenBuffalo and Rockford,” Fingalson said. “It keeps with the theories that have been taught abouttailgating – whether it’s the 3-second rule in between cars or the one car length for every 10 miles anhour rule. Under this system, a series of dots will be painted on the road and drivers will have avisual to see how close is too close.”The project, which began with a pilot program in Pennsylvania, will have signage explaining thatdrivers must remain two of the road-painted dots behind the vehicle in front of them. In thePennsylvania study, it was determined that crashes were reduced by 55% on the roads in which thesystem was implemented and it is hoped that Hwy. 55, which is a heavily congested and welltraveled roadway, will do the same. But Fingalson said enforcement will be the key.“The state patrol is run by the Department of Public Safety, so additional enforcement will beprovided,” Fingalson said. “The intent isn’t to give out more tickets, but to remind drivers howdangerous tailgating can be.”The project is expected to be undertaken in June.This site and its contents Copyright 2005. Sun Newspapers- Main Office: 952-392-6800 webinfo@mnsun.com -Page 13
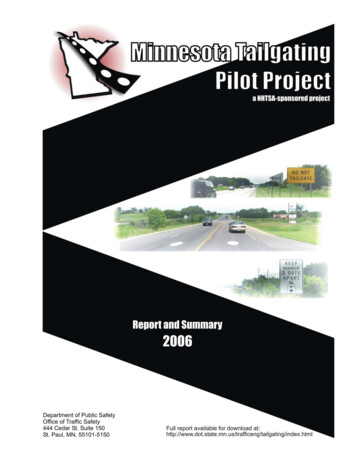
Media Sample #2:Stateline.org, July 7, 2006; By John GramlichFriday, July 07, 2006State DOTs hope drivers see dots By John Gramlich, Special to Stateline.orgFor drivers who get anxious when cars grow biggerand bigger in their rear-view mirrors, cheap and easyhelp may be on the way – oval-shaped dots paintedon the highway or hot-pink panels along the side ofthe road.Test programs in Maryland, Minnesota andPennsylvania aim to curb tailgating by using roadmarkers that alert motorists to distances betweenvehicles. The markers serve as a tangible reminder ofcommonly taught driving guidelines such as the“two-second rule,” which urges drivers to stay at leasttwo seconds behind the car ahead.Unlike the two-second rule, however, the roadmarkers provide motorists with accurate, measuredfollowing distances.The Minnesota Department of Transportationannounced June 22 that a two-mile stretch of stateHighway 55 about 40 miles northwest of Minneapolishas been painted with 94 white, oval-shaped“distance dots.” Spaced 225 feet apart in a zone withImage courtesy of Minnesota Department ofa 55-mph speed limit, the dots are accompanied byTransportationsigns reading “Keep Minimum 2 Dots Apart” and “2 Along Minnesota’s state Highway 55,Dots 3 Seconds” – the latter being true if motorists two dots equal three seconds offollowing time at 55 mph.stick to the speed limit.Minnesota recently began recommending three seconds between cars, though it hasrecommended two seconds in the past, said Gordy Pehrson of the Department of Public Safety,which has worked with the transportation department on the project.“Partially due to the aging population and faster, heavier traffic, three seconds is the best wayto go,” Pehrson said.Image courtesy of Maryland TransportationAuthorityMotorists heading east on theChesapeake Bay Bridge will noticethis sign beginning in July.In Maryland, the state’s Transportation Authorityannounced May 19 that an eastbound section of theChesapeake Bay Bridge, about 40 miles east ofWashington, D.C., would use technology similar toMinnesota’s “distance dots.” But its plan, called“Keep Your Cool and Pace Your Space,” willexchange the dots for hot-pink panels along the sideof the road.The “Pace Your Space” program will use panelsbecause they can be mounted at drivers’ eye level andare easier to maintain than dots on the road, accordingto transportation spokeswoman Teri Moss. Thepanels were to be installed starting July 10, she said.Accidents are the main cause of congestion on theChesapeake Bay Bridge, a popular gateway toMaryland’s Atlantic coast, especially during summer.Rear-end collisions accounted for 58 percent of
crashes on the bridge between 2002 and 2004, with 70 percent occurring in eastbound lanes,Moss said.The Maryland and Minnesota programs owe allegiance to Pennsylvania, which first used antitailgating road markers in 2000 on a rural stretch of U.S. Route 11 near the town ofBloomsburg, about 100 miles northwest of Philadelphia – with eye-opening results.Like Minnesota’s project, the Pennsylvania test site used white dots painted on a two-laneroad. Pennsylvania, however, still recommends the two-second rule, and the dots on Route 11are spaced 115 feet apart – or two seconds, if motorists follow the road’s 45-mph speed limit.The program resulted in a 65-percent drop in accidents from November 2000 to March 2001compared with the previous year, according to the Pennsylvania Department of Transportation.That earned the program a National Highway Safety Award in 2001 from the Federal HighwayAdministration (FHA).In 2003, the FHA separately listed the program as a “Low-Cost Traffic EngineeringImprovement” that other states could replicate. Officials in Maryland and Minnesotadeveloped their programs based on Pennsylvania’s success.According to the FHA’s 2003 listing of the Pennsylvania program, installing one test site costs 1,892, including equipment, signs and labor. The recently unveiled site in Minnesota used a 25,000 federal grant to pay for the installation and a public information campaign. Marylandhas not disclosed the cost of its Chesapeake Bay Bridge plan.Since its initial success in 2000, Pennsylvania has experimented with the dots on a handful ofother sites, including on Interstates 80 and 81, according to Steve Chizmar, a statetransportation spokesman.But success has been greater on two-lane roads than on interstates and depends heavily onpolice enforcement of proper following distance, Chizmar said. South Centre Township, Pa.,police, who monitor the test site on Route 11, have issued about 15 citations a month foraggressive driving since the dots arrived, according to Chief of Police William Richendrfer.“It c
accounted for 4.8% of the total fatal crashes and 4.5% of the total traffic fatalities in the state.1 crashes killed 19 people, representing 3.3% of the total traffic fatalities in the state in 2004. In comparison to 2004, rear end crashes dropped to 24,820 in 2005, yet remained higher than 2002.