Transcription
IntoThinAirHow Leaking NaturalGas Infrastructure isHarming our Environment and Wasting aValuable Resource
Though natural gas has beenpromoted as a more climate-friendlyalternative, current analyses oftenfail to account for the gas that is lost,either intentionally or unintentionally.These losses, known as fugitiveemissions, amount to a significantsource of greenhouse gases.www.clf.org/naturalgas
Table ofContentsAuthor . . . . . . . . . . . . . . . . . . . . 5Introduction . . . . . . . . . . . . . . . . . 7Scope . . . . . . . . . . . . . . . . . . . . 9Background on DistributionInfrastructure in Massachusetts . . . . . . . 10Assessing the Climate ChangeImpacts from Fugitive Emissions . . . . . . 12Policy Options . . . . . . . . . . . . . . . . 14Leak Repair Classificationand Timeline Requirements . . . . . . . . . 14Limiting Cost Recovery forLost and Unaccounted for Gas . . . . . . . 16Expanding the TargetedInfrastructure Replacement Programs . . . 17Incorporating Leak Reductioninto Service Quality Standards . . . . . . . 20Enhanced Monitoringand Reporting . . . . . . . . . . . . . . . . 20Conclusion . . . . . . . . . . . . . . . . . . 21Infographics . . . . . . . . . . . . . . . . . 22Endnotes . . . . . . . . . . . . . . . . . . 24Appendices . . . . . . . . . . . . . . . . . 26
FOR A THRIVING NEW ENGLANDSince 1966, Conservation Law Foundation has usedthe law, science, policy making, and the businessmarket to find pragmatic, innovative solutions toNew England’s toughest environmental problems.Whether that means cleaning up Boston Harbor, protecting ocean fisheries to ensure continued supply,stopping unnecessary highway construction in scenic areas, or expanding access to public transportation, we are driven to make all of New England abetter place to live, work, and play. What’s more, wewww.clf.org/naturalgashave the toughness to hold polluters accountable,and the tenacity to see complex challenges throughto their conclusion. CLF is also nimble enough to adjust course as conditions change to achieve the bestoutcomes. Our goal is not to preserve what used tobe, but to create an even better New England — aregion that’s truly thriving.For more information visit:www.clf.org/naturalgas
Into Thin Air:How Leaking Natural GasInfrastructure is Harming ourEnvironment and Wastinga Valuable ResourceAuthor:Shanna Cleveland is a CLF Staff Attorney workingto advance climate protection through promotingenergy efficiency and renewable energy initiativesaimed at reducing reliance on fossil fuels. Shannaearned her B.A. from Harvard University withhonors and her J.D. from the University of VirginiaSchool of Law, where she served as an ExecutiveEditor for the Virginia Law Review. She worked asa litigation attorney before receiving her LL.M. inEnvironmental Law from the Vermont Law Schoolwith honors. She is admitted to practice in theCommonwealth of Massachusetts, the State ofHawaii, and the United States District Courts forMassachusetts and Hawaii.Acknowledgements:CLF would like to thank Ian Bowles, Massachusetts Secretary of Energy and EnvironmentalAffairs from 2007 to 2011, for his valuable input,as well as Nathan Phillips, Associate Professor atBoston University, for kindly sharing his resources,and finally Margaret Hendrick, a graduate studentat Boston University.This report was made possible with thegenerous support of the Barr Foundation.5
www.clf.org/naturalgas
INTRODUCTIONThough natural gas has been promoted recently asa more climate-friendly alternative to coal and otherfossil fuels for electricity, heating and transportation,current analyses of the life cycle emissions fromnatural gas often fail to account for the gas that islost, either intentionally or unintentionally, duringproduction, gathering, transmission and distribution.1Leaking pipelines areestimated to releasebetween 8 and 12billion cubic feet ofmethane annually inMassachusetts alone.Yet, current state andfederal policies actuallyprovide disincentivesfor pipeline owners toaggressively findand fix these leaksThese losses, known as fugitive emissions, comprisea significant source of greenhouse gases that mustbe properly quantified and mitigated to ensure thatour policies towards natural gas are congruent withMassachusetts’ climate change mandates.2A recent study from Boston University researchershighlighted the impacts of methane emissions fromthe region’s antiquated natural gas pipeline infrastructure.3 Not only do leaking pipelines posea threat to public safety, they are estimated torelease between 8 and 12 billion cubic feet of methane (the main constituent of natural gas) annually inMassachusetts alone.4 Yet, current state and federalpolicies actually provide disincentives for pipelineowners to aggressively find and fix these leaks. In addition, there is no reliable methodology for calculating the actual amount of “Lost and Unaccounted forNatural Gas”5 that escapes from the transmissionand distribution pipelines which makes it difficult toevaluate the magnitude of the issue from a greenhouse gas perspective. As a result, this avoidablesource of methane significantly adds to the aggregate of greenhouse gas emissions and is a majorcontributing factor to the impacts of climate changein the region and globally. Not only is this a source ofemissions that could easily be tackled, but addressing it will conserve a valuable resource and reduceratepayer costs. This paper calls for action to (1) increase the accuracy of reporting methane emissionsfrom natural gas infrastructure and (2) adopt policiesthat promote accelerated repair and replacementof infrastructure to reduce methane emissions andreduce the costs for lost and unaccounted for gas.SCOPEMethane leakage from natural gas systems isan issue that is beginning to gain much morewidespread attention in the United States, especiallynow that the Environmental Protection Agency hasbegun to require mandatory reporting and regulationof these emissions;6 however, the problem has beenwell known for decades, and voluntary and marketmechanisms have been developed on a nationaland international scale. For example, the GlobalMethane Initiative7, which evolved from the Methaneto Markets Partnership, and the EPA’s Natural GasStar Program have been working cooperatively withthe U.S. oil and gas industry since as early as 1993 todevelop cost-effectiveness technologies for reducingmethane emissions from every stage of oil and gas7
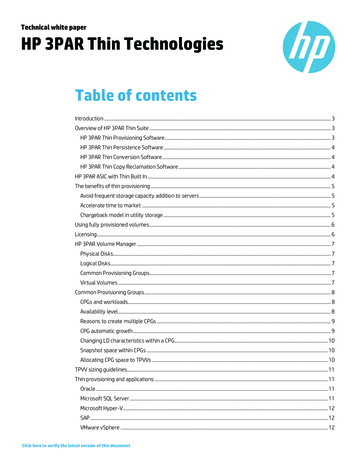
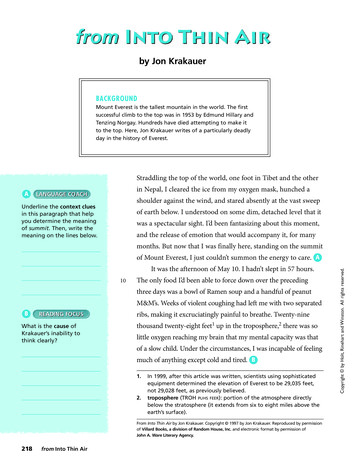
Methane leaks as mapped across the City of Boston byBoston University Professor Nathan Phillips. Phillipsand his colleagues identified 3,356 leaks with methaneconcentrations exceeding up to 15 times the globalbackground level.Image by Nathan Phillips.www.clf.org/naturalgas
development.8 Though each of these initiativesincludes fugitive emissions from distributionpipelines, the focus tends to lie upstream at theproduction and processing stages, in part, becauseexisting cost recovery mechanisms for distributioncompanies negate the profit incentives that exist foroperators at the production and processing level.In Massachusetts, however, there are no productionwells and very little processing occurs; in addition,transmission lines are primarily regulated andoverseen by the federal Pipeline and HazardousMaterials Safety Administration (“PHMSA”) and theFederal Energy Regulatory Commission (“FERC”).Therefore, Massachusetts’s primary jurisdiction overmethane leaks lies with the intrastate distributionpipelines that deliver natural gas from transmissionlines into homes, businesses and institutions withinthe Commonwealth. This paper focuses uponopportunities to reduce emissions from thesedistribution pipelines which are subject to oversightby the Massachusetts Department of PublicUtilities and the Massachusetts Department ofEnvironmental Protection.Massachusetts, and New England, sit in a uniqueposition in the nation. Already, the New Englandpower grid relies upon natural gas for a significantportion of its capacity, and the use of natural gas forelectricity is expected to rise by almost 20% betweennow and 2020 as older, inefficient coal and oil plantsretire.9As a result, industry and some major end-users(including states) are clamoring to expand naturalgas infrastructure.10 Building new transmission linesand new gas generation promises to be a costlyendeavor, and reducing leaks while increasing theefficiency of existing infrastructure, including storage,could provide a more cost-effective, environmentallybeneficial means of providing excess capacity.Massachusetts already has in place aggressiveenergy efficiency programs. For example, in 2010,Massachusetts natural gas efficiency programssaved 1,097 MMcf of natural gas. But in the sametime period, Massachusetts lost, at a minimum, 1,725MMcf through leaks on the system. We are losingmore on the distribution than we are saving, andcustomers are still paying for those losses.Before we invest in costly new transmission linesand other natural gas infrastructure, we must address these avoidable system losses, and we mustincrease the efficiency of the existing system. Otherwise, we will continue sending a valuable resourceinto thin air.Global Methane Initiative and the EPA’s Natural GasStar Program have been working cooperatively withthe U.S. oil and gas industry since as early as 1993to develop cost effective technologies for reducingmethane emissions.9
BACKGROUNDMaterial Miles ON DISTRIBUTION INFRASTRUCTURE IN MASSACHUSETTSThere are eight investor owned and four municipalCast Iron 3,990gas distribution,utilities also known as local distribution companies (“LDCs”), operating in Massachu11Steel 3,080setts.UnprotectedThese companiesown over 21,000 miles ofgas main and 1 million services.12 Almost one-third ofthe mainsare cast iron or unproTotal in Massachusetts7,070tected steel, materials that are often referred to as“leak-prone” pipe.13 These types of pipelines arereferred to as “leak-prone” because according to EPAdata and company-specific data, they tend to have ahigher leakage rate. For example, in its recent regulations requiring greenhouse gas emissions reportingfrom the oil and gas industry, known as Subpart W,the EPA set forth the following emissions factors fordistribution pipelines:MaterialEmissions Factor(scf/hour/mile)Cast Iron27.25Unprotected Steel12.58Plastic1.13Protected Steel0.35See 40 C.F.R. Part 98, Subpart W, Revision to Petroleum and Natural Gas Systems. According to thesefigures, cast iron and unprotected steel result infar greater emissions than either protected steel orplastic pipe. As a result, distribution systems withlarge amounts of such leak-prone pipe are likely toexperience equally large fugitive emissions. In Massa-www.clf.org/naturalgaschusetts, as of December 31, 2010, these leak-pronepipes accounted for almost 7,000 miles, over 30% ofthe entire distribution system:MaterialMilesCast Iron3,990Unprotected Steel3,080Total7,070The Massachusetts Department of Public Utilities developed regulations to ensure that no additional castiron is used in the system and these same regulations required LDCs to replace or retire cast iron pipeunder specified circumstances,14 but investor-ownedutilities face many competing demands for determining how to allocate capital expenditures, and theseregulations do not extend to wholesale replacementof the aging cast iron pipelines on the system. Undercurrent regulations, decisions about whether to repairor replace leaking pipelines are prioritized based onwhether the particular leak or segment of pipelineposes an immediate risk to public safety and neitherthe Department nor the utilities take into account impacts on greenhouse gas emissions or other environmental factors. Both the federal and state regulationsgoverning pipeline safety simply require that “hazardous” leaks be repaired “promptly.”15 As a result, leaksthat persist for years may be left unrepaired so longas they remain “non-hazardous.”
In addition, although it may be cost effective to repairor replace a pipeline, the rate of return may not becompetitive with other types of capital investmentsthe company could choose.16 Although utilities areallowed to recover the costs of replacing pipeline,under traditional rate regulation that recovery doesnot occur until the filing of a rate case. This produceswhat utilities refer to as “regulatory lag,” a period during which the company is responsible for carrying thecosts of the capital investment, including any interestpayments on loans. This can also create a disincentive for a utility to invest aggressively in replacementof pipes that may be leaking but are not necessarilyconsidered hazardous.In recognition of this disincentive, the Departmenthas recently approved new mechanisms to facilitatecapital spending on infrastructure replacement forthree of the LDCs.17 These mechanisms, known astargeted infrastructure replacement factors (“TIRFs”)or more generically as capital trackers, allow LDCsto recover their capital expenditures for the replacement of leak prone pipelines on an annual basisrather than carrying the costs over until their nextrate case.18 Initially, these mechanisms appear to behaving a positive impact on increasing the replacement of leak-prone pipeline; however, in their existingform, they do not require any consideration, measurement, or reporting of the estimated greenhousegas reductions or reductions in lost and unaccountedfor gas payments that can be attributed to replacement. Including this information is important not onlyto ensure that these co-benefits are maximized, butalso to ensure that these replacement programs areactually achieving these benefits. Measurement andreporting of the impacts of replacement programs onfugitive emissions will also allow the Department tobetter integrate these co-benefits in future analysesof the cost-effectiveness of the programs.Leaks that contributeto climate changemay remain on thesystem indefinitelyunless circumstanceschange such thatthe leak becomesconsidered hazardous.As alluded to above, under existing laws and regulations, utilities, including LDCs, in Massachusetts aresubject to “cost of service” rate regulation whichis based on the principle that a utility “is entitled tocharge rates which afford it the opportunity to meetits cost of service, including a fair and reasonablereturn on honestly and prudently invested capital.”19This includes the utility’s expenditures on capitalprojects such as replacing pipelines. LDCs may alsorecover the costs they expend on operations andmaintenance such as identifying, classifying, repairing and monitoring leaks; however, unlike an investment in new pipeline, the company recovers onlythe expense and a reasonable rate of return withoutthe added benefit of being able to add a capital addition into its rate base. This bias towards investingin capital expenditures rather than operating andmaintenance expenses is known as the AverchJohnson effect, and must be taken into account incrafting solutions.20 Recoverable costs also includethe cost of the commodity, in this case natural gas.The LDCs purchase natural gas for the system, andthe cost is “passed through” to ratepayers in the formof a “cost-of-gas adjustment clause.”21 Ratepayerspay the same cost to the LDC that the LDC paid to thegas supplier—there is no mark-up; however, LDCs are11
also allowed to pass through the costs of any gas thatis purchased but “lost” on the system between thetransmission hub and the meter. This state of affairsstands in sharp contrast to the situation facing gasproducers who are able to reap additional profits byselling any natural gas that they prevent from escaping from the well head or during processing, and itessentially removes any incentive to repair leaks unless the leak is considered hazardous.22 As a result,leaks that contribute to climate change may remainon the system indefinitely unless circumstanceschange such that the leak becomes consideredhazardous.LDCs are allowed topass on the costs offugitive emissions tocustomers, at a rate of 38.8 million annually.ASSESSING THE CLIMATE CHANGE IMPACTS FROM FUGITIVE EMISSIONSMethane is an extremely potent greenhouse gas witha much shorter atmospheric lifespan than carbondioxide. Assessing its impact on climate change andits relative importance depends upon establishing aproper global warming potential (“GWP”). The GWPvalue of 21 listed for methane is that published in the1995 IPCC assessment report under a 100-year timehorizon. Carbon dioxide has a lifetime of around 100years in the atmosphere while that of CH4 is onlyabout 12 years (IPCC 2007). The 100-year time horizon has become the standard for comparison acrossgreenhouse gases, despite the fact that a 20-yearhorizon is arguably more appropriate for evaluating short-lived gases such as methane. SubsequentIPCC reports have published larger GWP values formethane. The third IPCC assessment (2001) reports avalue of 23 over a 100-year time horizon (62 over 20years) and the most recent IPCC assessment (2007)reports a value of 25 over a 100-year time horizon(72 over 20 years). Further, recent work by Shindellet al. (2009) and Kurtén et al. (2011) suggest thatpreviously unaccounted for gas-aerosol interactionswww.clf.org/naturalgassignificantly increase the GWP of methane to 33 overa 100-year time horizon (79 to 105 over 20 years).While the GWP value of 21 for methane is used herebecause that is the GWP that has been adopted byMassachusetts and the EPA, it is important to notethat subsequent research has determined that thevalue is actually significantly higher. Therefore, theimpact of urban natural gas leaks on global warmingreported in this document likely underestimates themagnitude of the true impact. Although we’ve used21 as the GWP here, we recommend that the DEP,DPU, EPA and other agencies adopt the more recentIPCC figure of 25 or consider using the “technologywarming potential” approach set forth by Alvarez.Methane accounts for 10% of the total U.S. GHGinventory, and it has been rising steadily.23 Fugitive emissions from the Oil & Gas industry make up3.8% of the total methane emissions, and of that,almost 11%, or 72 billion cubic feet, come from thedistribution system.24 In Massachusetts, accordingto reports filed with the Department of Environmen-
tal Protection, fugitive emissions from distributionpipelines amounted to roughly 700,000 tons of CO2equivalent (CO2e) for 2010.GWPFactorCO2eMetric Colonial d/b/a 82116,564.3833,227.42521697,775.925CompanyBay State/ColumbiaBoston Gas d/b/a NGridBerkshireTOTALCH4Metric TonsHowever, this number is dwarfed if estimates arebased instead on the lost and unaccounted for gasreports filed by the LDCs to the DPU. The fugitiveemissions reported under that methodology amountto almost 3.6 million tons of CO2e—over five timesthe emissions, and 4.2% of the Massachusetts totalgreenhouse gas inventory. 25CompanyBay State/ColumbiaLost Gas in MMcf(2010 SQCO2 Equivalent(metric 32Colonial Gas d/b/a NGrid1,268.9620506,640.3034Boston Gas d/b/a NGrid6,006.68902,398,204.7830Essex Gas d/b/a NGrid(37.5160)(14,978.4776)Fitchburg kshire Gas Co.New England Gas Co.TOTALEmissions inventory ranging from a low of 0.8% to ahigh of 4.2%. It is also important to consider thesefigures in the context of the mandate to reduce GHGemissions 25% below 1990 levels by 2020.26 Lookedat from that perspective, eliminating these fugitiveemissions could help Massachusetts to achievebetween 2.5% to 15% of the total reductions requiredby 2020. From a pure cost analysis, using an averageof 4.30/Mcf, these losses cost ratepayers 38.8million annually. Of course, it would be too simplisticto say that all lost and unaccounted for gas can beattributed to leaks, therefore the 3.6 million figureis not definitive.27 Requiring companies to betteraccount for the sources of the lost and unaccountedfor gas would provide valuable data to guide policymakers.More work must be done to increase the accuracy ofthe accounting for fugitive emissions from distribution pipelines. The discrepancies between the datacollected by the Massachusetts Department of Environmental Protection and the data from the Department of Public Utilities illustrate the lack of transparency and accuracy surrounding methane leaks fromdistribution pipelines. This problem is not uniqueto Massachusetts, but actually emanates from theflawed analysis developed jointly by EPA and the GasResources Institute in 1992. The emissions factorsestablished by this study, known as the EPA/GRIstudy, have recently been called into question by theEPA itself.28 According to a 2009 study, the leak ratesestablished for cast iron pipelines may have been underestimated by no less than half. The original studyrelied upon a sample size of only 21 while a morerecent study conducted in Brazil evaluated over 900.The results are represented below:3,607,383.51Under either scenario, this is a significant contributor to the total Massachusetts Greenhouse GasStudyLocationYearSampleSizeLeak RateEPA/GRINorth America199221428,123ComgasBrazil2005 — present912803,548(scf/mile-year)13
Nonetheless, in the EPA’s recent rulemaking requiring greenhouse gas reporting from oil and gascompanies, known as Subpart W, the EPA continuesto rely on this outdated, discredited methodologyto calculate the fugitive emissions from pipelines.29Notably, the EPA did change the estimates for threeexisting sources including gas well liquids unloading,condensate storage tanks and centrifugal compressors and added two new sources that were not accounted for by the initial EPA/GRI study, but the EPAdid not provide updates for distribution systems.30Natural gas companies understand the deficienciesof this methodology and seem willing to work withregulators to develop a more accurate tool. The Massachusetts Department of Environmental Protectionshould work with EPA and the local LDCs to useexisting leak surveys from the companies to establisha better, Massachusetts-specific, leak rate to be usedfor determining more accurate estimates of emissions. Establishing credible, replicable methods forcalculating emissions from natural gas infrastructureis critical. Without better data, it is difficult to assessthe true impact of increased natural gas use, pinpointthe major sources of fugitive emissions, and evaluatewhether policies are achieving their intended results.Policy Options:Fortunately, there are a number of policy optionsthat could be pursued to reduce greenhouse gasemissions from natural gas distribution pipelines costeffectively and expeditiously. The five policy optionslaid out below either build on existing mechanismsor recommend changes to incentive structures. Theprime candidates include: (1) Establishing Leak Classification and Repair Timelines, (2) Limiting cost recovery for lost and unaccounted for gas, (3) ExpandingTargeted Infrastructure Replacement Programs, (4)Changing Service Quality Standards, and (5) Enhancing Monitoring and Reporting Requirements.Leak Repair Classification and Timeline RequirementsUnder the federal regulations governing pipelinesafety, there is no standardized set of leak classifications, and repair is only required for “hazardousleaks.”31 As a result, in states that have not adoptedtheir own set of leak classifications and repair timelines, utilities have great discretion in determiningwhen and whether to repair a particular leak. Mostutilities have adopted a standardized set of leakclassifications, developed by the industry, which divides leaks into three categories. The most d in highconsequence areas are generally considered Grade2; and leaks that are in low consequence areas andnot under pressure are classified as Grade 3. In virtually every state that has adopted leak classificationand repair timelines, Grade 1 leaks require immediate action or repair. However, timelines for repair ofGrade 2 and Grade 3 leaks vary widely, and regula-www.clf.org/naturalgasFortunately, thereare a number ofpolicy options thatcould be pursuedto cost-effectivelyand expeditiouslyreduce greenhouse gasemissionsfrom natural gasdistribution pipelines.
tions may require nothing more than re-evaluation ofthese leaks to ensure that they have not developedinto Grade 1 leaks. This is a missed opportunity forstates to exercise greater control over greenhousegas emissions from pipelines.Although legislation was proposed in the mostrecent Massachusetts legislative session that wouldhave established a leak grading system and timelinesfor certain leak repairs, legislation is not necessaryto advance this policy. The Department of PublicUtilities has the authority to establish leak gradingrequirements and timelines for leak repairs underMassachusetts and federal law.32 Massachusettslaw provides the Department with the authority to“establish . . . such reasonable rules and regulations consistent with this chapter as may be necessary to carry out the administration thereof.”33Massachusetts law also provides that natural gaspipelines “shall be subject to such reasonable rulesand regulations as the department may prescribe oradopt pertaining to the construction and operationof such pipe lines for the purpose of insuring the safeoperation thereof.”34 The federal safety regulationsallow states to impose “additional or more stringentrequirements” on owners and operators of intrastatepipelines, so long as they are compatible with theminimum federal standards.35 As noted above, theDepartment has, in the past, established regulationsthat are more stringent than the federal standards toensure pipeline safety. For example, the Departmentpromulgated regulations governing the operation,maintenance, replacement and abandonment ofcast iron pipelines.36 Thus, it is clear that the Department could develop regulations intended to increasesafety and reduce greenhouse gas emissions byestablishing a uniform system of leak grading for theLDCs and a specified timeline for leak repair. Indeed,over thirteen states have developed regulationsalong these lines.37Three northeastern states, Maine, New York38 andNew Hampshire39, have already established leakclassification and repair regulations that Massachusetts could look to for guidance. The regulationsdeveloped by Maine are the most likely to addressthe issue of expediting the repair of leaks that maynot be considered hazardous, but are, nonetheless,contributing to greenhouse gas emissions becauseMaine requires repair of all grades of leaks. Maine’sregulations define three separate grades of leaks:40Grade 1 is defined as a leak that representsan existing or probable hazard to persons orproperty and requires prompt action, immediate repair, or continuous action until theconditions are no longer hazardous.Grade 2 means a leak that is recognized asbeing non-hazardous at the time of detection, but justifies scheduled repair or removalwithin six months or less of detection due tothe probability of its future hazard.Grade 3 means a leak that is non-hazardousat the time of detection and can be reasonably expected to remain non-hazardous.The Maine regulations require immediate action torepair a Grade 1 leak, and continuous monitoringuntil the repair is completed. Id. at § 6D.2.a. Grade 2leaks must be repaired within 30 days of detectionif they are classified as a “Priority 1” leak which isdefined in the regulations. Id. at § 6D.3.c. If the leakis not a Priority 1 leak, it must be re-evaluated every30 days until it is repaired. Id. at § 6D.3.d. Grade 3leaks must be repaired within 24 months of detectionunless they are scheduled for replacement underan existing replacement program; however, theymust be re-evaluated every 180 days until the leak iscleared. Id. at § 6D4.b-c. It appears that this type of15
regulation may be having a positive impact in Maine.According to the Energy Information Administration, Maine has one of the lowest rates of lost andunaccounted for gas in the country with a rate of0.4% for 2010.41 There are two important featuresof the Maine regulations that stand out. First, it allows a company not to repair a grade 3 leak if it ispart of a segment that is scheduled for replacementunder an existing program. That means that neitherthe company nor ratepayers are saddled with thecosts of repairing a leak that would already be dealtwith through replacement of the existing pipeline.Second, the Maine regulations do not allow a utilityto “downgrade” a leak. Id. at § 6D.8. This prevents autility from remedying a Grade 1 or Grade 2 leak byventing the leaking gas into the atmosphere, whichis a practice that reduces the possibility of explosionby relieving the pressure, but as a result producesgreater greenhouse gas emissions. Further analysis would need to be done of each state that hasleak classification and repair timelines to determinewhether there is a consistent correlation betweenthe requirements and lower levels of greenhousegas emissions and unaccounted for gas, but it seemslogical that a leak repair timeline coupled with replacement of leak-prone pipes on the system shouldgreatly reduce fugitive emissions. Information abouteach state with an existing leak classification andrepair timeline program is included in Appendix A.Limiting Cost Recovery for Lost and Unaccounted for GasLost and unaccounted for gas (“LAUF”) has beenan accepted cost of service since the early days ofrate regulation in the United States.42 The UnitedStates Supreme Court recognized, as early as 1934,that “There is no dispute that a certain loss
into thin air. Global Methane Initiative and the EPA's Natural Gas Star Program have been working cooperatively with the U.S. oil and gas industry since as early as 1993 to develop cost effective technologies for reducing methane emissions.