Transcription
ORIGINAL ARTICLEPerceived Discrimination and Longitudinal Changein Kidney Function Among Urban AdultsMay A. Beydoun, PhD, MPH, Angedith Poggi-Burke, MPH, Alan B. Zonderman, PhD,Ola S. Rostant, PhD, Michele K. Evans, MD, and Deidra C. Crews, MD, ScMABSTRACTObjective: Perceived discrimination has been associated with psychosocial distress and adverse health outcomes. We examined associations of perceived discrimination measures with changes in kidney function in a prospective cohort study, the Healthy Aging in Neighborhoods of Diversity across the Life Span.Methods: Our study included 1620 participants with preserved baseline kidney function (estimated glomerular filtration rate [eGFR] 60 mL/min/1.73 m2) (662 whites and 958 African Americans, aged 30–64 years). Self-reported perceived racial discrimination and perceived gender discrimination (PGD) and a general measure of experience of discrimination (EOD) (“medium versus low,” “high versuslow”) were examined in relation to baseline, follow-up, and annual rate of change in eGFR using multiple mixed-effects regression (γbase,γrate) and ordinary least square models (γfollow).Results: Perceived gender discrimination “high versus low PGD” was associated with a lower baseline eGFR in all models (γbase 3.51(1.34), p .009 for total sample). Among white women, high EOD was associated with lower baseline eGFR, an effect that was strengthened in the full model (γbase 5.86 [2.52], p .020). Overall, “high versus low” PGD was associated with lower follow-up eGFR(γfollow 3.03 [1.45], p .036). Among African American women, both perceived racial discrimination and PGD were linked to lowerfollow-up kidney function, an effect that was attenuated with covariate adjustment, indicating mediation through health-related, psychosocial, and lifestyle factors. In contrast, EOD was not linked to follow-up eGFR in any of the sex by race groups.Conclusions: Perceived racial and gender discrimination are associated with lower kidney function assessed by glomerular filtration rateand the strength of associations differ by sex and race groups. Perceived discrimination deserves further investigation as a psychosocial riskfactors for kidney disease.Key words: gender, kidney function, perceived discrimination, race, urban adults.INTRODUCTIONThese links suggest that adverse health outcomes are influenced by PRD (5,11–28) and in other instances by PGD(12,14,15,19–22,29). Nevertheless, in one earlier study, reportingno or low discrimination had an unexpected positive relationshipwith worse health outcomes, such as hypertension, specificallyamong AA women (12). Thus, the direction of the associationbetween perceived discrimination is still debated, particularlywithin different sociodemographic strata, such as sex and race.To our knowledge, there have been no empirical studies of therelation of perceived discrimination and kidney function. Therefore, we examined the associations of PRD, PGD, and EOD withChronic kidney disease (CKD) is a public health problem affecting 13% of US adults (1). Clinical factors, such as hypertension and diabetes, and genetic factors (2) do not fully explainCKD burden. Therefore, attention has been recently paid to othersocial, economic, and psychosocial factors, which may underliekidney function decline (3,4). Among psychosocial factors, perceived discrimination (general experience of discrimination [EOD],race/ethnicity-related (perceived racial discrimination [PRD]), orperceived gender discrimination [PGD]) has been linked to adverse health outcomes, possibly through stress-related pathways, including hypertension, cardiovascular disease, poor generalhealth status, and mental illness (5). Stress is a condition wherebyenvironmental factors tax or exceed the adaptive capacity ofindividuals to a point where psychological and physiological responses may place them at risk for disease (6). Studies of stressorsand their relation to pathophysiology have revealed alterations inblood pressure, heart rate, and vascular reactivity in response toacute stress (7–10).AA African American, ACR albumin:creatinine ratio,BMI body mass index, CES-D Center for EpidemiologicStudies-Depression, CKD chronic kidney disease, EDS elevateddepressive symptoms, eGFR estimated glomerular filtration rate,EOD experience of discrimination, HANDLS Health Aging inNeighborhoods of Diversity across the Life Span, OLS ordinaryleast square, PGD perceived gender discrimination, PRD perceived racial discriminationSupplemental ContentFrom the Laboratory of Epidemiology and Population Sciences (Beydoun, Poggi-Burke, Zonderman, Rostant, Evans), National Institute on Aging,National Institutes of Health; Division of Nephrology (Crews), Department of Medicine, Johns Hopkins University School of Medicine; and Welch Centerfor Prevention (Crews), Epidemiology and Clinical Research, Johns Hopkins Medical Institutions, Baltimore, Maryland.Address correspondence and reprint requests to Deidra C. Crews, MD, ScM, Johns Hopkins University School of Medicine, 301 Mason F Lord Drive,Suite 2500, Baltimore, MD 21224. E-mail: dcrews1@jhmi.eduReceived for publication August 8, 2016; revision received March 6, 2017.DOI: 10.1097/PSY.0000000000000478Copyright 2017 by the American Psychosomatic SocietyPsychosomatic Medicine, V 79 824-834824September 2017Copyright 2017 by the American Psychosomatic Society. Unauthorized reproduction of this article is prohibited.
Discrimination and Kidney Function DeclinePRD” (factor score 0), “medium PRD” (factor score 0–1), and “highPRD” (factor score 1).longitudinal kidney function change in a biracial socioeconomically diverse sample from Baltimore City, Maryland, and testeddifferential associations by sex and race.Perceived Gender DiscriminationSimilarly, PGD included one global item measured on a four-point Likertscale (“not at all” to “a lot”) and five binary “yes/no” items, namely, “Haveyou ever experienced discrimination, or has anyone stopped you fromdoing something, hassled you, or made you feel inferior because of yourgender?” in the following five distinctive situations: at school, getting ajob, at work, at home, or when getting medical care?, with a total scorerange of 5 to 10 (12,32). Using a similar approach, a factor analysis wasconducted to combine the global measure with the situational measures thatwere also summed. The common factor was predicted and categorized asthe following: “low PGD” ( 0), “medium PGD” (0–1), and “high PGD”( 1). The correlation between the sum of global PGD items and the sumof situational PGD items was .49, whereas that of global versus situationalPRD items was .54. The factor score for PGD was highly correlated witheach sum of items (r .87 [factor score versus global], r .86 [factor scoreversus situational]). Those correlations were both .88 for PRD. Cronbach αlevels, assuming we are summing up items for each scale, were .79 and .67,for PRD and PGD, respectively. In addition to using the final factor score inthe main analysis, summation of the items of PRD and PGD was also usedas a continuous outcome in a small portion of the analysis.METHODSStudy DesignInitiated in 2004, the Healthy Aging in Neighborhoods of Diversity acrossthe Life Span (HANDLS) study is an ongoing prospective cohort study focused on the cardiovascular and cognitive health of a socioeconomically diverse sample of AAs and whites (baseline age 30–64 years), residing inBaltimore, Maryland. Race was self-reported in answer to the question:please look at this card and tell me which category best describes you.Are you: 1. white; 2. black/AA; 3. American Indian or Alaska Native; 4.Asian; 5. Native Hawaiian or other Pacific Islander; and 6. Some otherrace? Only those with self-described race of white or AA were eligiblefor the HANDLS study. Briefly, thirteen neighborhoods were selectedusing an area probability sampling methodology as detailed elsewhere(30). Phase 1 consisted of screening, recruitment, and household interviews, whereas phase 2 collected more extensive data in a mobile medicalresearch vehicle. The present study uses baseline visit 1 (2004–2009) andthe first follow-up visit 2 (2009–2013), with mean follow-up time of approximately 5 years.All participants provided written informed consent, after accessing aprotocol booklet in layman's terms and a video detailing all proceduresand future recontacts. HANDLS study was ethically approved by theNational Institute on Environmental Health Sciences, National Institutesof Health, and its institutional review board.Experience of DiscriminationPerceived discrimination was also measured using the EOD (33,34). Thenine-item EOD measures the everyday experiences of unfair treatmentand is by far the most commonly used scale in previous studies. This measure asks respondents, “How often in your day-to-day life have the following things happened to you?” (e.g., “You are treated with less courtesy”;“You are treated with less respect”; “You get worse service at restaurantsand stores”; “People act as if you are not smart”; “People act as if they areafraid of you”; “People act as if they think you are dishonest”) on a Likert response scale (1 never, 2 less than once a year, 3 a few times a year, 4 afew times a month, 5 at least once a week, and 6 almost every day). Itemswere reverse coded, so higher scores reflect more everyday discrimination(Cronbach α .84 and item-total correlations ranging .54–.77).A similar factor analytic approach was carried out whereby each of thenine items was entered as measured variables and one factor was extracted.This common factor was then predicted and categorized in a similar fashionas for PRD and PGD (“low EOD” [factor score 0], “medium EOD” [factor score 0–1], and “high EOD” [factor score 1]). In addition to usingthe final factor score in the main analysis, summation of the items of EODwas also used as a continuous outcome in a small portion of the analysis.ParticipantsOf 3720 total baseline HANDLS participants initially selected with complete phase 1 of visit 1 data (i.e., home visit), 2743 had complete data onestimated glomerular filtration rate (eGFR) at either visit measured on themedical research vehicle (phase 2, visit 1), whereas 1993 had completeeGFR data at both baseline and follow-up (n 750 at baseline only). Wefurther excluded participants with missing data on PRD/PGD/EOD(n 63) or with baseline eGFR of less than 60 mL/min/1.73 m2 (n 84).Of the remaining participants (n 1846) with preserved kidney function,those with missing data on any of the covariates entered into the modelwere excluded (i.e., complete case analysis; n 68 missing on hypertensionor diabetes, an additional n 125 missing on smoking/drug use, an additional n 35 missing on elevated depressive symptoms (EDS) status atbaseline, and an additional n 2 missing on education) yielding a finalsample size of 1616. Compared with the HANDLS cohort that was not selected, our selected sample included a higher proportion who did not live inpoverty and more females (p .05), although no age or race differenceswere detected. This sample selectivity was accounted for in the analysisthrough a two-stage Heckman selection model as discussed in the statisticalanalysis section.Kidney FunctionOur primary outcomes were baseline, annual rate of change, and follow-upeGFR. Using participant fasting venous blood specimens, baseline serumcreatinine was measured at the National Institute on Aging, Clinical Research Branch Core Laboratory, using a modified kinetic Jaffe method(CREA method, Dade Dimension X-Pand Clinical Chemistry System,Siemens Healthcare Diagnostics Inc, Newark, Del) for a small group of participants (n 88), whereas most participants (n 1528) had baseline serumcreatinine analyzed at Quest Diagnostics, Inc, by isotope dilution massspectrometry (Olympus America Inc, Melville, NY) and standardized tothe reference laboratory, Cleveland Clinic. Although interassay coefficientsof variation for this sample could not be calculated because of the use ofonly one or the other measurement of creatinine at baseline, only intraassay coefficients of variation (mean/SD) could be estimated and thosewere .192 and .187 for the CREA and the isotope dilution mass spectrometry methods, respectively. All follow-up serum creatinine concentrationswere measured using IDMS at Quest Diagnostics, Inc.For participants having spot urine data, microalbumin concentrationwas measured at Quest Diagnostics, Inc, using an immunoturbimetric assayPerceived Racial DiscriminationBaseline PRD was measured using an adapted nine-item discriminationscale of the EOD questionnaire (12), and two global PRD items (31) (Supplemental Digital Content 1, http://links.lww.com/PSYMED/A393), elicitingperceived discrimination because of race, ethnicity, or culture on a fourpoint Likert scale (“not at all” to “a lot”). The five PRD binary (yes/no) situations from the EOD were racial discrimination at school, getting a job, atwork, getting housing, and getting medical care. The sum of the five situational items (range 5–10), and that of the two global items (range 2–8),were entered as two measured variables in a factor analysis with one commonfactor being extracted and predicted using the regression method. The predicted factor (z-score) was then grouped into the following categories: “lowPsychosomatic Medicine, V 79 824-834825September 2017Copyright 2017 by the American Psychosomatic Society. Unauthorized reproduction of this article is prohibited.
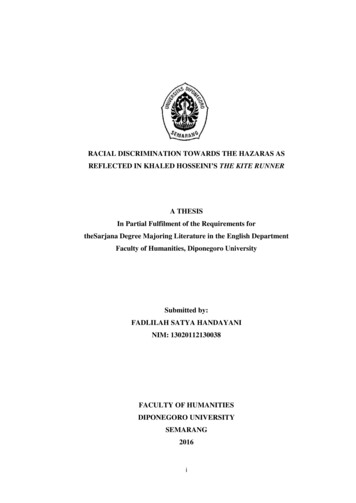
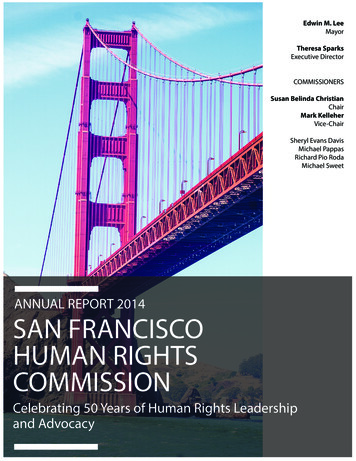
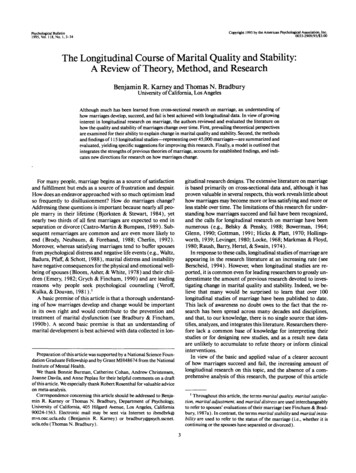
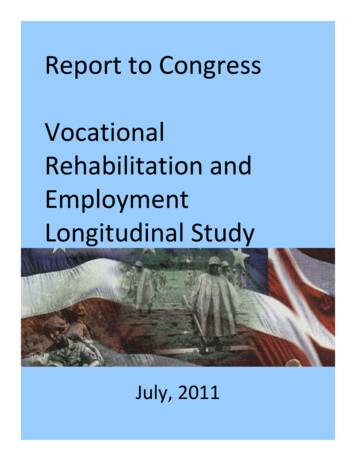
ORIGINAL ARTICLEACR. In a second sensitivity analysis (data not reported), the method/laboratory used for creatinine measurement was added as an additional covariate in all models and results of the full models were compared. In a thirdsensitivity analysis (data not reported), the 1846 individuals with completedata on eGFR at both visits were selected, by including a category formissing (e.g., missing “9”). Depressive symptoms were categorized as(0: 16, 1: 16, 9: missing).(Kamiya Biomedical Co, Seattle, Wash). Estimated GFR was calculatedusing the CKD Epidemiology Collaboration equation (35), truncating valuesat 150 mL/min/1.73 m2 (36). Urine albumin:creatinine ratio (ACR) was estimated and included in a sensitivity analysis, because of its appreciablemissingness from the selected sample ( 10%).CovariatesAge, sex, race (white or AA), completed years of education, poverty status(household income 125% of 2004 Department of Health and Human Services guideline) (30), marital status, current cigarette smoking, illicit druguse, and self-rated health were self-reported at baseline. Baseline diabetesmellitus status combined fasting serum glucose concentration of 126 mg/dLor greater, self-reported diabetes, and/or prescription diabetes medication.Using two sitting blood pressure measurements, with brachial artery auscultation and an inflatable cuff (37), hypertension was defined as the average of two systolic or diastolic blood pressures of 140 mm Hg or greateror 90 mm Hg or greater, respectively, or self-reported hypertension, or antihypertensive medication prescription. Body mass index (BMI) was calculated as weight over height squared (kilogram per square meter). EDS weredefined as 16 or higher score on the 20-item Center for EpidemiologicStudies-Depression scale (38,39).RESULTSBaseline Study Characteristics by EOD GroupsOverall, participants' mean age was 48 years; 59% were AA; 41%were male. High PRD was reported by 13.7%, high PGD by11.3%, and high EOD by 15.2%. Both PRD and PGD factorscores (see factor analysis in the methods section) had a positiveand linear association with EOD tertiles. A larger proportion ofAA men was found among participants with high EOD as opposedto low EOD (35.1% versus 21.6%). High EOD was also associatedwith a higher proportion below poverty, poor/fair self-rated health,current smoking, current illicit drug use, and EDS. Overall, therewas only a marginally significant higher mean baseline eGFR inthe “high EOD” as opposed to the “low EOD” group. No lineartrend was detected between EOD and the prevalence rates of hypertension and diabetes, the distribution in educational level andmarital status or in mean BMI (Table 1).Statistical AnalysisBivariate associations of PRD and PGD with each of the baseline covariates were tested using one-way analysis of variance from a bivariate ordinary least square (OLS) regression model for continuous variables and χ2tests of independence for categorical variables. Similarly, we comparedmeans of baseline, follow-up, and annual rates of change in eGFR acrossPRD and PGD, stratifying by sex by race.We used mixed-effects linear regression models to examine associations of baseline PRD and PGD (high versus low) with eGFR (baselineand annual rate of change), controlling for key confounders. To accountfor nonrandom participant selection by age, sex, race, and poverty status,in each mixed-effects regression model, we conducted a two-stage Heckman selection process, as described elsewhere (40,41). In the basic model,we estimated the alternative associations of PRD and PGD with baselineand annual rate of change in eGFR, adjusting slopes and intercepts forage, sex, and race (model 1). Moving forward, we adjusted for factors thatwere considered modifiable socioeconomic, life-style, and health-relatedfactors. Although some can be considered potential confounders, others such ashealth-related factors are often the result of life-style and socioeconomicfactors as well as psychosocial factors and thus may be mediating the effectof perceived discrimination on kidney function outcomes. Therefore, astepwise adjustment was used to examine the potential omnibus effect ofadding several groups of variables into the models in a cumulative manner.In model 2, we further adjusted model 1 for poverty status, education, andmarital status (i.e., in addition to age, sex, and race); in model 3, we adjusted model 2 for current smoking and illicit drug use, self-rated health,BMI, and EDS; in model 4, we controlled model 3 further for diabetesand hypertensive status. We added interaction terms and stratified by sexand race, because AAs report greater PRD (42) and reactions to psychological stressors differ by gender (43). Predictive margins of eGFR from stratified mixed-effects regression models were selectively plotted across timeto illustrate key findings. Finally, we conducted OLS regression models,evaluating PRD and PGD's independent associations with follow-upeGFR. Thus, two types of longitudinal analyses were conducted. Althoughthe first method investigates whether discrimination has a potential effecton the rate of change in kidney function, the second method investigatesthe effect of baseline discrimination on the level of kidney function 5 yearslater. A type 1 error of .05 was considered in all analyses, which were conducted using Stata Version 13 (StataCorp, College Station, Tex). A sensitivity analysis is presented and discussed in Supplemental DigitalContent 2 (http://links.lww.com/PSYMED/A394) whereby ACR was included in model 5, after excluding all participants with missing data onPsychosomatic Medicine, V 79 824-834Baseline, Follow-Up, and Annual Rate of Change ineGFR by PRD, PGD, and EOD GroupsOverall, the mean annual rate of change in eGFR was estimated at .10 U/year, with an SD of 3.35 (range 18.7 to 17.1). “HighPRD” was associated with a faster rate of decline in eGFR amongAA women as compared with “low PRD” (Fig. 1A). In contrast,PGD and EOD were not associated with the rate of change ineGFR in any of the sex by race groups (Figs. 1C, D).When examining baseline and follow-up eGFR (overall M [SD] 101.64[19.11] and 101.32[20.16], respectively), among AA women,high PRD (versus low PRD) and high PGD (versus low PGD) wereboth associated with lower follow-up eGFR (Figs. 2A, B). In contrast,“high EOD” was linked to higher eGFR among both AA women(baseline) and white men (baseline and follow-up), when comparedwith “low EOD” (Fig. 2C).Unadjusted Association Between PRD/PGD/EODSummation Scores and Key OutcomesTable S1 (Supplemental Digital Content 2, http://links.lww.com/PSYMED/A394) shows the unadjusted correlations between outcome measures and key exposures, overall and stratifying simultaneously by sex and race. Although most correlation coefficientswere weak ( .3), statistical significance was observed for AAwomen, whereby the PRD summation score was inversely related tobaseline, follow-up, and annual rate of change in eGFR. PGDamong AA women was also inversely related to two of three outcomes, namely, baseline and follow-up eGFR. This is in stark contrast with the EOD summation score, which showed a positiveassociation with baseline and follow-up eGFR, overall and amongwhite men. Finally, the EOD summation score was also positivelyassociated with baseline eGFR among AA women.826September 2017Copyright 2017 by the American Psychosomatic Society. Unauthorized reproduction of this article is prohibited.
Discrimination and Kidney Function DeclineTABLE 1. Study Participant Baseline Characteristics, Overall and by EOD group, HANDLS StudyOverall (n 1616)%100Low EOD (n 934)Medium EOD (n 437)High EOD (n 245)57.827.015.2p TrendSex by raceWhite women23.624.623.819.2AA women35.036.534.330.0White men17.217.218.115.5AA men24.121.623.835.149.3 (0.3)33.747.1 (0.4)32.746.5 (0.5)33.4Baseline age, M (SE)Married, %48.3 (0.2)33.4 .001.001.94Educational level, % HS6.56.46.46.9HS58.057.860.060.8.84 Poor/fair24.021.724.531.8Good40.740.045.135.5Very good/excellent35.438.430.432.7Current smoking status, %45.242.744.256.3.001Current illicit drug use, %17.314.318.825.7 .00129.9 (0.2)30.7 (0.4)29.6 (0.5).8832.245.649.044.254.342.4 .001.658.2.54Poverty status, % 125% PIR 125% PIRSelf-rated health, %BMI, M (SE)EDS, CES-D total score 16, %Hypertension, % yesDiabetes, % yesBaseline eGFR, M (SE)PRD factor score, M (SE).035.00130.1 (0.2)40.144.79.79.610.8101.6 (0.5)101.0 (0.6)102.0 (0.9)103.3 (1.3).09 0.003 (0.018) 0.21 (0.02) 0.18 (0.04) 0.47 (0.06) .001 3.7PGD factor score, M (SE)Low 0.004 (0.017)58.818.834.7 0.22 (0.02)80.76.0 0.21 (0.04)35.1 0.46 EOD factor score, M (SE) 0.007 (0.023) 0.62 (0.013) 0.42 (0.01) 1.68 (0.03) .001 .001 .001EOD nine-item everyday of discrimination scale; M (SE) mean (standard error); HS high school; PIR poverty income ratio; BMI body mass index; CES-D Center forEpidemiologic Studies-Depression; eGFR estimated glomerular filtration rate; PGD perceived gender discrimination.Selected study participants had preserved kidney function. Values are percent or M (SE). p value for trend was based on a one-way analysis of variance when row variable iscontinuous and χ2 when row variable is categorical.model: EOD effect 5.86 [2.52], p .020). Among whitemen, high EOD was linked to a marginally significant faster decline in eGFR in model 1, which was fully attenuated by socioeconomic factors in model 2.Net Associations Between PRD/PGD and EOD WithBaseline and Annual Rate of Change in eGFRIn mixed-effects regression models examining the net effect ofPRD and PGD on eGFR (baseline and annual rate of change), inthe total sample, “high versus low PGD” was associated with alower baseline eGFR in all models (full model: PGD effect 3.51 [1.34], p .009), an effect restricted to whites (Table 2).Other key findings emerged in the sex- and race-stratifiedmixed-effects regression models with EOD (Table 3). Specifically,among white women, high EOD was associated with lower baseline eGFR, an effect that was strengthened in the full model (fullPsychosomatic Medicine, V 79 824-834PRD/PGD and EOD and Their Adjusted AssociationsWith Follow-Up eGFROur sequential OLS models with alternative predictors PRD andPGD (Supplemental Digital Content 2, Table S2, http://links.lww.com/PSYMED/A394) indicated that overall, “high versuslow” PGD was associated with lower follow-up eGFR (full model:827September 2017Copyright 2017 by the American Psychosomatic Society. Unauthorized reproduction of this article is prohibited.
ORIGINAL ARTICLEFIGURE 1. A, Annual rate of change in eGFR by PRD category. B, Annual rate of change in eGFR by PGD category. C, Annual rate ofchange in eGFR by EOD category.PGD effect 3.03 [1.45], p .036). “Medium versus low PRD”was specifically positively associated with eGFR, indicating betterkidney function, among white men in model 3 (PRD effect 4.33 [2.07], p .037), an effect attenuated with adjustment forhypertension and diabetes status (PRD effect 4.09 [2.08],p .050). Among AA women, both PRD and PGD were linkedto lower kidney function at follow-up, an effect that was attenuatedsystematically between models 2 and 4, indicating an effect ofhealth-related (e.g., self-rated health, BMI, hypertension, and diabetes), psychosocial (depressive symptoms), and life-style factors(smoking and drug use). In contrast, EOD was not linked to followup eGFR in any of the sex by race groups (Supplemental DigitalContent 2, Tables S3, http://links.lww.com/PSYMED/A394). Afew marked changes were observed in the sensitivity analysis inthe sample with complete ACR, mostly due to a reduced overall sample size (n 1158) (Supplemental Digital Content 2, Tables S4–S7,http://links.lww.com/PSYMED/A394). In a second sensitivityanalysis (data not reported), the method/laboratory used for creatinine measurement was restricted to Quest Diagnostics, thePsychosomatic Medicine, V 79 824-834most commonly used laboratory at both waves, and the onlyone used in the follow-up wave (n 1528 of 1616). The resultswere not altered, as was the case for a third sensitivity analysisof 1846 individuals with complete baseline and follow-up visiteGFR (data not reported).DISCUSSIONWithin a biracial urban sample of adults in Baltimore City, Maryland,high PRD was reported by 13.7%, high PGD by 11.3%, and highEOD by 15.2%. Associations between perceived discriminationand kidney function varied by race and sex groups. Among whites,high PGD was associated with a lower baseline eGFR. Amongwhite women, high EOD was associated with lower baselineeGFR. Overall, high PGD was associated with lower follow-upeGFR. Notably, among AA women, both PRD and PGD werelinked to lower kidney function at follow-up, an effect that appeared mediated by health-related, psychosocial, and life-stylefactors. In contrast, EOD was not linked to follow-up eGFR inany of the sex by race groups.828September 2017Copyright 2017 by the American Psychosomatic Society. Unauthorized reproduction of this article is prohibited.
Discrimination and Kidney Function DeclineFIGURE 2. A, Baseline and follow-up mean eGFR by PRD category. B, Baseline and follow-up mean eGFR by PGD category. C,Baseline and follow-up mean eGFR by EOD category.race and sex in kidney disease, white women have been documented to have greater overall prevalence of reduced kidney function (47), as compared with women of other race/ethnic groups;however, AA men (48) have the highest incident rate for endstage renal disease. Our study argues for closer examination ofpsychosocial stressors for their impact on these differences.Biologically speaking, chronic psychosocial stress may inducechanges in neuroendocrine, autonomic, and immune systems (49),and perceived discrimination has been linked with increasedlevels of oxidative stress (50), a pathway through which allostaticload (51) may be transduced into chronic diseases (52). Stressinduced allostatic load was hypothesized to cause an epigenetically induced proinflammatory state, leading to an increased riskfor cardiovascular disease (53). Moreover, both racial and sexdifferences in coping with psychosocial stress, including discrimination, are important to consider, because they were detected in various non-CKD samples, and coping strategies havebeen noted to vary among men and women with CKD, withwomen showing a broader range of strategies that can buffer theeffects of stress (54).Perceived discrimination can lead to hopelessness and low selfefficacy (55), affecting the ability to self-manage one's health, perhaps differentially by sex and race (56). For instance, amongOur findings of variation of associations between perceiveddiscrimination and kidney function change across sex and racegroups are consistent with nuanced findings of several other studies, underscoring the complex effects of discrimination on healthoutcomes (17,20,22–24). For example, in a large sample of AsianAmerican adults, perceived discrimination was associated withadverse health outcomes among both men and women, withthe strongest association being with women's mental health.The threshold for an association of discrimination with adversehealth outcomes was also lower among women as comparedwith men (16). Based on the Coronary Artery Risk Developmentin Young Adults study, the experience of one or two episodes ofdiscrimination were only associated with higher levels ofinflammation (as measured by C-reactive protein) among AAwomen. There were no such associations observed among menor white women (18).The findings of our study could have implications for thewell-established race and sex differences in kidney disease outcomes. For example, whites have equal or greater overall prevalence of reduced kidney function when compared with AAs (44);however, AAs experience faster declines in kidney function (45)and bear a greater burden of advanced and end-stage renal disease(46). Although few studies have examined the intersectionality ofPsychosomatic Medicine, V 79 824-834829September 2017Copyright 2017 by the American Psychosomatic Society. Unauthorized reproduction of this article is prohibited.
ORIGINAL ARTICLETABLE 2. Baseline and Ann
of Health, and its institutional review board. Participants Of 3720 total baseline HANDLS participants initially selected with com-plete phase 1 of visit 1 data (i.e., home visit), 2743 had complete data on estimated glomerular filtration rate (eGFR) at either visit measured on the medical research vehicle (phase 2, visit 1), whereas 1993 had .


![Change Management Process For [Project Name] - West Virginia](/img/32/change-20management-20process-2003-2022-202012.jpg)