Transcription
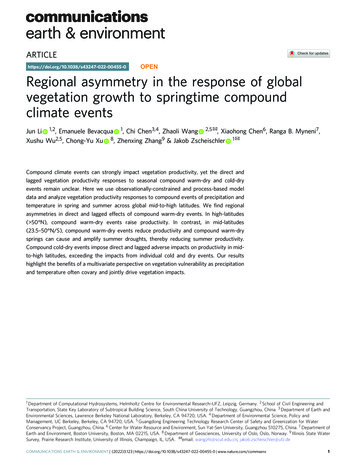
PENRegional asymmetry in the response of globalvegetation growth to springtime compoundclimate events1234567890():,;Jun Li 1,2, Emanuele Bevacqua 1, Chi Chen3,4, Zhaoli Wang 2,5 , Xiaohong Chen6, Ranga B. Myneni7,Xushu Wu2,5, Chong-Yu Xu 8, Zhenxing Zhang9 & Jakob Zscheischler 1 Compound climate events can strongly impact vegetation productivity, yet the direct andlagged vegetation productivity responses to seasonal compound warm-dry and cold-dryevents remain unclear. Here we use observationally-constrained and process-based modeldata and analyze vegetation productivity responses to compound events of precipitation andtemperature in spring and summer across global mid-to-high latitudes. We find regionalasymmetries in direct and lagged effects of compound warm-dry events. In high-latitudes( 50 N), compound warm-dry events raise productivity. In contrast, in mid-latitudes(23.5–50 N/S), compound warm-dry events reduce productivity and compound warm-drysprings can cause and amplify summer droughts, thereby reducing summer productivity.Compound cold-dry events impose direct and lagged adverse impacts on productivity in midto-high latitudes, exceeding the impacts from individual cold and dry events. Our resultshighlight the benefits of a multivariate perspective on vegetation vulnerability as precipitationand temperature often covary and jointly drive vegetation impacts.1 Department of Computational Hydrosystems, Helmholtz Centre for Environmental Research–UFZ, Leipzig, Germany. 2 School of Civil Engineering andTransportation, State Key Laboratory of Subtropical Building Science, South China University of Technology, Guangzhou, China. 3 Department of Earth andEnvironmental Sciences, Lawrence Berkeley National Laboratory, Berkeley, CA 94720, USA. 4 Department of Environmental Science, Policy andManagement, UC Berkeley, Berkeley, CA 94720, USA. 5 Guangdong Engineering Technology Research Center of Safety and Greenization for WaterConservancy Project, Guangzhou, China. 6 Center for Water Resource and Environment, Sun Yat-Sen University, Guangzhou 510275, China. 7 Department ofEarth and Environment, Boston University, Boston, MA 02215, USA. 8 Department of Geosciences, University of Oslo, Oslo, Norway. 9 Illinois State WaterSurvey, Prairie Research Institute, University of Illinois, Champaign, IL, USA. email: wangzhl@scut.edu.cn; jakob.zscheischler@ufz.deCOMMUNICATIONS EARTH & ENVIRONMENT (2022)3:123 https://doi.org/10.1038/s43247-022-00455-0 www.nature.com/commsenv1
ARTICLECOMMUNICATIONS EARTH & ENVIRONMENT https://doi.org/10.1038/s43247-022-00455-0Climate extremes can strongly impact vegetationproductivity1. Vegetation impacts arising from individualclimate extremes such as droughts or heatwaves have beenwell documented1–5, including vegetation resistance and resilience to extreme drought6,7 and lagged summer plantproductivity responses to warm spring8. Given that vegetationis synergistically affected by variability of both temperature andprecipitation9, compound anomalies in temperature and precipitation, such as simultaneous dry and hot conditions, canstrongly impact vegetation productivity10,11. In fact, at theregional scale there is evidence for direct impacts on vegetationproductivity from co-occurring dry and hot extremes12–16. Awell-known example is the 2003 European dry and hot summerthat decreased vegetation productivity by 30%, thereby offsettingfour years of net uptake of atmospheric CO2 over this region15.Similarly, the 2010 European drought and heatwave causedrecord-breaking reductions in plant-productivity due to heavyprecipitation deficit and strong heat stress12,16. Notably, whileseveral studies analyzed and projected the impact of simultaneousdry and hot conditions on vegetation productivity3,17,18, littleattention has been devoted to investigating the lagged response ofvegetation productivity to compounding climate conditions suchas summertime vegetation productivity responses to springtimecompound events, and regional asymmetries of such responses.Cold spell is another form of extreme event that can causevegetation damage by leaf frostbite, shortening growing season,and reducing photosynthetic carbon uptake19,20. The vegetationproductivity responses to compound events that include coldextremes have received little attention so far. Despite ongoingglobal warming, understanding the impact of cold-relatedextreme events to vegetation productivity is important, especially because cold extremes still occur frequently21 and may evenincrease in frequency in the near future in mid-latitudes as aresponse to rapid arctic warming21–23.Here, we investigate the direct and lagged responses ofvegetation productivity to seasonal compound warm-dry(CWD) and cold-dry (CCD) events across global mid-to-highlatitudes over the last three decades. We used seasonal compound event indices to model concurrent climates in spring andsummer. To characterize vegetation growth and productivity,we employed satellite-derived normalized difference vegetationindex (NDVI) and leaf area index (LAI) in combination withobservationally-constrained and state-of-the-art model-basedgross primary productivity (GPP). Furthermore, highresolution observational and model-based soil moisture andrunoff were used to investigate key mechanisms associated withthe hydrological responses.ResultsIllustration of the compound event indices. Building on earlierstudies24,25, we develop two univariate indices to model concurrentclimate conditions, i.e., a CWD index that varies from compoundcold-wet conditions to CWD conditions, and a CCD index thatvaries from compound warm-wet conditions to CCD conditions(see “Methods”). The two indices incorporate the dependencebetween temperature and precipitation and are a measure of howwarm/cold and dry a point is relative to the distribution of climateconditions at a given location. We illustrate the two indices on twogrid points that have strong but opposite temperature-precipitationcorrelation. In the case where temperature and precipitation arestrongly negatively correlated, the CWD index is well aligned withthe primary axis of the bivariate distribution (Fig. 1a). In the casewhere temperature and precipitation are strongly positively correlated, the same holds for the CCD index (Fig. 1d). As illustratedfor several concurrent hot-dry and cold-dry events that occurred2around the globe, the two indices well capture these events (Supplementary Figs. 1 and 2).Notably, in the case where precipitation and temperature arestrongly positively correlated, the CWD index indicates therelative anomalies of bivariate joint distribution, and somecounterintuitive situations might occur relative to the univariatemarginals (Fig. 1b). For instance, points might be labeled asstrong CWD events (CWD index 1.5) even though temperatureis anomalously cold (temperature anomalies 0, red dots in lowerleft quadrant of Fig. 1b). The CCD index exhibits similar behavior(Fig. 1c). This indicates an interesting property of the compoundindices to identify strong compound conditions relative tobivariate distribution that are not necessarily extreme from aunivariate perspective3,24,26,27.Widespread direct and lagged impacts of springtime compound climate conditions. To evaluate the lagged summervegetation responses to spring compound climate conditions, wecompute partial correlation between CWD (CCD) spring andsubsequent summer vegetation variation by controlling for theinfluence of summer compound climate conditions on thesecorrelations (see “Methods”). Results show widespread negativeassociations between CWD spring and subsequent summervegetation in the mid-latitudes ( 50 N; 19% of the total studyarea, p 0.05), indicating that CWD spring inhibits summertimevegetation growth. In contrast, positive associations are found inthe high latitudes ( 50 N; 8%, Fig. 2a). When considering CCDevents, CCD spring primarily exhibits negative lagged effects(18%) whereas positive lagged effects are rare (1%, Fig. 2b).Notably, in line with the fact that vegetation is often impacted byboth temperature and precipitation28, our results indicate thatconsidering springtime temperature and precipitation concurrently can slightly better explain summertime vegetationvariability than considering temperature or precipitation in isolation. Specifically, CWD climate conditions in spring are significantly correlated (p 0.05) with summer vegetation growth in27% of the total study area compared to 15% for temperature onlyand 24% for precipitation only (Fig. 2a and SupplementaryFig. 3).To investigate the direct responses, we then calculate correlations between CWD (CCD) indices and vegetation growth inspring and summer separately (Supplementary Fig. 4). There arewidespread direct positive responses to CWD climate conditionsin spring (52% of the study area, p 0.05) and summer (30%) inthe Northern hemisphere, while negative responses for spring(10%) and summer (22%) are distributed in mid-latitudes(Supplementary Fig. 4a, c). CCD climate conditions predominantly show negative correlations in spring (25%) and summer(20%, Supplementary Fig. 4b, d). We further compare the directeffects of compound climate conditions with that of individualtemperature or precipitation and find that CWD climateconditions can well incorporate the direct effects of bothtemperature and precipitation (Supplementary Fig. 4a, c andFig. 5).Process-based dynamic global vegetation models are commonly used tools to simulate the responses of vegetation growthand ecosystem productivity to climate extremes8,29. We thusassess the ability of the current set of state-of-the-art vegetationmodels (TRENDYv6)30 to capture the lagged responses to springcompound climate conditions (Supplementary Fig. 6). Overall, wefind that the models tend to overestimate the areal extent withpositive lagged effects to CWD springs, and the areas withnegative lagged effects to CCD springs (Supplementary Fig. 6a, d).In contrast, the models and observation-based products generallyshow good agreement on the areal extent that experience negativeCOMMUNICATIONS EARTH & ENVIRONMENT (2022)3:123 https://doi.org/10.1038/s43247-022-00455-0 www.nature.com/commsenv
COMMUNICATIONS EARTH & ENVIRONMENT ig. 1 The relationship between precipitation and temperature and compound indices. a Scatter plot of summer precipitation and temperature anomalies(z-score) with corresponding CWD index in color (see “Methods”). The location is at 97.25 W and 33.75 N from 1901 to 2018. b The same as a but forspring at 84.75 E and 66.75 N. c Same distribution as in a but colored based on the CCD index. d Same distribution as in b but colored based on theCCD index.lagged effects to CWD springs (Supplementary Fig. 6b, c). Whenconsidering LAI, the results are similar (SupplementaryFig. 6e–h).We finally assess the ability of TRENDYv6 models to replicatedirect response to compound climate conditions. Overall, themodels overestimate the coverage that is significantly negativelycorrelated to CCD climate conditions (Supplementary Fig. 7a–d).In contrast, the areal extents with significant correlations to CWDclimate conditions are generally well captured by vegetationmodels (Supplementary Fig. 7e–h). The results are similar whenemploying LAI (Supplementary Fig. 7i–p).Regional asymmetries in direct and legacy effects of CWDevent. Our results above indicate widespread positive vegetationresponses to CWD climate conditions in high latitudes ( 50 N),and a negative response in mid-latitudes (23.5–50 N/S). CCDclimate conditions mostly exhibit negative effects in mid-to-highlatitudes. To understand the effects of CWD and CCD events inmore detail and the corresponding physical mechanisms, weperform a regional analysis, focusing on the areas in Fig. 2a wheresummer vegetation responds positively (r 0.22) and negatively(r 0.22) to spring CWD climate conditions, and the areas inFig. 2b where summer vegetation responds negatively (r 0.22)to spring CCD climate conditions. Across the focus areas, weinvestigate the composites of average anomalies in GPP, LAI, soilmoisture, runoff, and terrestrial water storage (TWS) (see“Methods”). Notably, over these areas, we find that the directionof direct and lagged productivity responses between the modelsand observation-based products overall shows good agreement,despite the difference in response magnitude (Figs. 3–5).CWD events increase vegetation productivity in high latitudes.We first analyze the direct responses of productivity to springtimeand summertime CWD events across high latitudes ( 50 N,Fig. 3). Productivity increases during CWD spring and summer(Fig. 3a–c), which is consistent with vegetation responses (Supplementary Fig. 8a–c). Despite elevated spring greenness, springwater overall shows positive anomalies during CWD spring(Fig. 3d, f, g, i). This result indicates that spring greenness duringCWD conditions is not associated with dry spring across highlatitudes, which is further confirmed by similar anomalies inspringtime TWS (Supplementary Fig. 8d, f). In contrast, severewater reduction is found in CWD summer (Fig. 3e, f, h, i). Thissuggests that despite the beneficial effects of CWD events onproductivity in summer, they are associated with summer waterdeficit.Next, to analyze the lagged effects of springtime CWD events,we investigate the productivity anomalies in summer under threecases, namely CWD spring but non-CWD summer, non-CWDspring but CWD summer, and consecutive CWD spring andsummer. Our results indicate that springtime CWD events havepositive lagged effects on summer productivity across highlatitudes (Fig. 3). Specifically, we find that during non-CWDsummer (that is not favorable for summer vegetation growth)preceded by CWD spring, positive anomalies are still found insummer productivity (Fig. 3a). In contrast, during CWD summer(preceded by non-CWD spring), some models and observationbased products exhibit a reduction in summer productivity(Fig. 3b). We further find that summer productivity highlyincreases during consecutive events (Fig. 3c). Vegetationanomalies show similar behaviors (Supplementary Fig. 8a–c).Regarding the lagged responses of hydrological variables, CWDCOMMUNICATIONS EARTH & ENVIRONMENT (2022)3:123 https://doi.org/10.1038/s43247-022-00455-0 www.nature.com/commsenv3
ARTICLECOMMUNICATIONS EARTH & ENVIRONMENT https://doi.org/10.1038/s43247-022-00455-0Fig. 2 Summer vegetation lagged responses to spring compound climateconditions. a Grid-based partial correlations between yearly spring CWDclimate conditions and summer NDVI (a proxy for vegetation growth)during the period 1981–2015, computed based on partial correlationanalysis (see “Methods”). b The same as a, but for spring CCD climateconditions. Absolute values of the partial correlation coefficients (r)correspond to significance levels of p 0.2 (r 0.22), p 0.1 (r 0.28), orp 0.05 (r 0.33). For each map, frequency histograms show the arealcoverage corresponding to positive and negative correlations. Light grayareas, i.e. cropland, urban, barren, and permanent snow, and ice, are notincluded in the analysis.springs followed by non-CWD summers do not lead to waterdryness, despite increased vegetation greenness (Fig. 3d, g). Themagnitude of summer water deficit is similar for both cases thatinclude CWD summer (Fig. 3e, f, h, i) and is consistent withsummer TWS anomalies (Supplementary Fig. 8e, f). These resultsimply that in high latitudes, summer water reductions characterized by TWS, soil moisture, and runoff are not associated withincreased spring greenness but are primarily caused by summerprecipitation deficit.The productivity responses to compound climate conditionsmay be stronger than that to individual events through thesynergistic effects of temperature and precipitation28. Toinvestigate this, we compute the average anomalies in GPP andsoil moisture associated with univariate events across the focusareas, which are then compared with the effects of CWD andCCD events in high latitudes (see “Methods”). Warm events cannot only directly increase productivity but also show positivelagged effects (Supplementary Fig. 9a, b). In contrast, dry eventsreduce productivity (Supplementary Fig. 9e, f). This indicates thatthe direct and lagged positive effects of CWD events across highlatitudes are mainly dominated by the warm component, whiledry conditions have negative effects. Therefore, the warminduced increase in productivity slightly exceeds that associatedwith CWD events (Supplementary Fig. 9b). Soil moisture underwarm springs shows positive anomalies (Supplementary Fig. 9c,d), while they slightly decline during dry spring (SupplementaryFig. 9g, h). This suggests that the positive anomalies in soil waterduring CWD spring are driven by the warm component.4CWD events reduce vegetation productivity in mid-latitudes.Here, we first investigate the direct effects of springtime andsummertime CWD events across mid-latitudes (23.5–50 N/S).Springtime productivity exhibits little changes during CWDspring (Fig. 4a, c), despite dry spring (Fig. 4d, f, g, i). Whenconsidering the direct effects of CWD events in summer, theresults are similar, whereas the negative magnitude of productivity in summer is larger than that in spring (Fig. 4b, c). Thisdifference suggests CWD conditions in summer show moreadverse effects on productivity than that in spring in midlatitudes. The anomalies in vegetation and TWS are consistent(Supplementary Fig. 10).Next, the lagged effects of springtime CWD events in midlatitudes are assessed. In cases with CWD spring but non-CWDsummer, summer productivity exhibits slight anomalies (Fig. 4a),with slightly decreased summer water (Fig. 4d, g). Summerproductivity and water show much higher reductions in case withconsecutive events (Fig. 4c, f, i) than for the case with only CWDsummer (Fig. 4b, e, h). These results are supported by theresponses of vegetation indices and TWS (Supplementary Fig. 10),revealing that springtime CWD events in mid-latitudes havenegative lagged effects on summer productivity and wateravailability.The direct and lagged effects of individual events are finallycompared with that of CWD events in mid-latitudes. Dryconditions in spring and summer directly decrease productivityand cause soil water dryness (Supplementary Fig. 11a–d). Moreover, dry spring depletes soil moisture earlier, which, in turn,causes dry summer and reduction in productivity during non-drysummer (Supplementary Fig. 11a, c). This indicates that drysprings have negative lagged effects on summer productivity. Incontrast, productivity and soil water show positive anomaliesduring warm springs, while they show negative anomalies insummer (Supplementary Fig. 11e–h). These results suggest thatthe direct and lagged negative effects of CWD springs aredominated by the dry component in mid-latitudes, while thewarm component mitigates the negative effects of the drycomponent in spring. Accordingly, the decline in productivitydue to dry conditions thus exceeds that triggered by CWD events(Supplementary Fig. 11b).Decreased vegetation productivity due to the negative synergistic effects of CCD events. Here, we first investigate the directeffects of CCD events across mid-to-high latitudes. Productivityreductions are found during springtime and summertime CCDevents (Fig. 5a–c) concurrent with water reductions (Fig. 5).Vegetation and TWS show similar behaviors during CCD springand summer (Supplementary Fig. 12). These results reveal thatCCD events in spring and summer can impose direct adverseimpacts on productivity and soil water across mid-to-high latitudes. The productivity reductions in spring and summer aresimilar in magnitude (Fig. 5a, b), indicating that CCD eventsbetween spring and summer can cause similar damage toproductivity.We then analyze the lagged effects of springtime CCD events.Our results indicate that springtime CCD events show negativelagged effects on summer productivity and cause summer waterreductions in mid-to-high latitudes (Fig. 5). Specifically, we findthat in cases with CCD spring but non-CCD summer, summerproductivity and water exhibit strongly negative anomalies(Fig. 5a, d, g). Moreover, summer anomalies are higher duringconsecutive events (Fig. 5c, f, i) than the cases including onlyCCD summer (Fig. 5b, e, h). Vegetation indices and TWS showsimilar responses (Supplementary Fig. 12). Our results furtherindicate that CCD spring has more severe negative lagged effectsCOMMUNICATIONS EARTH & ENVIRONMENT (2022)3:123 https://doi.org/10.1038/s43247-022-00455-0 www.nature.com/commsenv
COMMUNICATIONS EARTH & ENVIRONMENT ig. 3 Seasonal evolution of vegetation productivity and hydrological variables during CWD events in high latitudes ( 50 N). a–c The averagestandardized anomalies (z-score) of GPP during CWD spring but subsequent non-CWD summer (a), non-CWD spring but subsequent CWD summer (b),and consecutive CWD spring and summer (c) for areas in Fig. 2a where summer vegetation responds positively (r 0.22) to spring CWD climateconditions. d–f The same as a–c, but for soil moisture. g–i The same as a–c, but for runoff. The bar plots with dash lines (without dash line) indicate theaverage anomalies of multiple observation-based (model-based) products, and the circles indicate the average anomalies of each product. GLASS, LUE,NIRv, Flux-CRU, and Flux-ERA5 are observation-based GPP products, while model simulations are taken from TRENDYv6. GLEAM is observation-based soilmoisture. GRUN represents observation-based runoff. GLDAS-VIC, GLDAS-Noah, GLDAS-Catchment, and FLDAS indicate assimilatory soil moisture andrunoff that incorporate satellite- and ground-based observational products.Fig. 4 The responses of vegetation productivity and hydrological variables to CWD events in mid-latitudes (23.5–50 N/S). a–c The averagestandardized anomalies (z-score) of GPP during CWD spring but subsequent non-CWD summer (a), non-CWD spring but subsequent CWD summer (b),and consecutive CWD spring and summer (c) for areas in Fig. 2a where summer vegetation responds negatively (r 0.22) to spring CWD climateconditions. d–f The same as a–c, but for soil moisture. g–i The same as a–c, but for runoff. The bar plots with dash lines (without dash line) indicate theaverage anomalies of multiple observation-based (model-based) products, and the circles indicate the average anomalies of each product. For details ondata see Fig. 3.on productivity than CWD spring. That is, we find that incomparison to cases with preceding CWD spring and consecutiveCWD events, summer productivity shows higher reduction incases with preceding CCD spring and consecutive CCD events(Fig. 4a, c versus Fig. 5a, c). Moreover, in cases with CCD springbut non-CCD summer (Fig. 5a, d, g), summer anomalies are closeto those in scenarios with non-CCD spring but CCD summer(Fig. 5b, e, h). The vegetation and TWS anomalies furtherconfirm this situation (Supplementary Fig. 12a, b, d, e). Theseresults suggest that the lagged effects of CCD spring can be ofsimilar magnitude as their direct adverse effects.We finally compare the direct and lagged effects of individualevents with that of CCD events in mid-to-high latitudes. Coldconditions in spring and summer directly reduce productivity butshow weak effects on soil moisture (Supplementary Fig. 13a–d),and cold spring shows negative lagged effects on summerproductivity (Supplementary Fig. 13a). Dry events show directand lagged negative effects on productivity and soil moistureCOMMUNICATIONS EARTH & ENVIRONMENT (2022)3:123 https://doi.org/10.1038/s43247-022-00455-0 www.nature.com/commsenv5
ARTICLECOMMUNICATIONS EARTH & ENVIRONMENT https://doi.org/10.1038/s43247-022-00455-0Fig. 5 The effects of CCD events on vegetation productivity and hydrological variables in mid-to-high latitudes. a–c The average standardizedanomalies (z-score) of GPP during CCD spring but subsequent non-CCD summer (a), non-CCD spring but subsequent CCD summer (b), and consecutiveCCD spring and summer (c) for areas in Fig. 2b where summer vegetation responds negatively (r 0.22) to spring CCD climate conditions. d–f The sameas a–c, but for soil moisture. g–i The same as a–c, but for runoff. The bar plots with dash lines (without dash line) indicate the average anomalies of multipleobservation-based (model-based) products, and the circles indicate the average anomalies of each product. For details on data see Fig. 3.(Supplementary Fig. 13e–h). These results imply that the negativelagged effects of CCD springs are dominated by both cold and drycomponents. The effects of CCD events on productivity mostlyexceeds the individual dry or cold impacts (SupplementaryFig. 13a, b, e, f).Discussion and conclusionsOur combined use of observation- and model-based datasetssuggests that in high latitudes ( 50 N), CWD events can directlyand indirectly enhance vegetation productivity. Vegetation inhigh latitudes is primarily controlled by temperature, though lackof precipitation can suppress plant growth to some degree2.Hence, CWD events can directly increase productivity, despitethe inhibitory effects of dry conditions. CWD events in spring canpromote summer productivity by enhancing spring productivityvia increased leaf area which can help to sustain higher photosynthesis levels over summer and thus increase summerproductivity29. Notably, we find that spring greenness underCWD conditions is not associated with water dryness. Despitedecreased precipitation during CWD spring, increased temperature across high latitudes may thaw frozen water in soils, offsetting the lack of water input31,32. In contrast, summer wateravailability is reduced by CWD summer conditions. This suggeststhat summer (soil) dryness is primarily related to summer precipitation deficit in high latitudes. We further find that thewarming-induced increase in productivity exceeds that caused byCWD events. Accordingly, the direct and lagged positive effects ofCWD events are dominated by the warm component whereas thedry component can constrain productivity to some degree, partially offsetting the warm-induced positive effects.Across mid-latitudes (23.5–50 N/S), we find that springtimeCWD events can cause and amplify summer drought, leading tosummer productivity reduction. Water variation in mid-latitudesstrongly responds to precipitation33. The lack of precipitationcombined with increased ET during CWD spring results indepleted spring soil moisture earlier34. Such preconditions ultimately contribute to summer water limitations and reducesummer productivity14,35,36. Notably, although extremely hightemperatures usually negatively impact productivity in mid6latitudes, this does not hold during spring, where the negativeeffects of dry events are greater than that of CWD events.Anomalously warm spring temperatures can increase vegetationgrowth, partially offsetting the drought-related negative effects.Accordingly, increased vegetation greenness during the warmerspring can largely alleviate the negative impacts of dry events onvegetation photosynthesis during the subsequent summer34,37.Generally, elevated but non-extreme temperatures seem to compensate some of the effects of decreased precipitation in temperate and boreal areas38,39.In mid-to-high latitudes, we find directly and lagged adversesynergistic effects of CCD events on productivity. Temperate andboreal vegetation are most vulnerable to cold extremes19, whichoften negatively affect productivity and result in extensivereductions in productivity20. Moreover, our results suggest thatthe lagged effects of CCD spring can be of similar magnitude asdirect adverse effects. Spring cold events are regarded as climaticextremes with high ecological and evolutionary importance.Destruction of foliage, flowers and unripe fruits caused by springcold is a sustainable damage for plants because it negativelyimpacts on nutrient storage, growth, reproduction, leaf development, and even ultimately survival in subsequent years19. Thecoupling of cold with dry condition thus can cause long-termnegative effects on vegetation due to vegetation carryover effects.Terrestrial biosphere models tend to overestimate the area thatexperiences positive lagged effects to CWD spring, negative lagged effects associated with CCD spring, as well as direct negativeeffects to CCD conditions. This could affect the model’s ability topredict future carbon dynamics under climate changes. However,it is still unclear why these models do not well replicate theobserved response to environmental conditions. The bias betweenobservational-based and model products could be due to imperfect model parametrizations and lack of important physicalmechanisms. One major factor could be that the seasonal vegetation growth is not well represented in the models. Our resultsalso show a large discrepancy between the areal proportions ofnegative responses of LAI to CCD condition in observational andmodeled products. The overestimation of LAI in the models intheir negative response to CCD conditions could be a sign of thisbias. Sensitivity analyses and validation of model parameters byCOMMUNICATIONS EARTH & ENVIRONMENT (2022)3:123 https://doi.org/10.1038/s43247-022-00455-0 www.nature.com/commsenv
COMMUNICATIONS EARTH & ENVIRONMENT e and ground measurements could help to narrow downthe discrepancies.Overall, our analyses provide comprehensive insights into howvegetation productivity directly and indirectly responds to compound climate conditions. The results can serve as a basis for morereliable predictions of the summer productivity dynamics based oninformation from preceding springtime weather conditions.MethodsData sources. Long-term and multiple
temperature in spring and summer across global mid-to-high latitudes. We find regional asymmetries in direct and lagged effects of compound warm-dry events. In high-latitudes ( 50 N), compound warm-dry events raise productivity. In contrast, in mid-latitudes (23.5-50 N/S), compound warm-dry events reduce productivity and compound warm-dry